

Spatial variability of the effect of air pollution on term birth weight: evaluating influential factors using Bayesian hierarchical models
- PMID: 26850268
- PMCID: PMC4744429
- DOI: 10.1186/s12940-016-0112-5
Spatial variability of the effect of air pollution on term birth weight: evaluating influential factors using Bayesian hierarchical models
Abstract
Background: Epidemiological studies suggest that air pollution is adversely associated with pregnancy outcomes. Such associations may be modified by spatially-varying factors including socio-demographic characteristics, land-use patterns and unaccounted exposures. Yet, few studies have systematically investigated the impact of these factors on spatial variability of the air pollution's effects. This study aimed to examine spatial variability of the effects of air pollution on term birth weight across Census tracts and the influence of tract-level factors on such variability.
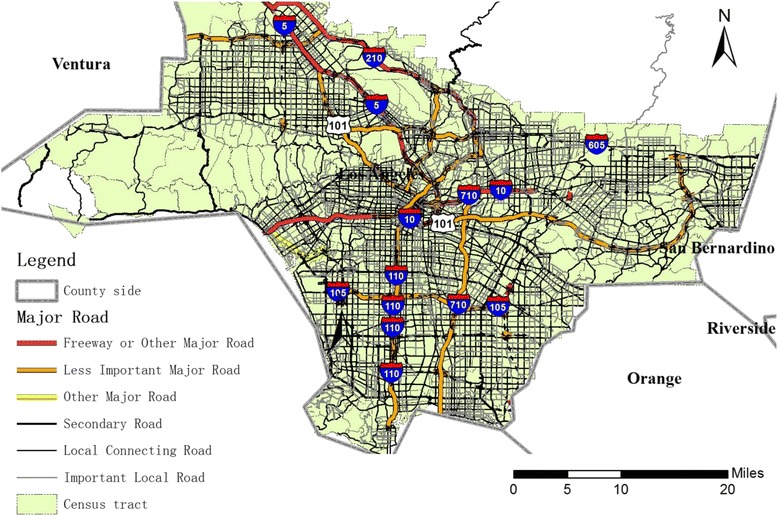
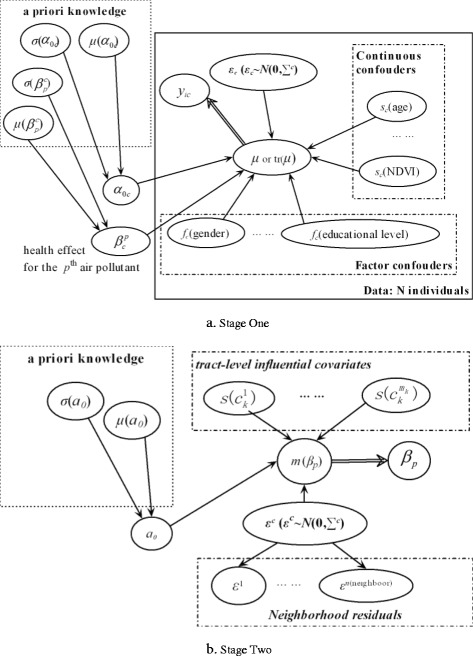
Methods: We obtained over 900,000 birth records from 2001 to 2008 in Los Angeles County, California, USA. Air pollution exposure was modeled at individual level for nitrogen dioxide (NO2) and nitrogen oxides (NOx) using spatiotemporal models. Two-stage Bayesian hierarchical non-linear models were developed to (1) quantify the associations between air pollution exposure and term birth weight within each tract; and (2) examine the socio-demographic, land-use, and exposure-related factors contributing to the between-tract variability of the associations between air pollution and term birth weight.
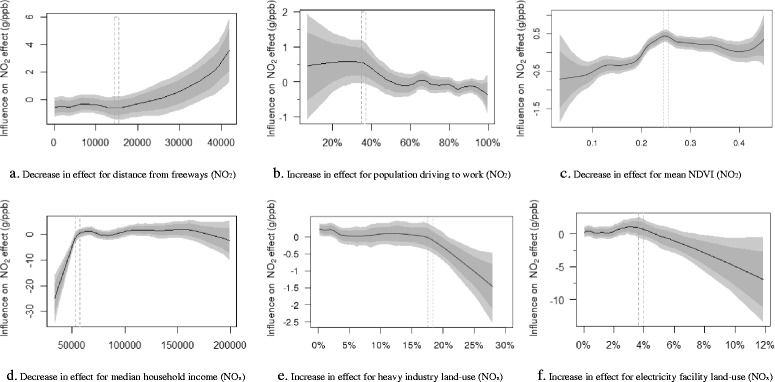
Results: Higher air pollution exposure was associated with lower term birth weight (average posterior effects: -14.7 (95 % CI: -19.8, -9.7) g per 10 ppb increment in NO2 and -6.9 (95 % CI: -12.9, -0.9) g per 10 ppb increment in NOx). The variation of the association across Census tracts was significantly influenced by the tract-level socio-demographic, exposure-related and land-use factors. Our models captured the complex non-linear relationship between these factors and the associations between air pollution and term birth weight: we observed the thresholds from which the influence of the tract-level factors was markedly exacerbated or attenuated. Exacerbating factors might reflect additional exposure to environmental insults or lower socio-economic status with higher vulnerability, whereas attenuating factors might indicate reduced exposure or higher socioeconomic status with lower vulnerability.
Conclusions: Our Bayesian models effectively combined a priori knowledge with training data to infer the posterior association of air pollution with term birth weight and to evaluate the influence of the tract-level factors on spatial variability of such association. This study contributes new findings about non-linear influences of socio-demographic factors, land-use patterns, and unaccounted exposures on spatial variability of the effects of air pollution.
Figures
Similar articles
-
Modeling spatial effects of PM(2.5) on term low birth weight in Los Angeles County.Environ Res. 2015 Oct;142:354-64. doi: 10.1016/j.envres.2015.06.044. Epub 2015 Jul 18. Environ Res. 2015. PMID: 26196780
-
Effects of short-term exposure to air pollution on hospital admissions of young children for acute lower respiratory infections in Ho Chi Minh City, Vietnam.Res Rep Health Eff Inst. 2012 Jun;(169):5-72; discussion 73-83. Res Rep Health Eff Inst. 2012. PMID: 22849236
-
Multi-pollutant exposure profiles associated with term low birth weight in Los Angeles County.Environ Int. 2016 May;91:1-13. doi: 10.1016/j.envint.2016.02.011. Epub 2016 Feb 15. Environ Int. 2016. PMID: 26891269
-
Ambient air pollution and low birth weight - are some women more vulnerable than others?Environ Int. 2017 Jul;104:146-154. doi: 10.1016/j.envint.2017.03.026. Epub 2017 Apr 6. Environ Int. 2017. PMID: 28390661 Review.
-
Ambient air pollution and adverse birth outcomes: methodologic issues in an emerging field.Basic Clin Pharmacol Toxicol. 2008 Feb;102(2):182-90. doi: 10.1111/j.1742-7843.2007.00161.x. Basic Clin Pharmacol Toxicol. 2008. PMID: 18226073 Free PMC article. Review.
Cited by
-
Gestational exposure to endocrine disrupting chemicals in relation to infant birth weight: a Bayesian analysis of the HOME Study.Environ Health. 2017 Oct 27;16(1):115. doi: 10.1186/s12940-017-0332-3. Environ Health. 2017. PMID: 29078782 Free PMC article.
-
Estimating missing values in China's official socioeconomic statistics using progressive spatiotemporal Bayesian hierarchical modeling.Sci Rep. 2018 Jul 3;8(1):10055. doi: 10.1038/s41598-018-28322-z. Sci Rep. 2018. PMID: 29968777 Free PMC article.
-
Characterization of fine particulate matter from indoor cooking with solid biomass fuels.Indoor Air. 2022 Nov;32(11):e13143. doi: 10.1111/ina.13143. Indoor Air. 2022. PMID: 36437670 Free PMC article.
-
Attributable Risk to Assess the Health Impact of Air Pollution: Advances, Controversies, State of the Art and Future Needs.Int J Environ Res Public Health. 2020 Jun 23;17(12):4512. doi: 10.3390/ijerph17124512. Int J Environ Res Public Health. 2020. PMID: 32585937 Free PMC article. Review.
-
Joint Impact of Synthetic Chemical and Non-chemical Stressors on Children's Health.Curr Environ Health Rep. 2019 Dec;6(4):225-235. doi: 10.1007/s40572-019-00252-6. Curr Environ Health Rep. 2019. PMID: 31637664 Free PMC article. Review.
References
-
- Bonzini M, Carugno M, Grillo P, Mensi C, Bertazzi A, Pesatori C. Impact of ambient air pollution on birth outcomes: systematic review of the current evidences. Med Lav. 2010;101(5):341–63. - PubMed
-
- Dominici F, Sheppard L, Clyde M. Health effects of air pollution: a statistical review. Int Stat Rev. 2003;71(2):243–76. doi: 10.1111/j.1751-5823.2003.tb00195.x. - DOI
Publication types
MeSH terms
Substances
LinkOut - more resources
Full Text Sources
Other Literature Sources
Medical
