. 2016 Feb 5;82(7):2210-8.
doi: 10.1128/AEM.03588-15.

High-Throughput Single-Cell Cultivation on Microfluidic Streak Plates

Affiliations

High-Throughput Single-Cell Cultivation on Microfluidic Streak Plates

Cheng-Ying Jiang et al. Appl Environ Microbiol. .

Abstract

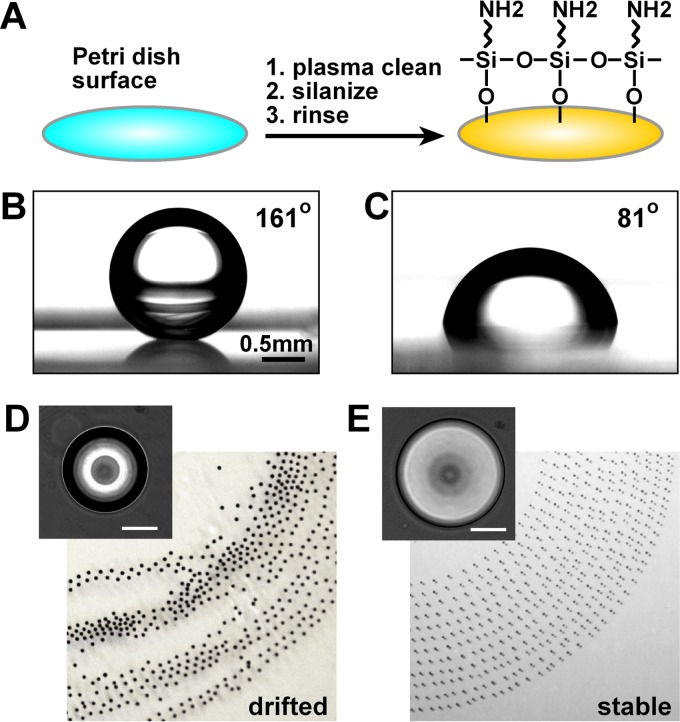
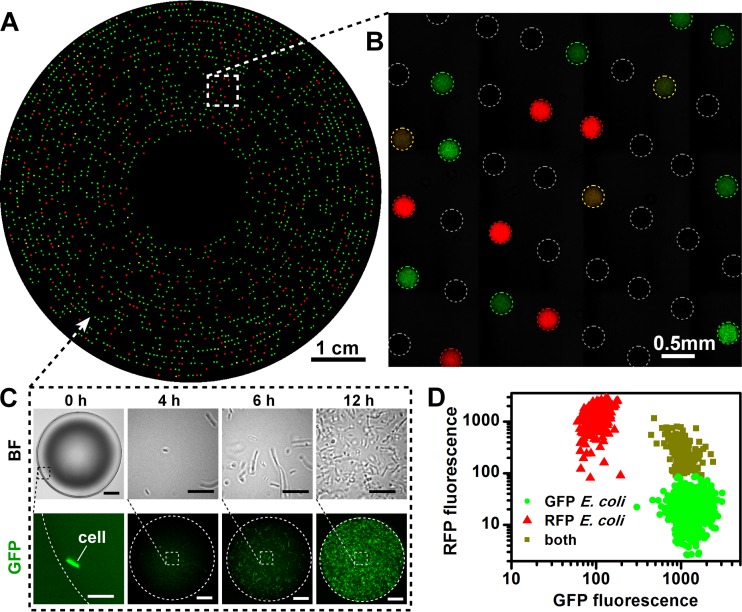
This paper describes the microfluidic streak plate (MSP), a facile method for high-throughput microbial cell separation and cultivation in nanoliter sessile droplets. The MSP method builds upon the conventional streak plate technique by using microfluidic devices to generate nanoliter droplets that can be streaked manually or robotically onto petri dishes prefilled with carrier oil for cultivation of single cells. In addition, chemical gradients could be encoded in the droplet array for comprehensive dose-response analysis. The MSP method was validated by using single-cell isolation of Escherichia coli and antimicrobial susceptibility testing of Pseudomonas aeruginosa PAO1. The robustness of the MSP work flow was demonstrated by cultivating a soil community that degrades polycyclic aromatic hydrocarbons. Cultivation in droplets enabled detection of the richest species diversity with better coverage of rare species. Moreover, isolation and cultivation of bacterial strains by MSP led to the discovery of several species with high degradation efficiency, including four Mycobacterium isolates and a previously unknown fluoranthene-degrading Blastococcus species.


Figures

FIG 1
FIG 1
Work flow for microbial isolation from a mixture based on the MSP method.
FIG 2
FIG 2
Stabilization of the droplet array. (A) Procedure used to introduce amine groups to PS petri dishes by silanization. (B to E) Photographs of 2-μl LB droplets deposited and micrographs of 7-nl droplets in the array written on the surface under mineral oil before (B, D) and after (C, E) silanization.
FIG 3
FIG 3
Manual droplet streaking. (A) Schematic of a capillary-based device for writing droplets on a petri dish prefilled with mineral oil. (B) Photograph of the manual writing tip. (C) Close-up view of droplets flowing in Teflon tubing toward the writing tip. (D) Sessile-droplet array produced by manual streaking onto a petri dish. (E) Close-up view of the sessile-droplet array showing uniform footprint sizes.
FIG 4
FIG 4
Automated droplet streaking and application to antimicrobial susceptibility testing. (A) Schematic of a microfluidic device and automated dish drive for generating spiral droplet arrays. (B) Close-up view of continuous droplet deposition by a writing tip. (C) The program for serial dilution and mixing of red, yellow, and blue food dyes in droplets generated in sequence. (D) The resulting spiral droplet array with rainbow colors. (E) Micrograph showing a typical region of a spiral array of 180-pl droplets. (F) Testing of P. aeruginosa PAO1 susceptibility to colistin at concentrations increasing from 0 (inner tracks) to 100 (outer tracks) μg/ml. The green fluorescence micrograph of a typical region of the droplet array is shown, and droplets are outlined with white dots. (G) Integrated fluorescence intensity of 2,261 droplets with colistin concentrations ranging from 0 to 100 μg/ml. A.U., arbitrary units.
FIG 5
FIG 5
Isolation and cultivation of bacterial cells from a mixture of RFP-tagged E. coli RP437 and GFP-tagged E. coli RP1616. (A, B) Overlaid green and red fluorescence images of the droplet array after 24 h of cultivation. Droplets are outlined with white dots. (C) Time-lapse micrographs of green fluorescence showing the growth of single RP1616 cells in a droplet. The scale bars are 50 μm for droplets and 5 μm for close-up views. Dots outline the edges of droplets. BF, bright field. (D) Scatter plot of green and red fluorescence of droplets with growth of only RP1616, only RP437, or a mixture of both strains.
FIG 6
FIG 6
Rapid recovery of microbial cells from MSPs after growth. (A) The coordinate positions of droplets that contain E. coli RP1616 cells were printed on paper as black dots. This paper was attached under the dish, and droplets were aligned with the dots for selective picking. (B) Picking of a droplet coordinate with a black dot with a toothpick for scale-up cultivation. (C) The success rate of droplet picking evaluated by growth of RP1616. A total of 144 droplets were picked, and 131 droplets were successfully scaled up with growth of RP1616 on an agar plate.
FIG 7
FIG 7
Isolation and characterization of a PAH-degrading community enriched from petroleum-contaminated soil. (A) Diagram of metagenomic DNA library construction and strain isolation with agar plates and MSPs. (B) Schematic of single-cell isolation and cultivation in droplets with MSM with fluoranthene supplied from mineral oil as the carbon source. (C) Typical micrographs of fast-growing, slow-growing, and biofilm-forming species. (D) Ranking of fluoranthene-degrading efficiencies of pure strains obtained by MSPs and agar plates according to fluoranthene removal in 9 days. (E, F) Rarefaction curves (E) and heat maps (F) of metagenomic sequencing of the original community, pooled cells from agar plates, and pooled cells from MSPs. Fluoranthene was used as the sole carbon source. (G) Cultivated isolates from MSPs and agar plates with genus names colored according to the metagenomic abundance of the community in various culture media. HTS, high-throughput sequencing.

Similar articles

Cited by

References

    1. Daniel R. 2005. The metagenomics of soil. Nat Rev Microbiol 3:470–478. doi:10.1038/nrmicro1160. - DOI - PubMed
    1. Li J, Jia H, Cai X, Zhong H, Feng Q, Sunagawa S, Arumugam M, Kultima JR, Prifti E, Nielsen T, Juncker AS, Manichanh C, Chen B, Zhang W, Levenez F, Wang J, Xu X, Xiao L, Liang S, Zhang D, Zhang Z, Chen W, Zhao H, Al-Aama JY, Edris S, Yang H, Wang J, Hansen T, Nielsen HB, Brunak S, Kristiansen K, Guarner F, Pedersen O, Dore J, Ehrlich SD, Bork P, Wang J. 2014. An integrated catalog of reference genes in the human gut microbiome. Nat Biotechnol 32:834–841. doi:10.1038/nbt.2942. - DOI - PubMed
    1. Whiteley AS, Bailey MJ. 2000. Bacterial community structure and physiological state within an industrial phenol bioremediation system. Appl Environ Microbiol 66:2400–2407. doi:10.1128/AEM.66.6.2400-2407.2000. - DOI - PMC - PubMed
    1. Fuhrman JA. 2009. Microbial community structure and its functional implications. Nature 459:193–199. doi:10.1038/nature08058. - DOI - PubMed
    1. Galand PE, Casamayor EO, Kirchman DL, Lovejoy C. 2009. Ecology of the rare microbial biosphere of the Arctic Ocean. Proc Natl Acad Sci U S A 106:22427–22432. doi:10.1073/pnas.0908284106. - DOI - PMC - PubMed

Publication types

MeSH terms

Substances