. 2016 Apr;357(1):103-13.
doi: 10.1124/jpet.115.230185. Epub 2016 Feb 5.

Genetic and Dietary Regulation of Glyburide Efflux by the Human Placental Breast Cancer Resistance Protein Transporter

Affiliations

Genetic and Dietary Regulation of Glyburide Efflux by the Human Placental Breast Cancer Resistance Protein Transporter

Kristin M Bircsak et al. J Pharmacol Exp Ther. 2016 Apr.

Abstract

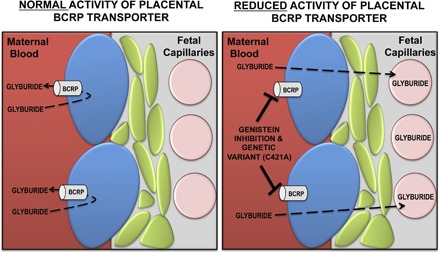
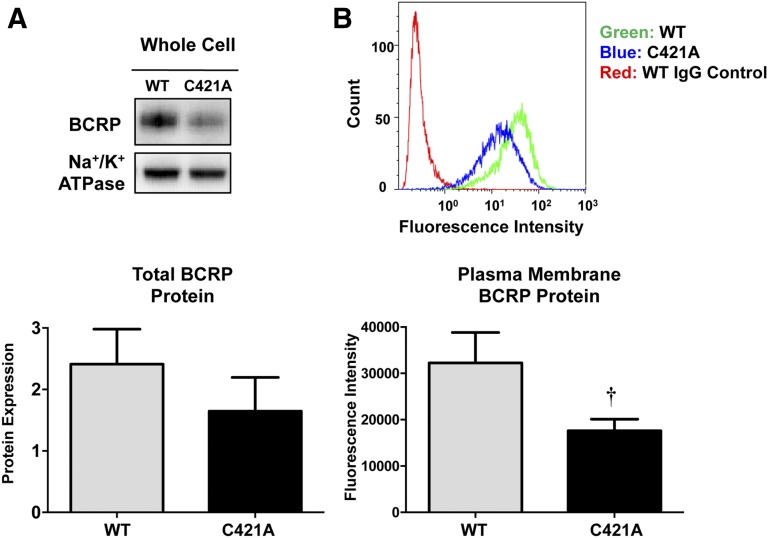
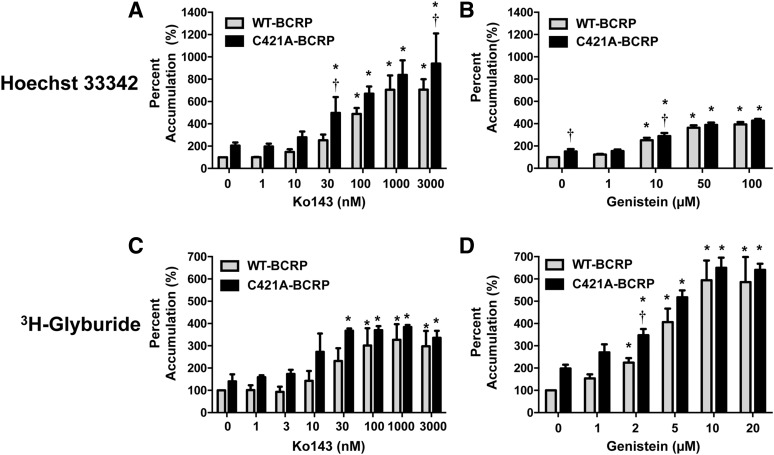
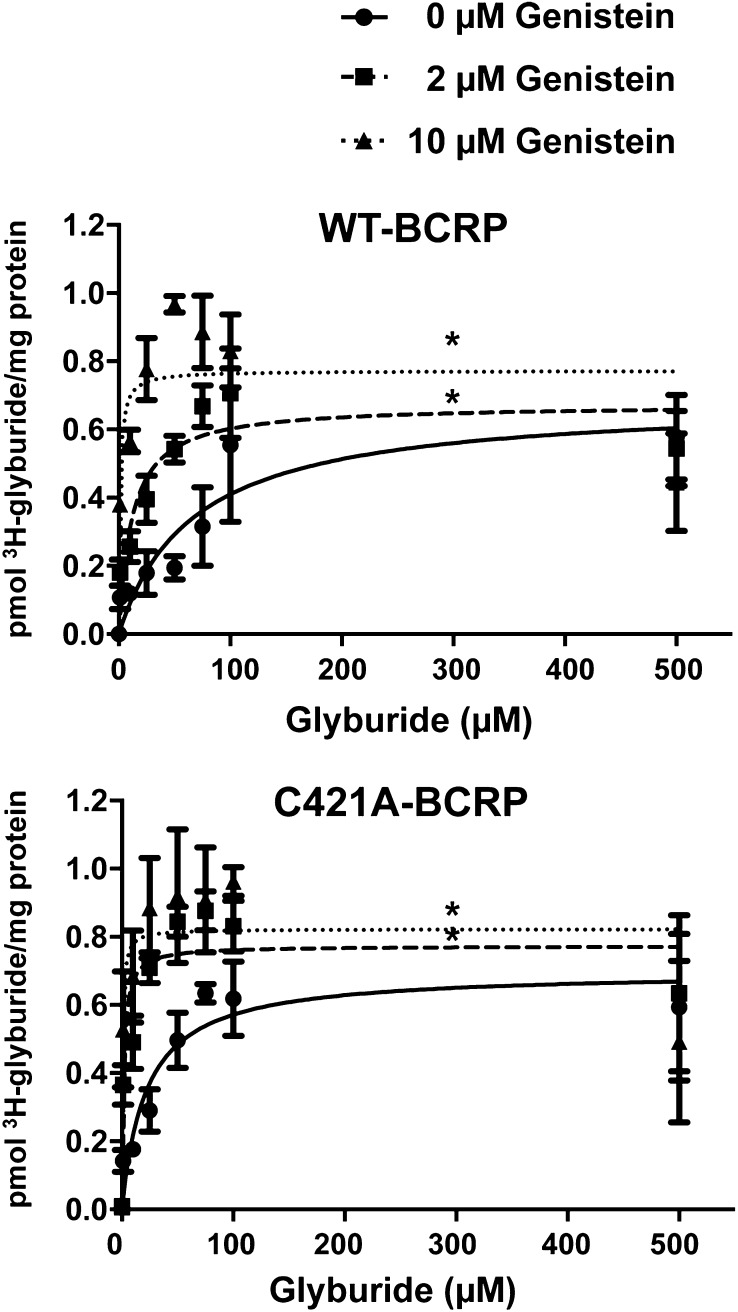
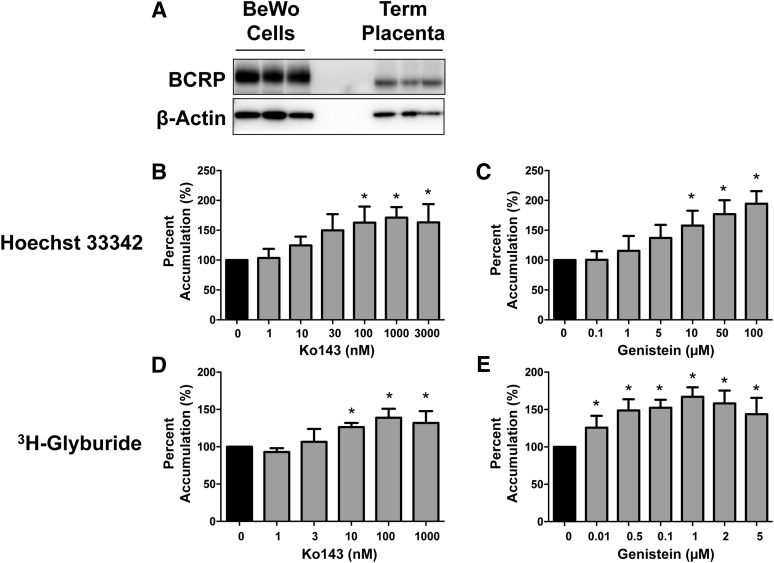
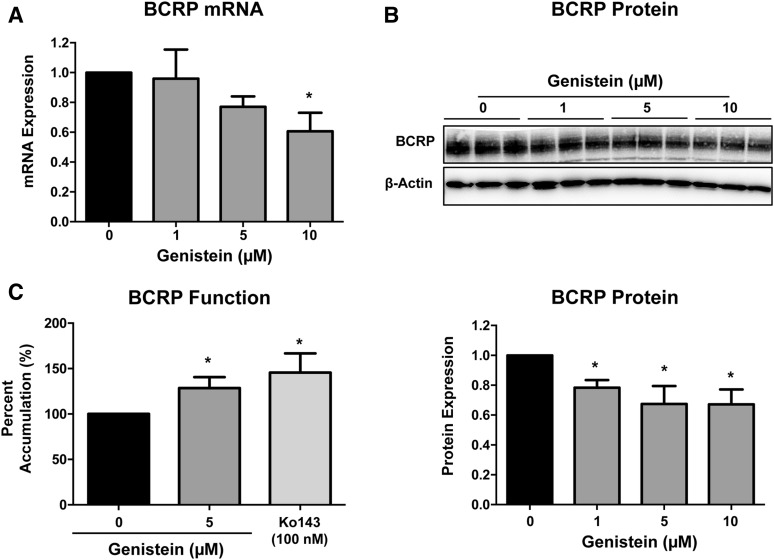
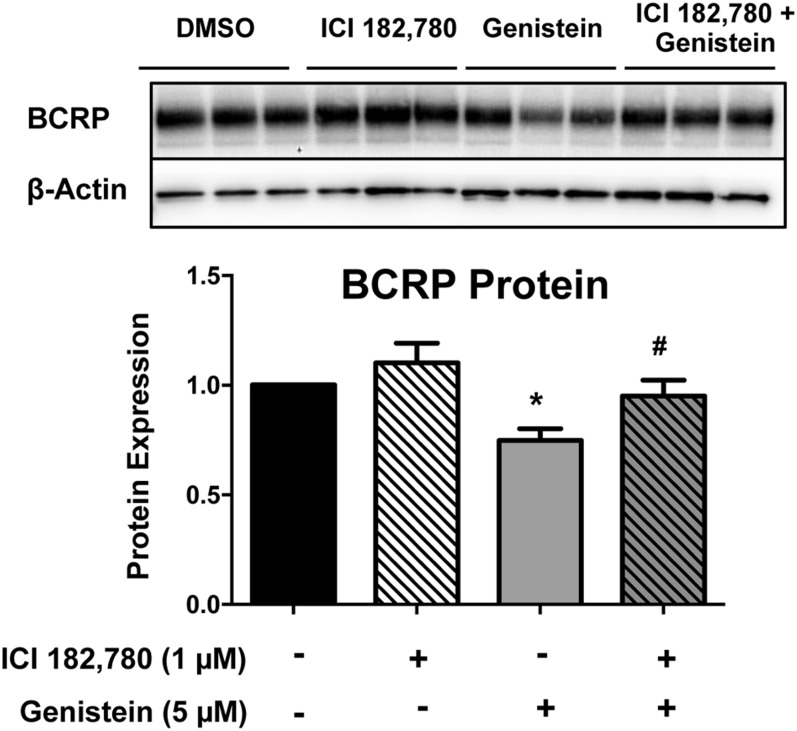
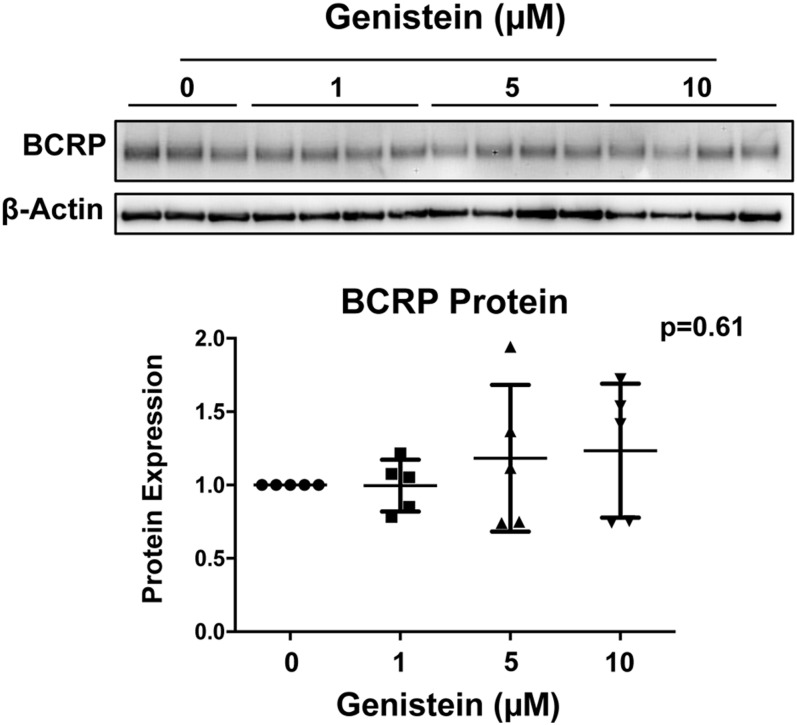
Glyburide is frequently used to treat gestational diabetes owing to its low fetal accumulation resulting from placental efflux by the breast cancer resistance protein (BCRP)/ABCG2 transporter. Here we sought to determine how exposure to the dietary phytoestrogen genistein and expression of a loss-of-function polymorphism in the ABCG2 gene (C421A) impacted the transport of glyburide by BCRP using stably transfected human embryonic kidney 293 (HEK) cells, human placental choriocarcinoma BeWo cells, and human placental explants. Genistein competitively inhibited the BCRP-mediated transport of (3)H-glyburide in both wild-type (WT) and C421A-BCRP HEK-expressing cells, with greater accumulation of (3)H-glyburide in cells expressing the C421A variant. In BeWo cells, exposure to genistein for 60 minutes increased the accumulation of (3)H-glyburide 30%-70% at concentrations relevant to dietary exposure (IC50 ∼180 nM). Continuous exposure of BeWo cells to genistein for 48 hours reduced the expression of BCRP mRNA and protein by up to 40%, which impaired BCRP transport activity. Pharmacologic antagonism of the estrogen receptor attenuated the genistein-mediated downregulation of BCRP expression, suggesting that phytoestrogens may reduce BCRP levels through this hormone receptor pathway in BeWo cells. Interestingly, genistein treatment for 48 hours did not alter BCRP protein expression in explants dissected from healthy term placentas. These data suggest that whereas genistein can act as a competitive inhibitor of BCRP-mediated transport, its ability to downregulate placental BCRP expression may only occur in choriocarcinoma cells. Overall, this research provides important mechanistic data regarding how the environment (dietary genistein) and a frequent genetic variant (ABCG2, C421A) may alter the maternal-fetal disposition of glyburide.


Figures

None
Graphical abstract
Fig. 1.
Fig. 1.
Characterization of BCRP protein in WT- and C421A-BCRP–overexpressing HEK cells. (A) BCRP protein expression in HEK whole-cell lysates was determined by Western blot (10 µg protein homogenate/lane). Na+/K+ ATPase was used as a loading control. Western blot data are presented as a representative Western blot from one experiment. The bar graph shows the semiquantitation of band densities and represents the mean ± S.D. from three independent experiments. (B) BCRP protein expression on the cell surface of HEK cells was determined by flow cytometry. Cells were incubated for 45 minutes with the phycoerthyrin-labeled anti-BCRP antibody (5D3) or the phycoerthyrin-labeled negative control IgG antibody (green: WT-BCRP 5D3 stained cells, blue: C421A-BCRP 5D3 stained cells, red: WT-BCRP IgG control). Flow cytometry histogram data are presented as one representative experiment. Bar graph represents mean ± S.D. fluorescence intensity of individual cells from three independent experiments. Statistically significant differences (P < 0.05) compared with WT-BCRP.
Fig. 2.
Fig. 2.
Inhibition of BCRP transport in WT- and C421A-BCRP overexpressing HEK cells. BCRP function was assessed by measuring the cellular accumulation of (A, B) Hoechst 33342 (7 µM) or (C, D) 3H-glyburide (10 µM unlabeled glyburide, 0.1 μM 3H-glyburide) in the presence of increasing concentrations of the BCRP-specific inhibitor, Ko143 or genistein. Intracellular fluorescence and radioactivity were quantified by a Cellometer Vision or a liquid scintillation counter, respectively. Bar graphs represent mean ± S.D. (n = 3 independent experiments). *Statistically significant differences (P < 0.05) compared with 0 µM genotype control. Statistically significant differences (P < 0.05) compared with WT-BCRP control.
Fig. 3.
Fig. 3.
Characterization of the genistein-glyburide interaction mediated by BCRP. BCRP function was assessed in WT- and C421A-BCRP HEK-expressing cells by measuring the cellular accumulation of 3H-glyburide (0–500 μM unlabeled glyburide, 0.1 μM 3H-glyburide) in the presence of increasing concentrations of genistein (0–10 µM) and was quantified using a liquid scintillation counter. Data represent mean ± S.D. (n = 3 independent experiments). Nonlinear regression analysis (Michaelis-Menten) was used for curve-fitting analysis. *Statistically significant differences (P < 0.05) in the mean rate of 3H-glyburide accumulation compared with the 0 µM control.
Fig. 4.
Fig. 4.
Inhibition of BCRP transport in placental BeWo cells. (A) BCRP protein expression in placental BeWo whole-cell lysates compared with human placenta plasma membrane fractions was determined by Western blot (9 µg of protein homogenate/lane). β-Actin was used as a loading control. (B–E) BCRP function was assessed in the presence of increasing concentrations of Ko143 (B, D) or genistein (C, E), by the accumulation of (B and C) Hoechst 33342 (15 µM), or (D, E) 3H-glyburide (0.1 μM). Intracellular fluorescence or radioactivity was quantified using a Nexcelom Cellometer Vision or a liquid scintillation counter, respectively. Bar graphs represent mean ± S.D. (n = 3 or 4 independent experiments). *Statistically significant differences (P < 0.05) compared with the 0 µM control.
Fig. 5.
Fig. 5.
Regulation of BCRP transporter expression and function in placental BeWo cells. After a 48-hour exposure to genistein (0–10 µM), (A) qPCR was used to quantify BCRP and housekeeping gene, RPL13A, mRNA expression in placental BeWo cells. (B) BCRP protein expression in placental BeWo whole-cell lysates was determined by Western blot (10 µg of protein homogenate/lane). β-Actin was used as a loading control. Western blot data are presented as a representative Western blot from one experiment. (C) BCRP function was assessed by the cellular accumulation of 3H-glyburide (0.1 μM), which was quantified using a liquid scintillation counter. All bar graphs represent mean ± S.D. (n = 3 or 4 independent experiments). *Statistically significant differences (P < 0.05) compared with the 0 µM genistein control.
Fig. 6.
Fig. 6.
Estrogen receptor-mediated regulation of the BCRP transporter in placental BeWo cells. BCRP protein expression in placental BeWo whole-cell lysates was determined by Western blot (10 µg of protein homogenate/lane) after a 48-hour exposure to the estrogen receptor antagonist, ICI 182,780 in the presence and absence of genistein. β-Actin was used as a loading control. All Western blot data are presented as a representative Western blot from one experiment. The bar graphs are the semiquantitation of band density and represent the mean ± S.D. from three independent experiments. *Statistically significant differences (P < 0.05) compared with the 0 µM control.
Fig. 7.
Fig. 7.
Regulation of BCRP transporter expression in human term placental explants. Five healthy human term placentas were collected and processed within 2 hour of delivery. Explants were cultured for 5 days with the media replaced every day, before treatment with genistein (1-10 µM) on day 5 for 48 hour. BCRP protein expression in total explant lysates was determined by western blot (5 µg protein homogenate/lane). β-Actin was used as a loading control. Western blot data are presented as a representative western blot from one placenta. The scatter dot plot is the semiquantitation of band density and represents five individual placentas with mean ± S.D.

Similar articles

Cited by

References

    1. Álvarez AI, Vallejo F, Barrera B, Merino G, Prieto JG, Tomás-Barberán F, Espín JC. (2011) Bioavailability of the glucuronide and sulfate conjugates of genistein and daidzein in breast cancer resistance protein 1 knockout mice. Drug Metab Dispos 39:2008–2012. - PubMed
    1. Anjalakshi C, Balaji V, Balaji MS, Seshiah V. (2007) A prospective study comparing insulin and glibenclamide in gestational diabetes mellitus in Asian Indian women. Diabetes Res Clin Pract 76:474–475. - PubMed
    1. Arai Y, Uehara M, Sato Y, Kimira M, Eboshida A, Adlercreutz H, Watanabe S. (2000) Comparison of isoflavones among dietary intake, plasma concentration and urinary excretion for accurate estimation of phytoestrogen intake. J Epidemiol 10:127–135. - PubMed
    1. Arias A, Rigalli JP, Villanueva SS, Ruiz ML, Luquita MG, Perdomo VG, Vore M, Catania VA, Mottino AD. (2014) Regulation of expression and activity of multidrug resistance proteins MRP2 and MDR1 by estrogenic compounds in Caco-2 cells: role in prevention of xenobiotic-induced cytotoxicity. Toxicology 320:46–55. - PubMed
    1. Atkinson DE, Sibley CP, Fairbairn LJ, Greenwood SL. (2006) MDR1 P-gp expression and activity in intact human placental tissue; upregulation by retroviral transduction. Placenta 27:707–714. - PubMed

Publication types

MeSH terms