. 2016 Apr;67(8):2191-205.
doi: 10.1093/jxb/erw023. Epub 2016 Feb 5.

Cellular and molecular insight into the inhibition of primary root growth of Arabidopsis induced by peptaibols, a class of linear peptide antibiotics mainly produced by Trichoderma spp

Affiliations

Cellular and molecular insight into the inhibition of primary root growth of Arabidopsis induced by peptaibols, a class of linear peptide antibiotics mainly produced by Trichoderma spp

Wei-Ling Shi et al. J Exp Bot. 2016 Apr.

Abstract

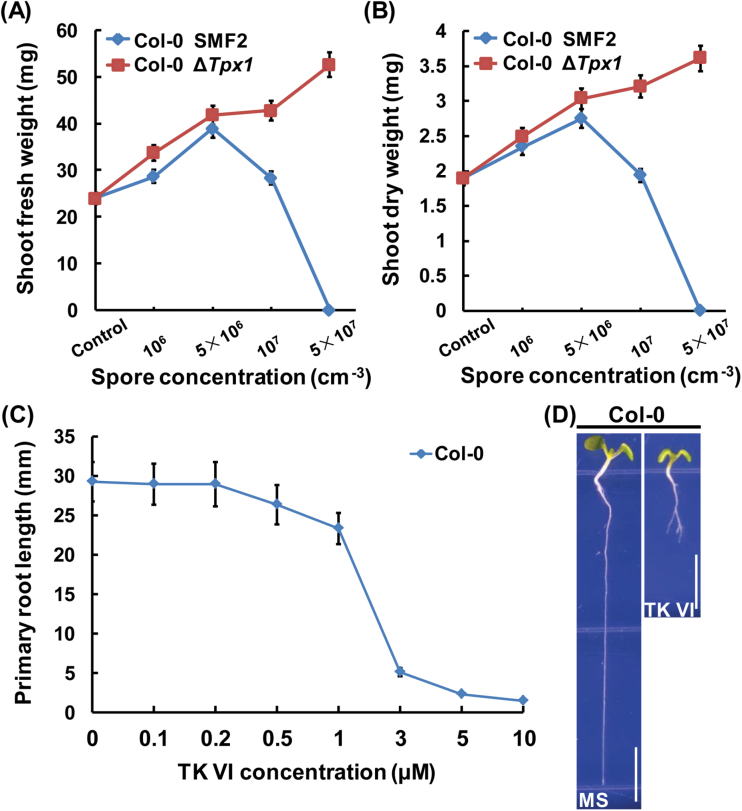
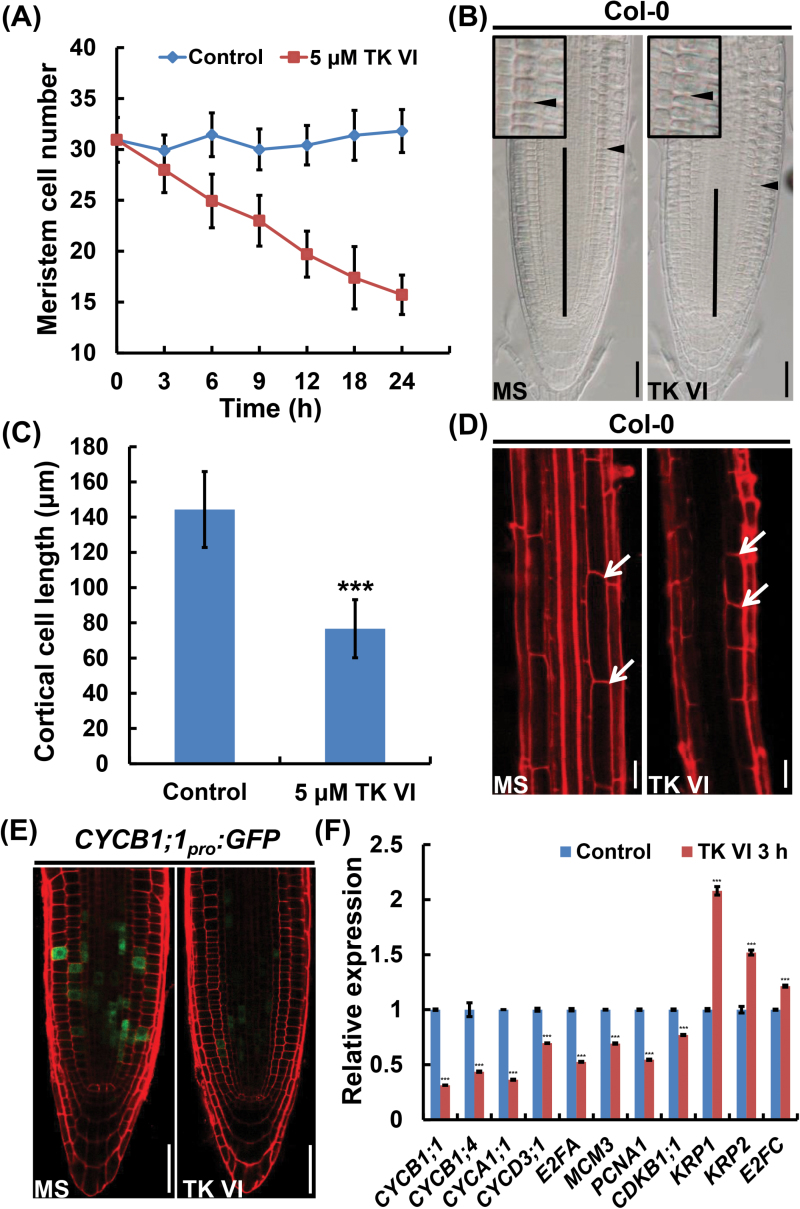
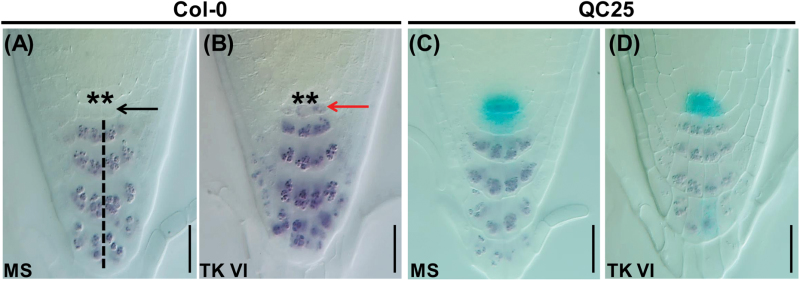
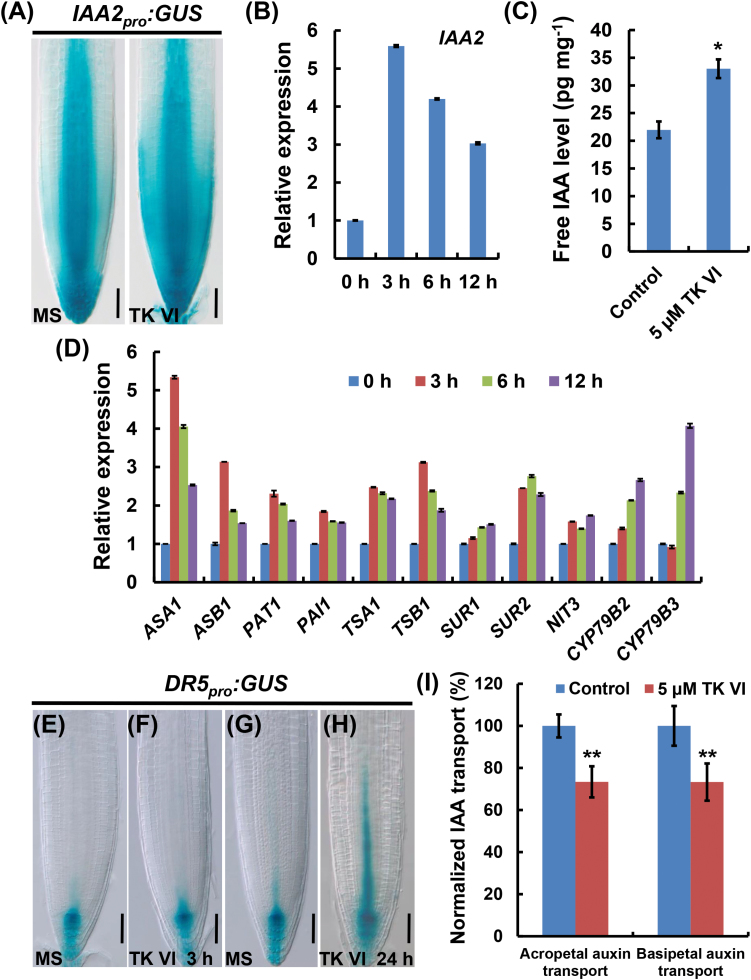
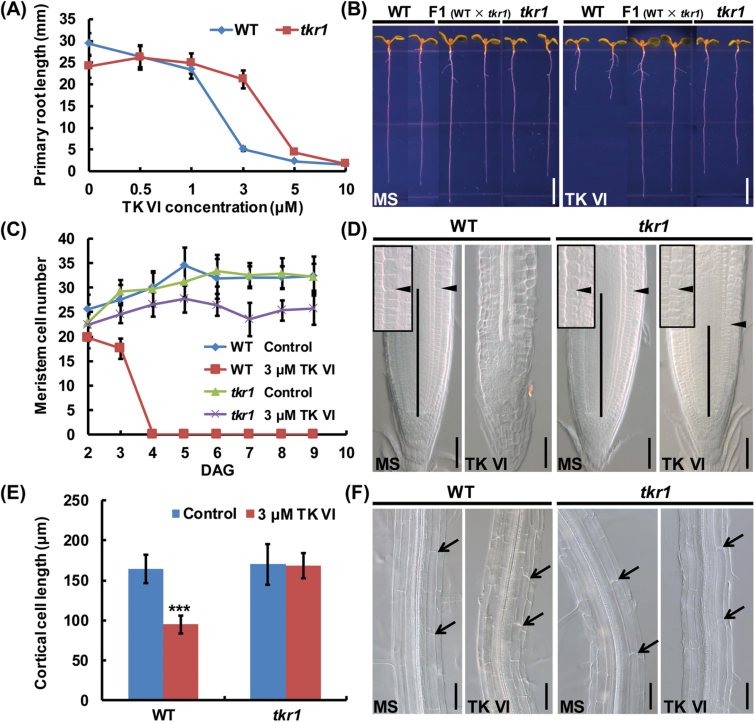
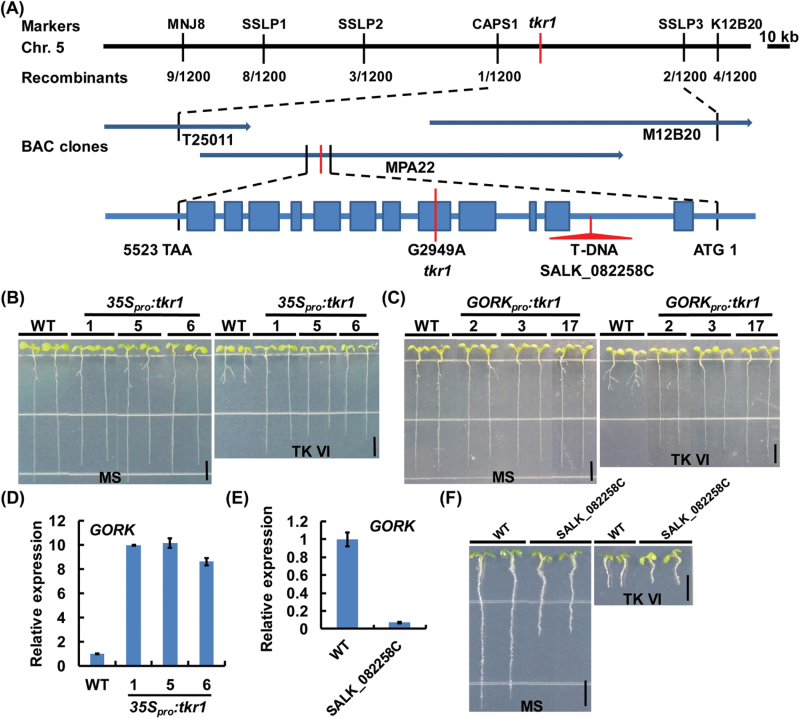
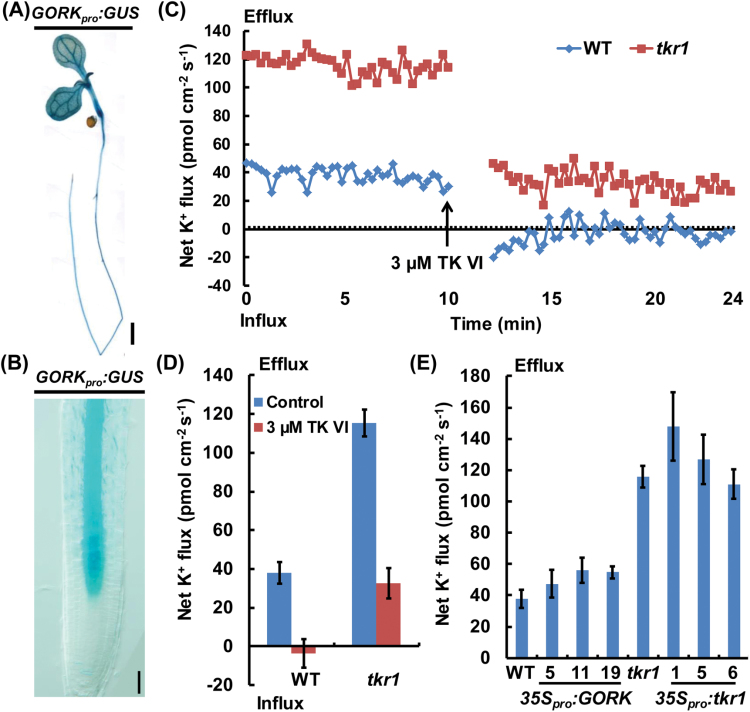
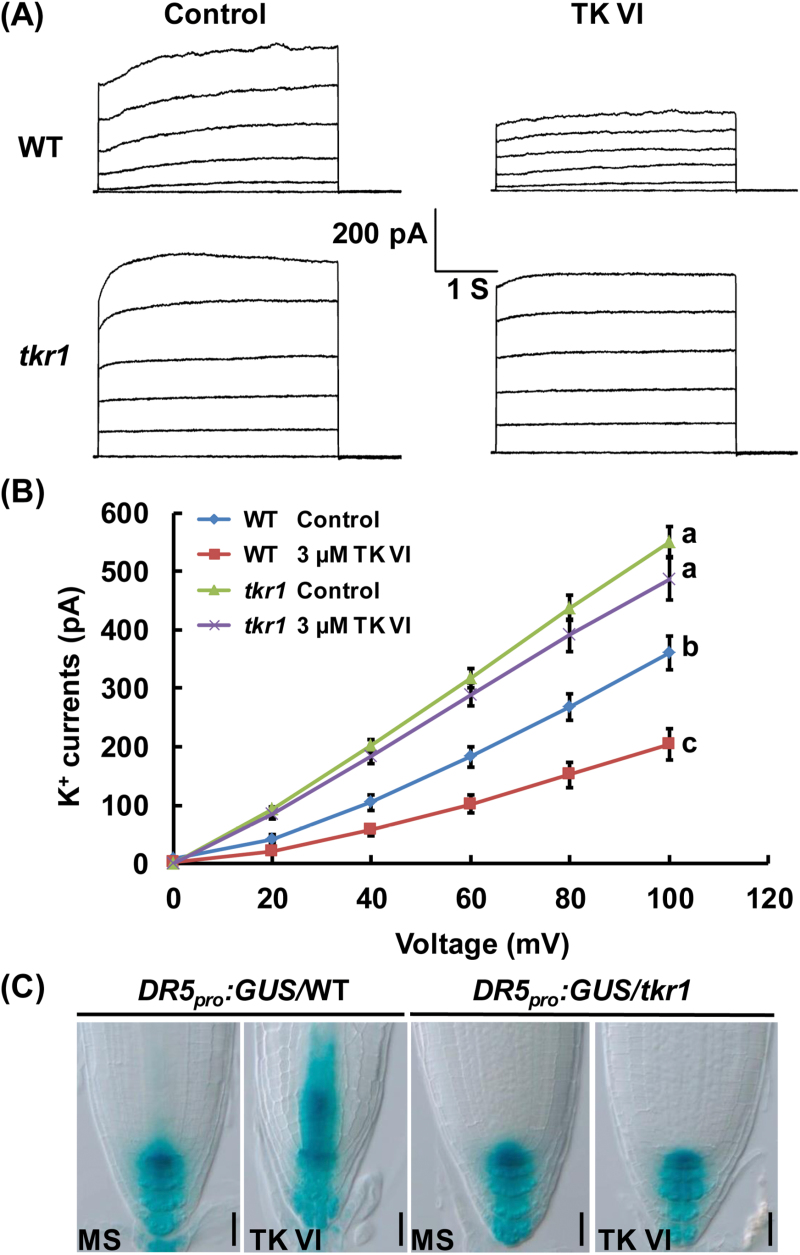
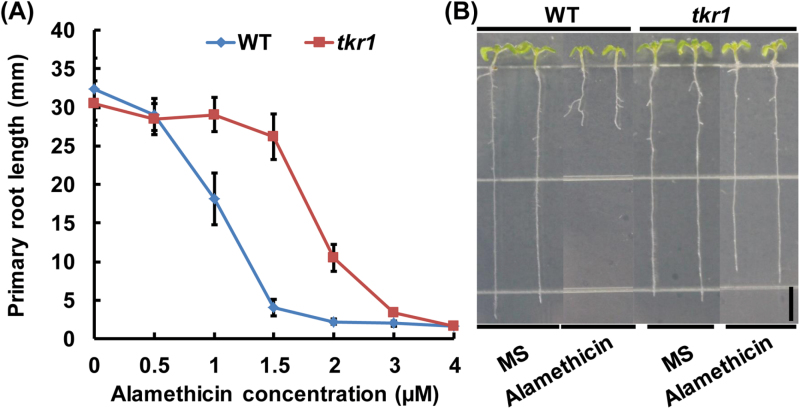
Trichoderma spp. are well known biocontrol agents that produce a variety of antibiotics. Peptaibols are a class of linear peptide antibiotics mainly produced by Trichoderma Alamethicin, the most studied peptaibol, is reported as toxic to plants at certain concentrations, while the mechanisms involved are unclear. We illustrated the toxic mechanisms of peptaibols by studying the growth-inhibitory effect of Trichokonin VI (TK VI), a peptaibol from Trichoderma longibrachiatum SMF2, on Arabidopsis primary roots. TK VI inhibited root growth by suppressing cell division and cell elongation, and disrupting root stem cell niche maintenance. TK VI increased auxin content and disrupted auxin response gradients in root tips. Further, we screened the Arabidopsis TK VI-resistant mutant tkr1. tkr1 harbors a point mutation in GORK, which encodes gated outwardly rectifying K(+)channel proteins. This mutation alleviated TK VI-induced suppression of K(+)efflux in roots, thereby stabilizing the auxin gradient. The tkr1 mutant also resisted the phytotoxicity of alamethicin. Our results indicate that GORK channels play a key role in peptaibol-plant interaction and that there is an inter-relationship between GORK channels and maintenance of auxin homeostasis. The cellular and molecular insight into the peptaibol-induced inhibition of plant root growth advances our understanding of Trichoderma-plant interactions.

Keywords: Arabidopsis thaliana; GORK; Trichoderma; Trichokonin VI.; auxin; peptaibols.


Figures

Fig. 1.
Fig. 1.
Growth inhibition of Col-0 seedlings by TKs produced by SMF2. (A, B) Statistical analysis of shoot fresh weight (A) and shoot dry weight (B) of Col-0 seedlings grown in soil without (Control) or with different concentrations of spores from wild-type SMF2 and ΔTpx1. ΔTpx1 is a mutant of SMF2 that does not produce TKs. Eight-day-old Col-0 seedlings were transplanted to soil without or with the indicated concentrations of spores from wild-type SMF2 and ΔTpx1. Plants were grown for an additional 2 weeks before their shoots were removed and weighed immediately (A) or weighed after drying at 65 °C for 3 d (B). Data shown are representative of at least three independent experiments. Each point represents the mean of 36 seedlings, and the error bars represent the SD of triplicate measurements. (C) Primary root length of 6 DAG (days after germination) Col-0 seedlings grown on medium with 0–10 μM TK VI. Data shown are averages with the SD (n>20). (D) Col-0 seedlings grown on medium without (MS) or with 5 μM TK VI at 6 DAG. Scale bars=5mm. (This figure is available in colour at JXB online.)
Fig. 2.
Fig. 2.
TK VI-induced inhibition of cell proliferation and cell elongation in the Col-0 root tip. (A) Time course of TK VI-induced reductions in root meristem size in Col-0 seedlings at 5 DAG. Data shown are averages with the SD (n=20). (B) Root meristems of 5 DAG Col-0 seedlings transplanted to medium without (MS) or with 5 μM TK VI for 12h. The meristem is marked with a vertical black line. The boundary between the meristem zone and the elongation zone is marked with a black arrowhead. The black box is an enlarged image of the boundary between the meristem zone and the elongation zone. (C) Cortical cell length in the differentiation zone of 5 DAG Col-0 seedlings grown on medium without (Control) or with 5 μM TK VI. Data shown are averages with the SD (n=20). The asterisks denote Student’s t-test significance compared with untreated plants: ***P<0.001. (D) Differentiation zones of seedlings mentioned in (C). The white arrowheads indicate the length of a single cortical cell. (E) TK VI-induced reduction in CYCB1;1 pro :GFP expression in Col-0. Six-day-old seedlings were transferred to medium without (MS) or with 5 μM TK VI for 3h before GFP fluorescence was monitored. (F) The effect of TK VI on the expression of cell cycle-related genes in the Col-0 root tip. Six-day-old Col-0 seedlings were transplanted to medium without (Control) or with 5 μM TK VI for 3h, and the 2mm root tips were harvested for RNA extraction and qRT–PCR analysis. The transcript levels of the indicated genes in Col-0 without TK VI treatment were arbitrarily set to 1. The error bars represent the SD of triplicate reactions. The asterisks denote Student’s t-test significance compared with untreated plants: ***P<0.001. Scale bars=50 μm (B, D, E).
Fig. 3.
Fig. 3.
TK VI-induced disruption of the maintenance of the root stem cell niche in Col-0. (A, B) TK VI-induced CSC differentiation in Col-0 as shown by Lugol staining. Six-day-old seedlings were transferred to medium without (MS) (A) or with (B) 5 μM TK VI for 12h before Lugol staining (dark brown). The asterisks denote QC cells. The black dashed line indicates the columella cell layers. The black arrowhead indicates a lack of starch accumulation in non-differentiated CSCs. The red arrowhead shows starch accumulation in TK VI-treated CSCs. (C, D) Disorganized QC cells and differentiated CSCs as shown by Lugol staining of the QC25 marker line. Six-day-old seedlings were transplanted to medium without (MS) (C) or with (D) 5 μM TK VI for 48h before double staining with GUS and Lugol was performed. Scale bars=20 µm (A–D).
Fig. 4.
Fig. 4.
TK VI-induced increase of auxin content and alteration of auxin response gradients in the Col-0 root tip. (A) TK VI-induced enhancement of IAA2 pro :GUS expression in the Col-0 root tip. Six-day-old seedlings were transferred to medium without (MS) or with 5 μM TK VI for 12h before GUS staining. (B) Time course of expression of IAA2 in response to TK VI treatment. (C) Free IAA measurement in Col-0 root tips in response to TK VI treatment. Six-day-old Col-0 seedlings were transplanted to medium without (Control) or with 5 μM TK VI for 3h before the 2mm root tips were harvested. Free IAA levels were then measured. The error bars represent the SD of triplicate measurements. The asterisks denote Student’s t-test significance compared with untreated plants: *P<0.05. (D) Time course of expression of auxin biosynthesis-related genes in response to TK VI treatment. For (B) and (D), 6-day-old Col-0 seedlings were treated with 5 μM TK VI for the indicated time periods, and the 2mm root tips were harvested for RNA extraction and qRT–PCR analysis. Transcript levels of the indicated genes in Col-0 without TK VI treatment were arbitrarily set to 1. The error bars represent the SD of triplicate reactions. (E, F, G, H) TK VI-induced disturbance of DR5 pro :GUS expression in the Col-0 root tip. Six-day-old seedlings were transferred to medium without (MS) or with 5 μM TK VI for the indicated times before GUS staining. (I) TK VI-induced repression of acropetal and basipetal auxin transport. Six-day-old Col-0 seedlings were transplanted to medium without (Control) or with 5 μM TK VI for 24h before acropetal and basipetal auxin transport assays were performed. The acropetal and basipetal auxin transport levels without TK VI treatment were arbitrarily set to 100%. Data shown are mean values of five biological repeats with the SD. The asterisks denote Student’s t-test significance compared with untreated plants: **P<0.01. Scale bars=50 µm (A, E, F, G, H).
Fig. 5.
Fig. 5.
Isolation and phenotyping of the TK VI-resistant mutant tkr1. (A) Primary root length of 6 DAG wild-type (WT) and tkr1 seedlings grown on medium with 0–10 μM TK VI. Data shown are averages with SD (n>20). (B) Phenotyping of 6 DAG seedlings of the WT, tkr1 mutant, and F1 progeny from a cross between the wild type and tkr1 grown on medium without (MS) or with 3 μM TK VI. (C) Root meristem size of WT and tkr1 seedlings grown on medium without (Control) or with 3 μM TK VI at 2–9 DAG. Data shown are averages with SD (n=20). (D) Root meristems of 9 DAG WT and tkr1 seedlings grown on medium without (MS) or with 3 μM TK VI. The meristem zone is marked with a vertical black line. The black arrowhead indicates the boundary between the meristem and the elongation zone. The black box is an enlarged image of the boundary between the meristem zone and the elongation zone. (E) Cortical cell length in the differentiation zone of 9 DAG WT and tkr1 seedlings grown on medium without (Control) or with 3 μM TK VI. Data shown are averages with SD (n=20). Asterisks denote Student’s t-test significance compared with untreated plants: ***P<0.001. (F) Images of the differentiation zone of the seedlings described in (E). Black arrowheads indicate the length of a single cortical cell. Scale bars=5mm (B), 50 µm (D, F).
Fig. 6.
Fig. 6.
Map-based cloning of the GORK gene. (A) Fine genetic and physical mapping of GORK. The target gene was initially mapped to a genetic interval between the markers MNJ8 and K12B20 on Arabidopsis chromosome 5. The analysis of a mapping population consisting of 1200 plants identified the target gene encoding GORK (At5g37500). In the GORK structure illustration, the filled boxes represent exons and the lines represent introns. Mutation and T-DNA insertion sites are shown in red. (B) Wild-type (WT) and 35S pro :tkr1 seedlings grown on medium without (MS) or with 3 μM TK VI at 6 DAG. (C) WT and GORK pro :tkr1 seedlings grown on medium without (MS) or with 3 μM TK VI at 6 DAG. (D) qRT–PCR analysis of GORK expression in 35S pro :tkr1 seedlings. (E) qRT–PCR analysis of GORK expression in SALK_082258C. For (D) and (E), 10-day-old seedlings were harvested for RNA extraction and qRT–PCR analysis. The transcript level of GORK in the WT was arbitrarily set to 1. The error bars represent the SD of triplicate reactions. (F) WT and SALK_082258C seedlings grown on medium without (MS) or with 3 μM TK VI at 6 DAG. Scale bars=5mm (B, C, F).
Fig. 7.
Fig. 7.
K+ flux analysis using NMT. (A, B) GORK pro :GUS expression pattern in seedlings at 5 DAG. (C) Transient K+ flux measurements upon TK VI (3 μM) shock in the elongation zone of the wild type (WT) and tkr1. Before the TK VI shock, steady K+ flux was examined for 10min. The data in the following 2min after TK VI shock are not shown for TK VI diffusion. Data shown are representative of at least three independent experiments. Each point represents the mean of six seedlings. (D) Mean efflux of K+ before and after TK VI shock in the WT and tkr1 seedlings described in (C). Data shown are averages with the SD (n=6) and are representative of at least three independent experiments. (E) Mean efflux of K+ in WT, tkr1, 35S pro :GORK, and 35S pro :tkr1 seedlings under control conditions. Steady K+ efflux in the indicated seedlings was examined for 15min. Data shown are averages with the SD (n=6) and are representative of at least three independent experiments. Scale bar=5mm (A), 50 µm (B).
Fig. 8.
Fig. 8.
The effect of TK VI on outward K+ currents as analyzed by patch-clamp whole-cell recordings. (A) Patch-clamp whole-cell recordings of outward K+ current traces in wild-type (WT) and tkr1 root cell protoplasts without (Control) or with 3 μM TK VI. Time and current scales shown in the middle apply to all traces. (B) The current/voltage relationship of the whole-cell outward K+ currents as illustrated in (A). The number of protoplasts measured for the curves were 16 (for WT), 14 (for WT treated with 3 μM TK VI), 11 (for tkr1), and 11 (for tkr1 treated with 3 μM TK VI). Data shown are averages with the SD. Samples with different letters are significantly different; P<0.001. (C) Effect of TK VI on auxin distribution gradients in the WT and tkr1. DR5 pro :GUS/WT and DR5 pro :GUS/tkr1 seeds were germinated on medium without (MS) or with 3 μM TK VI for 5 DAG before GUS staining assays were performed. Scale bars=50 µm.
Fig. 9.
Fig. 9.
Alamethicin effects on primary root growth in the wild type (WT) and tkr1 mutant. (A) Primary root length of 6 DAG WT and tkr1 seedlings grown on medium with 0–4 μM alamethicin (Sigma, purity ≥98%). Data shown are averages with the SD (n>20). (B) WT and tkr1 seedlings grown on medium without (MS) or with 1.5 μM alamethicin at 6 DAG. Scale bars=5mm.

Similar articles

Cited by

References

    1. Ache P, Becker D, Ivashikina N, Dietrich P, Roelfsema MRG, Hedrich R. 2000. GORK, a delayed outward rectifier expressed in guard cells of Arabidopsis thaliana, is a K+-selective, K+-sensing ion channel. FEBS Letters 486, 93–98. - PubMed
    1. Aida M, Beis D, Heidstra R, Willemsen V, Blilou I, Galinha C, Nussaume L, Noh YS, Amasino R, Scheres B. 2004. The PLETHORA genes mediate patterning of the Arabidopsis root stem cell niche. Cell 119, 109–120. - PubMed
    1. Bechtold N, Pelletier G. 1998. In planta Agrobacterium-mediated transformation of adult Arabidopsis thaliana plants by vacuum infiltration. Methods in Molecular Biology 82, 259–266. - PubMed
    1. Benítez T, Rincón AM, Limón MC, Codón AC. 2004. Biocontrol mechanisms of Trichoderma strains. International Microbiology 7, 249–260. - PubMed
    1. Béven L, Helluin O, Molle G, Duclohier H, Wróblewski H. 1999. Correlation between anti-bacterial activity and pore-sizes of two classes of voltage-dependent channel-forming peptides. Biochimica et Biophysica Acta 1420, 53–63. - PubMed

Publication types

MeSH terms