. 2016 May:89:126-35.
doi: 10.1016/j.nbd.2016.02.002. Epub 2016 Feb 2.

Matrix metalloproteinase-9 deletion rescues auditory evoked potential habituation deficit in a mouse model of Fragile X Syndrome

Affiliations

Matrix metalloproteinase-9 deletion rescues auditory evoked potential habituation deficit in a mouse model of Fragile X Syndrome

Jonathan W Lovelace et al. Neurobiol Dis. 2016 May.

Abstract

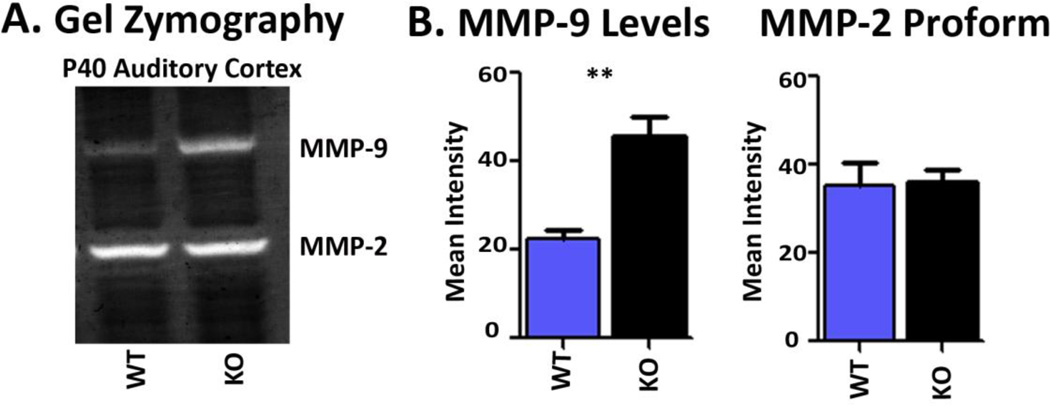
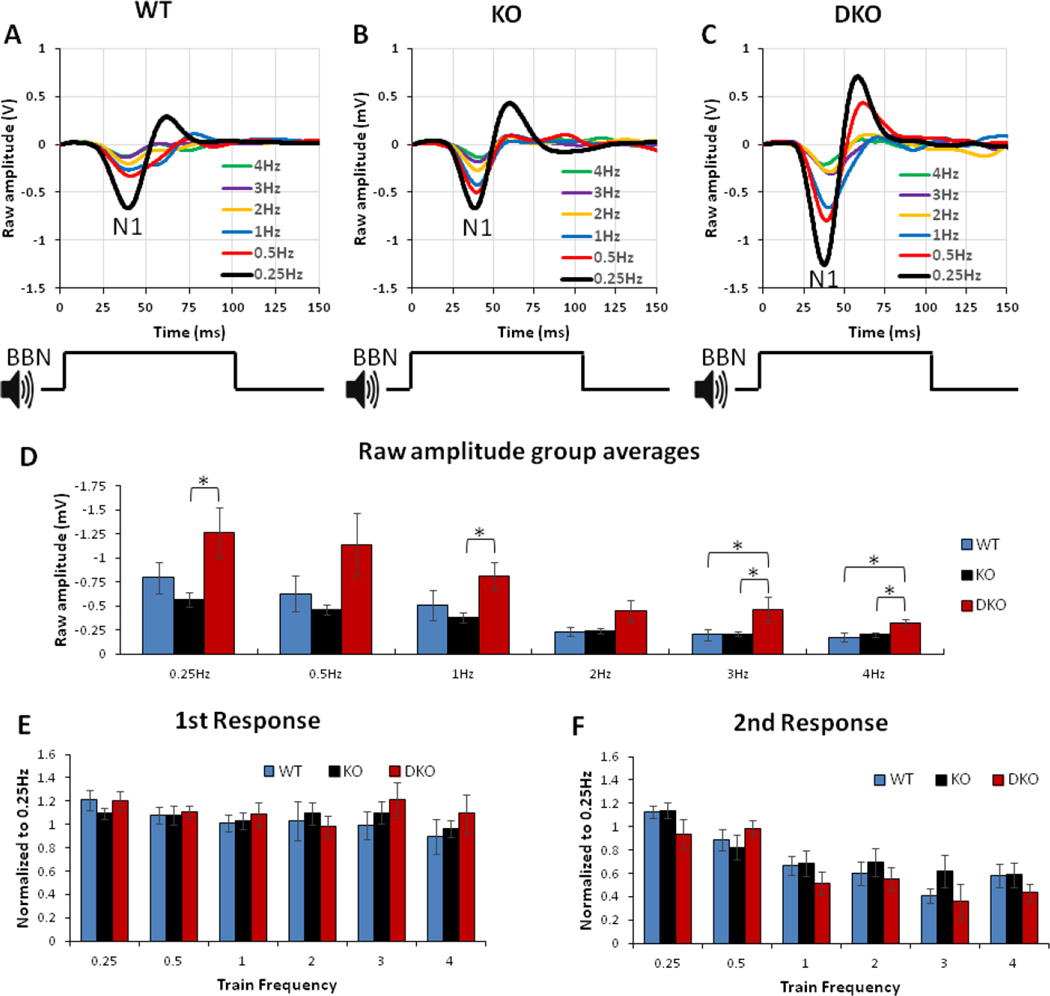
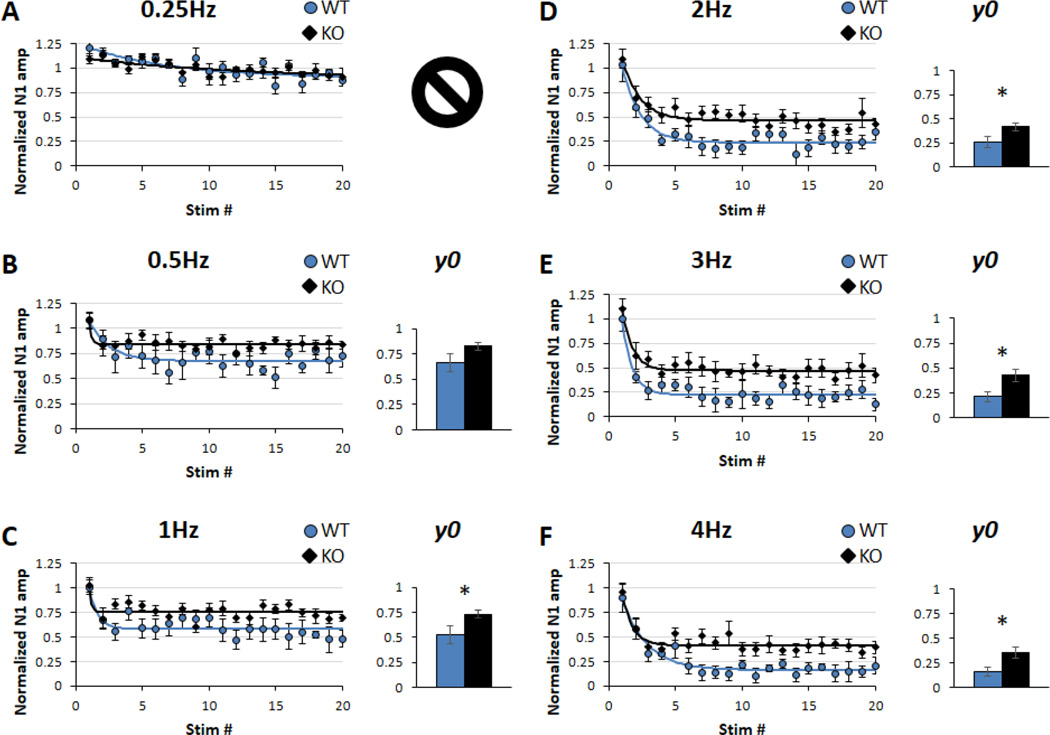
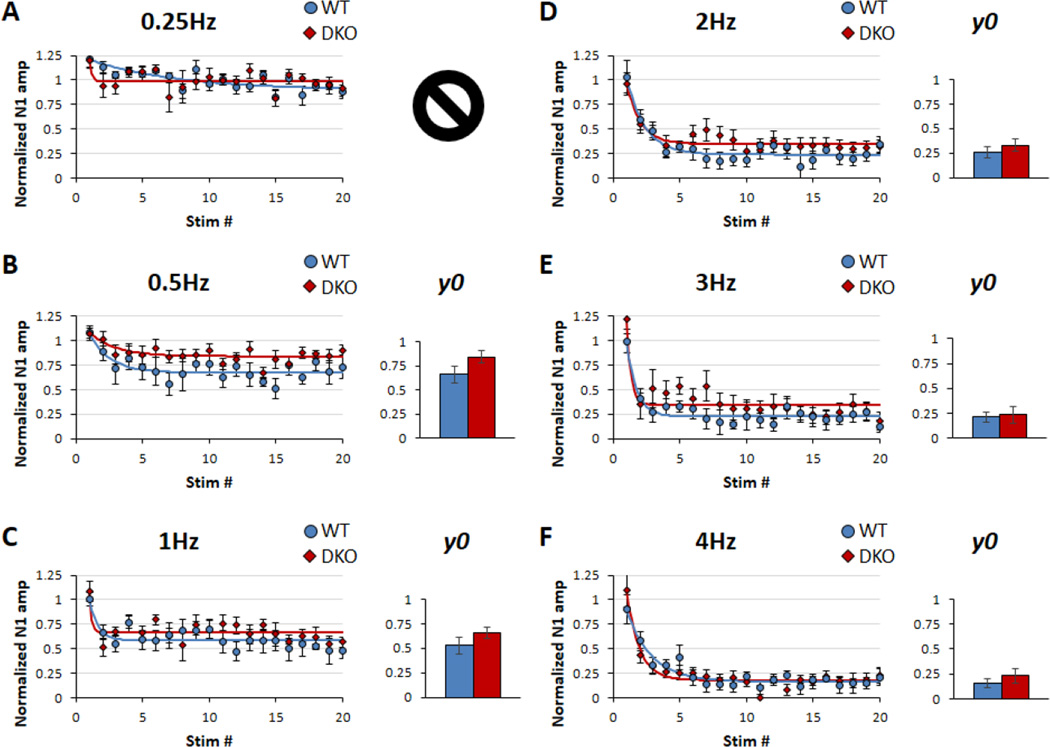
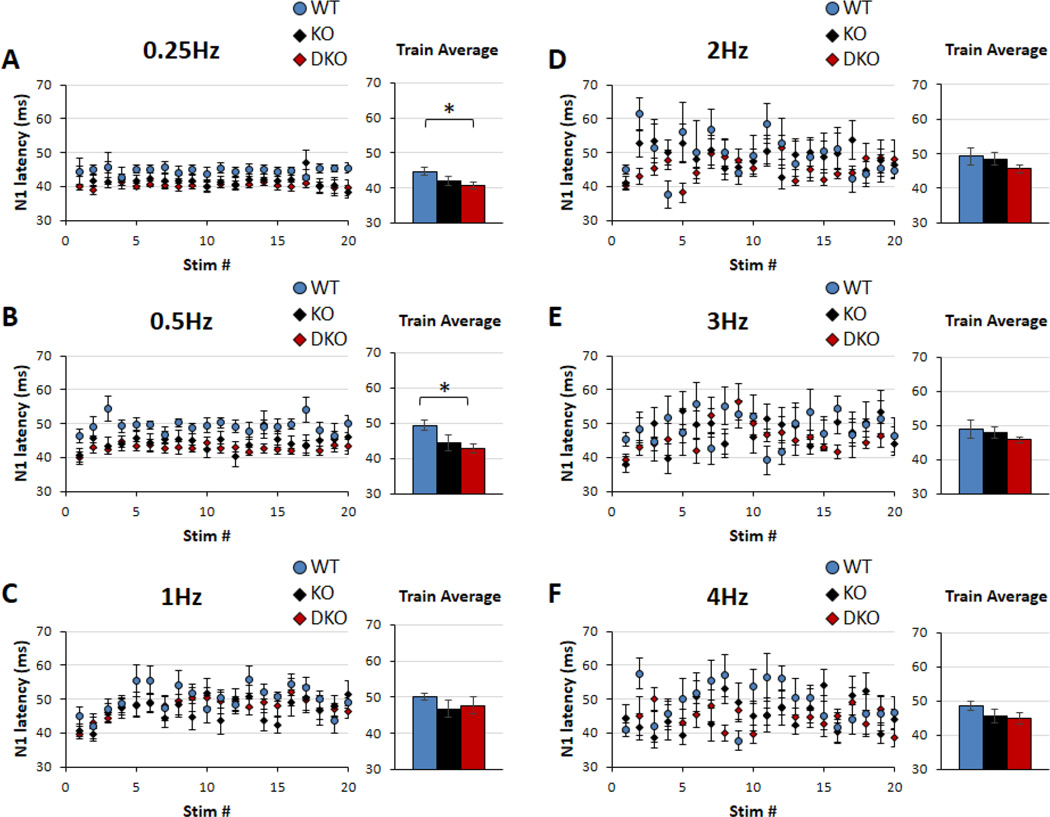
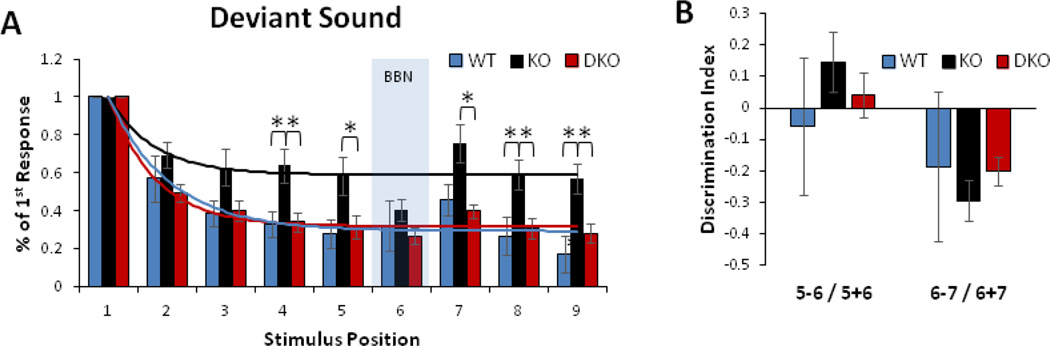
Sensory processing deficits are common in autism spectrum disorders, but the underlying mechanisms are unclear. Fragile X Syndrome (FXS) is a leading genetic cause of intellectual disability and autism. Electrophysiological responses in humans with FXS show reduced habituation with sound repetition and this deficit may underlie auditory hypersensitivity in FXS. Our previous study in Fmr1 knockout (KO) mice revealed an unusually long state of increased sound-driven excitability in auditory cortical neurons suggesting that cortical responses to repeated sounds may exhibit abnormal habituation as in humans with FXS. Here, we tested this prediction by comparing cortical event related potentials (ERP) recorded from wildtype (WT) and Fmr1 KO mice. We report a repetition-rate dependent reduction in habituation of N1 amplitude in Fmr1 KO mice and show that matrix metalloproteinase-9 (MMP-9), one of the known FMRP targets, contributes to the reduced ERP habituation. Our studies demonstrate a significant up-regulation of MMP-9 levels in the auditory cortex of adult Fmr1 KO mice, whereas a genetic deletion of Mmp-9 reverses ERP habituation deficits in Fmr1 KO mice. Although the N1 amplitude of Mmp-9/Fmr1 DKO recordings was larger than WT and KO recordings, the habituation of ERPs in Mmp-9/Fmr1 DKO mice is similar to WT mice implicating MMP-9 as a potential target for reversing sensory processing deficits in FXS. Together these data establish ERP habituation as a translation relevant, physiological pre-clinical marker of auditory processing deficits in FXS and suggest that abnormal MMP-9 regulation is a mechanism underlying auditory hypersensitivity in FXS.

Significance: Fragile X Syndrome (FXS) is the leading known genetic cause of autism spectrum disorders. Individuals with FXS show symptoms of auditory hypersensitivity. These symptoms may arise due to sustained neural responses to repeated sounds, but the underlying mechanisms remain unclear. For the first time, this study shows deficits in habituation of neural responses to repeated sounds in the Fmr1 KO mice as seen in humans with FXS. We also report an abnormally high level of matrix metalloprotease-9 (MMP-9) in the auditory cortex of Fmr1 KO mice and that deletion of Mmp-9 from Fmr1 KO mice reverses habituation deficits. These data provide a translation relevant electrophysiological biomarker for sensory deficits in FXS and implicate MMP-9 as a target for drug discovery.

Keywords: Auditory cortex; Autism; Cortical event related potentials; Fragile X Syndrome; Matrix metalloproteinase-9; Sensory hypersensitivity.


Conflict of interest statement

We report no conflict of interest.

Figures

Figure 1
Figure 1. Mmp-9 levels are upregulated in the auditory cortex of adult Fmr1 KO mice
(A) Detection of the levels of MMP-9 and MMP-2 in P40 auditory cortex of WT and Fmr1 KO mice. Levels of the gelatinases were detected by gelatin zymography and quantified by densitometry. (B) Bar graphs show average levels of MMP-9 (left) and MMP-2 (right) and the error bars indicate SEM (n=5 mice per group). MMP-9 levels were higher in Fmr1 KO mice (KO) than in WT mice, t(8) = 4.65, p = 0.0016 (**); however there were no differences in the levels of MMP-2 between Fmr1 KO mice (KO) and WT mice, t(8) = 0.13, p = 0.8983.
Figure 2
Figure 2. Sound evoked ERPs in auditory cortex and early habituation
(A–C) Graphs show representative average ERPs across 20-sound presentation trains at different repetition rates plotted for individual examples from WT (A), Fmr1 KO (B), and Mmp-9/Fmr1 double KO (DKO) (C) mice. The N1 component is marked for all genotypes. The 100ms broadband noise (BBN) used as the stimulus is represented below the ERPs with sound onset at 0 msec. Habituation to broadband noise was calculated by normalizing each response in an individual train, to the average amplitude of 20 responses at the same recording location during a 0.25 Hz train of BBN. (D) Graph shows raw average amplitudes for each rate for WT (n=7 recording sites), Fmr1 KO (n=9 recording sites), and Mmp-9/Fmr1 DKO (n=7 recording sites) for each rate. (E) Graph shows average normalized N1 amplitudes during the first sound in each train and error bars indicate SEM. (F) Graph shows average normalized N1 amplitudes for the second sound in each train and error bars indicate SEM. The lack of differences in the normalized amplitudes during the first sound indicate stable responses throughout the recording session while no difference in the second response indicate that all genotypes habituate similarly early in the sound trains. Statistical analysis was performed using two-way ANOVA followed by Bonferonni Post-hoc comparisons showing significant differences between genotypes at specific rates (*p<0.05).
Figure 3
Figure 3. Fmr1 KO mice show a deficit in steady state habituation to sounds
Individual BBN trains were fit to an exponential decay function y = y0 + Ae(−x/t). The parameter y0, which represents the y value at which a limit is reached, was calculated for each train and averages between genotypes were compared for each repetition rate. Each line plotted in this figure was fit to the averaged group data points, conversely the histograms shown next to the plots are genotype averages of individually fitted curves. (A–F) Graphs show representative average ERPs in WT and Fmr1 KO mice across 20-sound presentation trains for 0.25Hz (A), 0.5 Hz (B), 1Hz (C), 2Hz (D), 3Hz (E) and 4Hz (F) repetition rates. At 0.25Hz repetition rate, multiple individual observation were unsuccessfully fit using the decay function, therefore statistical analysis of y0 could not be performed. (B) Student’s t-tests revealed no significant difference at 0.5Hz (p = 0.09). (C–F) Rates between 1Hz-4Hz had consistent differences (p < 0.05), with KO recordings being consistently higher than WT at steady state.
Figure 4
Figure 4. Mmp-9/Fmr1 DKO mice show rescue of deficit in steady state habituation of N1 amplitude
(A–F) Graphs show representative average ERPs in WT and Mmp-9/Fmr1 DKO mice across 20-sound presentation trains for 0.25Hz (A), 0.5 Hz (B), 1Hz (C), 2Hz (D), 3Hz (E) and 4Hz (F) repetition rates. The same procedures and comparisons were made here as in Figure 2. (A) At 0.25Hz repetition rate, multiple individual observation were unsuccessfully fit using the decay function, therefore statistical analysis of y0 could not be performed. (B–F) Student’s t-tests revealed no significant difference between WT and DKO recordings at any rate tested (p > 0.05).
Figure 5
Figure 5. N1 Latencies are not different between WT and Fmr1 KO mice
(A–F) Graphs show average N1 latencies and error bars indicate SEM. (A) Averaged N1 latencies at 0.25Hz were very consistent across the entire stimulus train for all genotypes. Statistical analysis was performed using two-way ANOVA followed by Bonferonni Post-hoc comparisons showing significant differences in average N1 latencies between WT and DKO genotypes at 0.25Hz (A, *p<0.05) and 0.5Hz (B, *p<0.05). (C–F) All other rates were tested in the same manner; no differences were seen between genotypes for latency at theses fast rates.
Figure 6
Figure 6. Deviant sound paradigm at 5Hz reveals habituation deficit in Fmr1 KO but not Mmp-9/Fmr1 DKO
(A) All sounds in the train consisted of 12 kHz tone pips and a deviant BBN sound presentation in the 6th position (highlighted area). Lines were fit to a decay function using genotype averages. After normalization to the 1st response in the train there was an effect of genotype and position in the train. WT (blue, n = 5 recording sites); KO (black, n = 9 recording sites); DKO (red, n = 7 recording sites). (B) Discrimination indexes were calculated for differences in response to the deviant noise showing no difference between genotypes. In general, a specific deficit in steady state levels of habituation was restricted to KO animals using tone pips at 5Hz, similar to the KO deficit to BBN at high rates, with the DKO mice showing responses similar to WT mice. Statistical analysis was performed using two-way ANOVA followed by Bonferonni Post-hoc comparisons showing significant differences between genotypes at specific positions in the train (*p<0.05).

Similar articles

Cited by

References

    1. Bailey DB, Jr, Mesibov GB, Hatton DD, Clark RD, Roberts JE, Mayhew L. Autistic behavior in young boys with fragile X syndrome. J Autism Dev Disord. 1998;28:499–508. - PubMed
    1. Bilousova TV, Dansie L, Ngo M, Aye J, Charles JR, Ethell DW, Ethell IM. Minocycline promotes dendritic spine maturation and improves behavioural performance in the fragile X mouse model. J Med Genet. 2009;46(2):94–102. - PubMed
    1. Cabungcal JH, Steullet P, Morishita H, Kraftsik R, Cuenod M, Hensch TK, Do KQ. Perineuronal nets protect fast-spiking interneurons against oxidative stress. Proc Natl Acad Sci U S A. 2013;110:9130–9135. - PMC - PubMed
    1. Castren M, Paakkonen A, Tarkka IM, Ryynanen M, Partanen J. Augmentation of auditory N1 in children with fragile X syndrome. Brain Topography. 2003;15:165–171. - PubMed
    1. Chen L, Toth M. Fragile X mice develop sensory hyperreactivity to auditory stimuli. Neuroscience. 2001;103:1043–1050. - PubMed

Publication types

MeSH terms

Substances