. 2016 Mar 15;196(6):2591-601.
doi: 10.4049/jimmunol.1501120. Epub 2016 Feb 5.

Impairment of Mature B Cell Maintenance upon Combined Deletion of the Alternative NF-κB Transcription Factors RELB and NF-κB2 in B Cells

Affiliations

Impairment of Mature B Cell Maintenance upon Combined Deletion of the Alternative NF-κB Transcription Factors RELB and NF-κB2 in B Cells

Nilushi S De Silva et al. J Immunol. .

Abstract

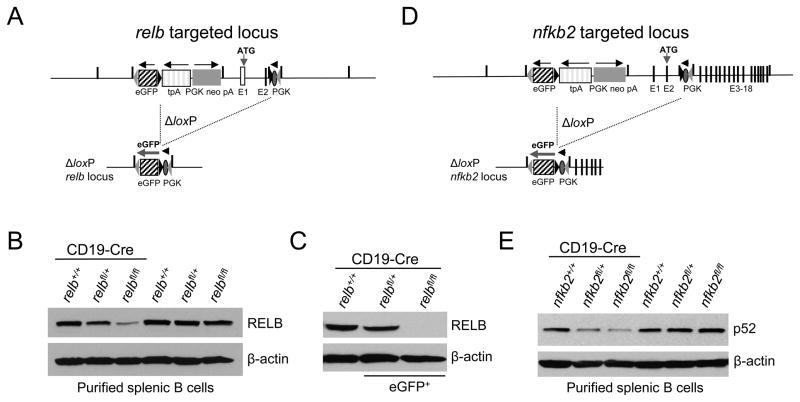
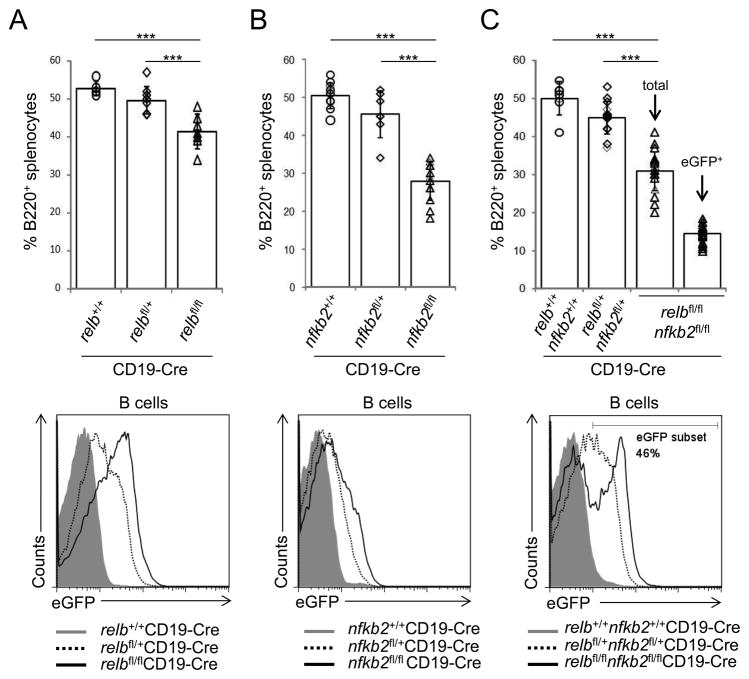
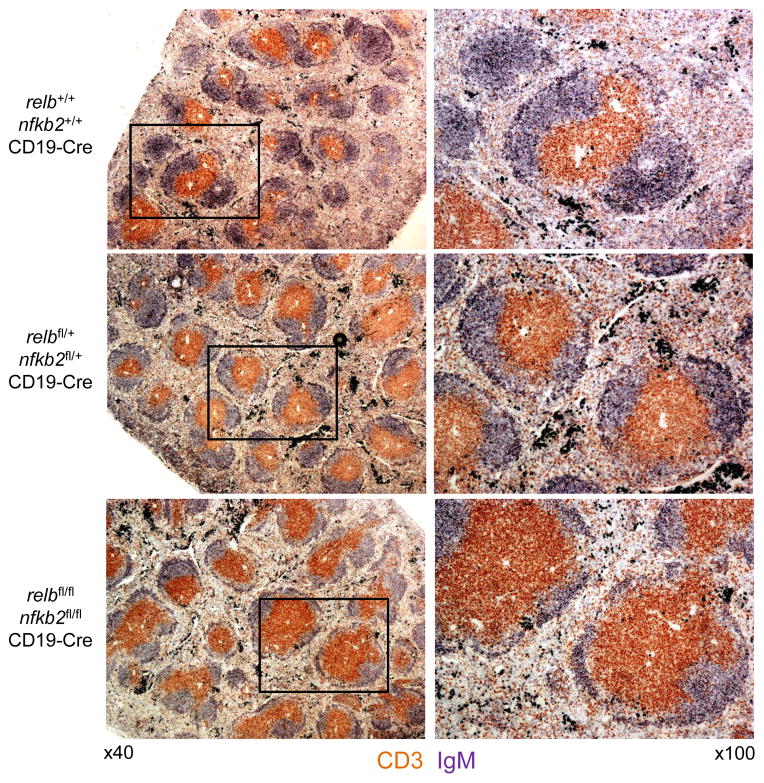
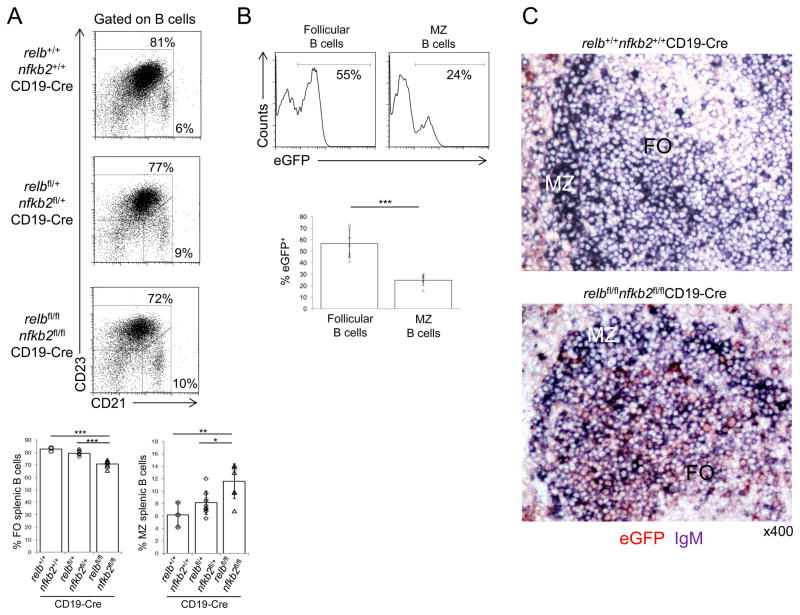
BAFF is critical for the survival and maturation of mature B cells. BAFF, via BAFFR, activates multiple signaling pathways in B cells, including the alternative NF-κB pathway. The transcription factors RELB and NF-κB2 (p100/p52) are the downstream mediators of the alternative pathway; however, the B cell-intrinsic functions of these NF-κB subunits have not been studied in vivo using conditional alleles, either individually or in combination. We in this study report that B cell-specific deletion of relb led to only a slight decrease in the fraction of mature splenic B cells, whereas deletion of nfkb2 caused a marked reduction. This phenotype was further exacerbated upon combined deletion of relb and nfkb2 and most dramatically affected the maintenance of marginal zone B cells. BAFF stimulation, in contrast to CD40 activation, was unable to rescue relb/nfkb2-deleted B cells in vitro. RNA-sequencing analysis of BAFF-stimulated nfkb2-deleted versus normal B cells suggests that the alternative NF-κB pathway, in addition to its critical role in BAFF-mediated cell survival, may control the expression of genes involved in the positioning of B cells within the lymphoid microenvironment and in the establishment of T cell-B cell interactions. Thus, by ablating the downstream transcription factors of the alternative NF-κB pathway specifically in B cells, we identify in this study a critical role for the combined activity of the RELB and NF-κB2 subunits in B cell homeostasis that cannot be compensated for by the canonical NF-κB pathway under physiological conditions.


Figures

Figure 1
Figure 1. Generation of mice with conditional deletion of relb or nfkb2 in B-cells and simultaneous expression of eGFP
(A and D) Targeting strategy showing the status of relb and nfkb2 before (top) and after (bottom) Cre-mediated recombination. Numbers indicate the respective exons. (B and E) Western blot analysis of RELB and p52 protein levels in purified splenic B cells of the indicated genotypes, and (C) of flow-sorted eGFP+ B-cells from relbfl/flCD19-Cre mice and the corresponding eGFP+ relfl/+CD19-Cre and eGFP CD19-Cre control mice.
Figure 2
Figure 2. Reduced fractions of splenic B-cells in the absence of alternative NF-κB subunits
(A–C, top) The fractions of splenic B-cells from relbfl/flCD19-Cre, nfkb2fl/flCD19-Cre or relbfl/flnfkb2fl/flCD19-Cre mice and the corresponding heterozygous and CD19-Cre control mice were determined by flow cytometry (for absolute B-cell numbers, see Supplementary Fig. 2). Each symbol represents a mouse. Data are shown as mean ± standard deviation. Statistical significance was determined by one-way ANOVA (***, P<0.001). (A–C, bottom) Flow cytometry of eGFP expression in splenic B-cells of the indicated genotypes. The number above the gate indicates the percentage of eGFP+ B-cells among B220+ B cells of relbfl/flnfkb2fl/flCD19-Cre mice.
Figure 3
Figure 3. relbfl/flnfkb2fl/flCD19-Cre mice display fewer B-cell follicles within the white pulp, and exhibit more heterogeneity in the size of B-cell follicles, compared to control mice
Spleen sections from mice of the indicated genotypes were analyzed via immunohistochemistry for the expression of CD3 and IgM. One representative mouse out of 3 per group is shown. 40x magnification (left) and 100x magnification (right).
Figure 4
Figure 4. Relb/nfkb2-deleted B-cells show a developmental block at the T1 stage
IgM and CD23 expression of AA4.1+ splenic B cells from mice of the indicated genotypes were analyzed by flow cytometry. Numbers besides gates indicate the percentage of T1 (AA4.1+IgMhiCD23), T2 (AA4.1+IgMhiCD23+) and T3 (AA4.1+IgMlowCD23+) B-cells (left). Summary of the frequencies of T1–T3 B-cells (right). Each symbol represents a mouse. Data are shown as mean ± standard deviation. Statistical significance was determined by one-way ANOVA (**, P<0.01; ***, P<0.001).
Figure 5
Figure 5. Counter selection against relb/nfkb2-deleted follicular and MZ B-cells in relbfl/flnfkb2fl/flCD19-Cre mice
(A) CD21 and CD23 expression of splenic B cells from mice of the indicated genotypes were analyzed by flow cytometry. Numbers besides gates indicate the percentage of follicular (CD23+CD21int) and MZ (CD21hiCD23) B-cells (top). Summary of the frequencies of follicular and MZ B-cells (bottom). Each symbol represents a mouse. Data are shown as mean ± standard deviation. Statistical significance was determined by one-way ANOVA (*, P<0.05; **, P<0.01; ***, P<0.001). (B) The fractions of eGFP+ cells among splenic follicular (CD23+CD21int) and MZ (CD21hiCD23) B-cells in relbfl/flnfkb2fl/flCD19-Cre mice were determined by flow cytometry. Numbers above gates indicate the percentage of eGFP+ B-cells among the indicated B-cell subsets (top). Summary of the frequency of eGFP+ cells among the corresponding B-cell subsets (bottom). (C) Spleen sections from mice of the indicated genotypes were analyzed for the expression of eGFP and IgM by immunohistochemistry. FO, follicular area; MZ, marginal zone area. One representative mouse out of 3 per group is shown. 400x. Each symbol represents a mouse. Data are shown as mean ± standard deviation. Statistical significance was determined by Student’s t test (***, P<0.001).
Figure 6
Figure 6. Differential expression of BAFF-responsive genes controlled by the alternative NF-κB pathway
(A) Flow cytometric analysis of BAFF or CD40-stimulated B-cells from relbfl/flnfkb2fl/flCD19-Cre and CD19-Cre mice at d3 for the expression of ICOSL. Staining of eGFP+ and eGFP B-cells from relbfl/flnfkb2fl/flCD19-Cre mice and B-cells from CD19-Cre mice (top). Summary of the corresponding median fluorescence intensities (MFI) (bottom). eGFP+ and eGFP identifies relb/nfkb2-deleted and non-deleted B-cells from relbfl/flnfkb2fl/flCD19-Cre mice, respectively. Each symbol represents a mouse. Data are shown as mean ± standard deviation. Statistical significance was determined by one-way ANOVA (*, P<0.05; **, P<0.01; ***, P<0.001). (B) Flow cytometric analysis of BAFF or CD40-stimulated purified B-cells from relbfl/flnfkb2fl/flCD19-Cre and CD19-Cre mice at d3 for DNA content by propidium iodide (PI) staining (top) and summary of the corresponding percentage Sub-G1 (bottom). (B) Flow cytometric analysis of BAFF or CD40-stimulated purified B-cells from relbfl/flnfkb2fl/flCD19-Cre and CD19-Cre mice at d3 for apoptotic/dead cells by annexin V/7AAD staining (top) and summary of the corresponding percentage of annexin V/7AAD cells (bottom). (D) Flow cytometric analysis of ex vivo B-cells from relbfl/flnfkb2fl/flCD19-Cre and CD19-Cre mice for BAFFR expression (right) and summary of the corresponding MFIs (right). eGFP+ identifies relb/nfkb2-deleted B-cells from relbfl/flnfkb2fl/flCD19-Cre mice. (E) Flow cytometric analysis of ex vivo B-cells from relbfl/flnfkb2fl/flCD19-Cre and CD19-Cre mice for β2 expression (left) and summary of the corresponding MFIs (right). eGFP+ identifies relb/nfkb2-deleted B-cells from relbfl/flnfkb2fl/flCD19-Cre mice. (F) Flow cytometric analysis of ex vivo B-cells from relbfl/flnfkb2fl/flCD19-Cre and CD19-Cre mice for CD21 expression (left) and summary of the corresponding MFIs (right). eGFP+ identifies relb/nfkb2-deleted B-cells from relbfl/flnfkb2fl/flCD19-Cre mice. (B–F) Each symbol represents a mouse. Data are shown as mean ± standard deviation. Statistical significance was determined by Student’s t test (*, P<0.05; **, P<0.01; ***, P<0.001).

Similar articles

Cited by

References

    1. Lam KP, Kuhn R, Rajewsky K. In vivo ablation of surface immunoglobulin on mature B cells by inducible gene targeting results in rapid cell death. Cell. 1997;90:1073–1083. - PubMed
    1. Kraus M, Alimzhanov MB, Rajewsky N, Rajewsky K. Survival of resting mature B lymphocytes depends on BCR signaling via the Igalpha/beta heterodimer. Cell. 2004;117:787–800. - PubMed
    1. Mackay F, Schneider P. Cracking the BAFF code. Nat Rev Immunol. 2009;9:491–502. - PubMed
    1. Gross JA, Dillon SR, Mudri S, Johnston J, Littau A, Roque R, Rixon M, Schou O, Foley KP, Haugen H, McMillen S, Waggie K, Schreckhise RW, Shoemaker K, Vu T, Moore M, Grossman A, Clegg CH. TACI-Ig neutralizes molecules critical for B cell development and autoimmune disease. impaired B cell maturation in mice lacking BLyS. Immunity. 2001;15:289–302. - PubMed
    1. Schiemann B, Gommerman JL, Vora K, Cachero TG, Shulga-Morskaya S, Dobles M, Frew E, Scott ML. An essential role for BAFF in the normal development of B cells through a BCMA-independent pathway. Science. 2001;293:2111–2114. - PubMed

Publication types