

Design Principles Involving Protein Disorder Facilitate Specific Substrate Selection and Degradation by the Ubiquitin-Proteasome System
- PMID: 26851277
- PMCID: PMC4807260
- DOI: 10.1074/jbc.R115.692665
Design Principles Involving Protein Disorder Facilitate Specific Substrate Selection and Degradation by the Ubiquitin-Proteasome System
Abstract
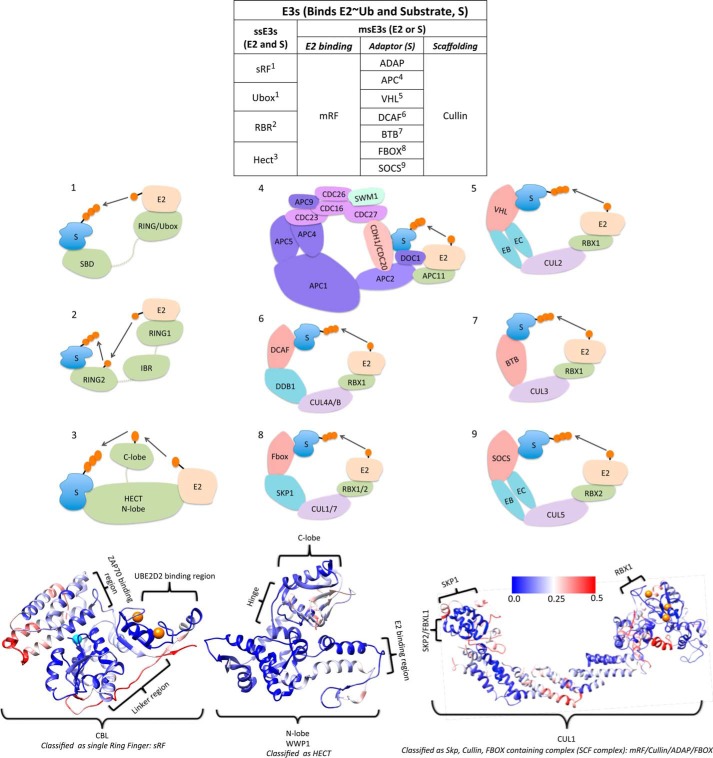
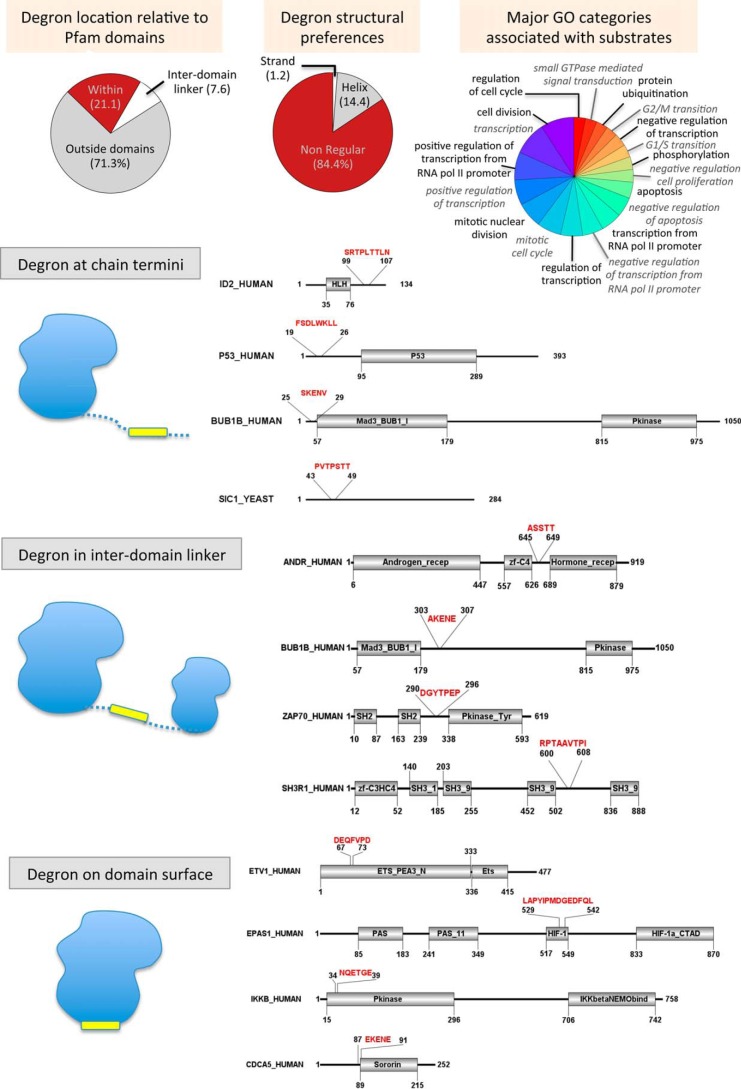
The ubiquitin-proteasome system (UPS) regulates diverse cellular pathways by the timely removal (or processing) of proteins. Here we review the role of structural disorder and conformational flexibility in the different aspects of degradation. First, we discuss post-translational modifications within disordered regions that regulate E3 ligase localization, conformation, and enzymatic activity, and also the role of flexible linkers in mediating ubiquitin transfer and reaction processivity. Next we review well studied substrates and discuss that substrate elements (degrons) recognized by E3 ligases are highly disordered: short linear motifs recognized by many E3s constitute an important class of degrons, and these are almost always present in disordered regions. Substrate lysines targeted for ubiquitination are also often located in neighboring regions of the E3 docking motifs and are therefore part of the disordered segment. Finally, biochemical experiments and predictions show that initiation of degradation at the 26S proteasome requires a partially unfolded region to facilitate substrate entry into the proteasomal core.
Keywords: E3 ligase; E3 ubiquitin ligase; intrinsically disordered protein; proteasome; protein degradation; protein phosphorylation; protein structural disorder; regulated degradation; ubiquitylation (ubiquitination).
© 2016 by The American Society for Biochemistry and Molecular Biology, Inc.
Figures
Similar articles
-
Cryo-EM Reveals Unanchored M1-Ubiquitin Chain Binding at hRpn11 of the 26S Proteasome.Structure. 2020 Nov 3;28(11):1206-1217.e4. doi: 10.1016/j.str.2020.07.011. Epub 2020 Aug 11. Structure. 2020. PMID: 32783951 Free PMC article.
-
Means of self-preservation: how an intrinsically disordered ubiquitin-protein ligase averts self-destruction.Mol Biol Cell. 2013 Apr;24(7):1041-52. doi: 10.1091/mbc.E12-11-0811. Epub 2013 Jan 30. Mol Biol Cell. 2013. PMID: 23363599 Free PMC article.
-
Unstructured Biology of Proteins from Ubiquitin-Proteasome System: Roles in Cancer and Neurodegenerative Diseases.Biomolecules. 2020 May 21;10(5):796. doi: 10.3390/biom10050796. Biomolecules. 2020. PMID: 32455657 Free PMC article.
-
Natural substrates of the proteasome and their recognition by the ubiquitin system.Curr Top Microbiol Immunol. 2002;268:137-74. doi: 10.1007/978-3-642-59414-4_6. Curr Top Microbiol Immunol. 2002. PMID: 12083004 Review.
-
Cullin-RING E3 Ubiquitin Ligases: Bridges to Destruction.Subcell Biochem. 2017;83:323-347. doi: 10.1007/978-3-319-46503-6_12. Subcell Biochem. 2017. PMID: 28271482 Free PMC article. Review.
Cited by
-
Identification of hub ubiquitin ligase genes affecting Alzheimer's disease by analyzing transcriptome data from multiple brain regions.Sci Prog. 2021 Jan-Mar;104(1):368504211001146. doi: 10.1177/00368504211001146. Sci Prog. 2021. PMID: 33754896 Free PMC article.
-
A conserved degron containing an amphipathic helix regulates the cholesterol-mediated turnover of human squalene monooxygenase, a rate-limiting enzyme in cholesterol synthesis.J Biol Chem. 2017 Dec 8;292(49):19959-19973. doi: 10.1074/jbc.M117.794230. Epub 2017 Sep 27. J Biol Chem. 2017. PMID: 28972164 Free PMC article.
-
Monoubiquitination in proteasomal degradation.Proc Natl Acad Sci U S A. 2016 Aug 9;113(32):8894-6. doi: 10.1073/pnas.1610186113. Epub 2016 Aug 1. Proc Natl Acad Sci U S A. 2016. PMID: 27482112 Free PMC article. No abstract available.
-
Numerous proteins with unique characteristics are degraded by the 26S proteasome following monoubiquitination.Proc Natl Acad Sci U S A. 2016 Aug 9;113(32):E4639-47. doi: 10.1073/pnas.1608644113. Epub 2016 Jul 6. Proc Natl Acad Sci U S A. 2016. PMID: 27385826 Free PMC article.
-
Biotin proximity tagging favours unfolded proteins and enables the study of intrinsically disordered regions.Commun Biol. 2020 Jan 22;3(1):38. doi: 10.1038/s42003-020-0758-y. Commun Biol. 2020. PMID: 31969649 Free PMC article.
References
-
- Ciechanover A. (2012) Intracellular protein degradation: from a vague idea thru the lysosome and the ubiquitin-proteasome system and onto human diseases and drug targeting. Biochim. Biophys. Acta 1824, 3–13 - PubMed
-
- Teixeira L. K., and Reed S. I. (2013) Ubiquitin ligases and cell cycle control. Annu. Rev. Biochem. 82, 387–414 - PubMed
-
- Craney A., and Rape M. (2013) Dynamic regulation of ubiquitin-dependent cell cycle control. Curr. Opin. Cell Biol. 25, 704–710 - PubMed
-
- Bhat K. P., and Greer S. F. (2011) Proteolytic and non-proteolytic roles of ubiquitin and the ubiquitin proteasome system in transcriptional regulation. Biochim. Biophys. Acta 1809, 150–155 - PubMed
Publication types
MeSH terms
Substances
Associated data
- Actions
- Actions
- Actions
- Actions
- Actions
- Actions
LinkOut - more resources
Full Text Sources
Other Literature Sources
