. 2016 Sep:150:34-43.
doi: 10.1016/j.exer.2016.01.014. Epub 2016 Feb 3.

Glial coverage in the optic nerve expands in proportion to optic axon loss in chronic mouse glaucoma

Affiliations

Glial coverage in the optic nerve expands in proportion to optic axon loss in chronic mouse glaucoma

Alejandra Bosco et al. Exp Eye Res. 2016 Sep.

Abstract

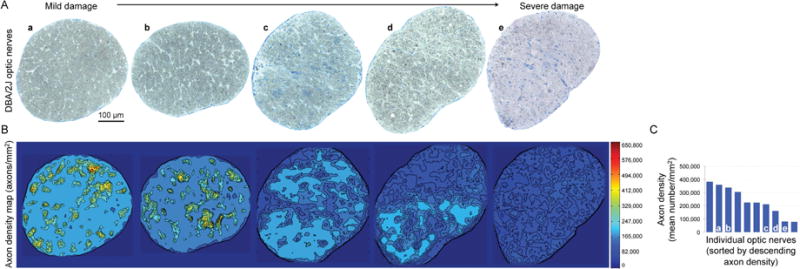
Within the white matter, axonal loss by neurodegeneration is coupled to glial cell changes in gene expression, structure and function commonly termed gliosis. Recently, we described the highly variable expansion of gliosis alebosco@neuro.utah.edu in degenerative optic nerves from the DBA/2J mouse model of chronic, age-related glaucoma. Here, to estimate and compare the levels of axonal loss with the expansion of glial coverage and axonal degeneration in DBA/2J nerves, we combined semiautomatic axon counts with threshold-based segmentation of total glial/scar areas and degenerative axonal profiles in plastic cross-sections. In nerves ranging from mild to severe degeneration, we found that the progression of axonal dropout is coupled to an increase of gliotic area. We detected a strong correlation between axon loss and the aggregate coverage by glial cells and scar, whereas axon loss did not correlate with the small fraction of degenerating profiles. Nerves with low to medium levels of axon loss displayed moderate glial reactivity, consisting of hypertrophic astrocytes, activated microglia and normal distribution of oligodendrocytes, with minimal reorganization of the tissue architecture. In contrast, nerves with extensive axonal loss showed prevalent rearrangement of the nerve, with loss of axon fascicle territories and enlarged or almost continuous gliotic and scar domains, containing reactive astrocytes, oligodendrocytes and activated microglia. These findings support the value of optic nerve gliotic expansion as a quantitative estimate of optic neuropathy that correlates with axon loss, applicable to grade the severity of optic nerve damage in mouse chronic glaucoma.

Keywords: Axon loss; Glaucoma; Gliosis; Microglia; Neurodegeneration; Optic nerve; Remodeling; Segmentation.


Figures

Figure 1
Figure 1
Decline in axon density is heterogeneous in distribution and levels in adult DBA/2J optic nerves. (A) Light microscopy images of DBA/2J optic nerve cross-sections presented as stitched multipoint images acquired at high-resolution. Individual nerves were selected to represent increasing severity of neuropathy at 7 (a), 12 (b–d) and 13 (e) months of age. (B) Corresponding spatial maps of axon density, numbers/mm2, color-coded scale shown at far right), illustrate the variability in distribution and levels of axonal numbers across the same optic nerves. (C) Bar graph representing the mean axon density per individual optic nerve cross-section, with individual nerves illustrated in A and B identified with a letter over their corresponding bar. Scale bars: 100 μm.
Figure 2
Figure 2
Image analysis steps used for semi-automatic segmentation and quantification of glial and dystrophic axon coverage in adult DBA/2J optic nerves. (A) Light microscopy image of the retro-orbital optic nerve, obtained by montage of multiple high-resolution images spanning a single semithin cross-section. (B) Segmented total nerve area excluding the lumen of major blood vessels and the meninges. (C) The thresholded degenerative axons included profiles with abnormally dark axoplasm and/or myelin sheets (red areas). (D) Dystrophic axons segmented into a quantifiable binary mask. (E) Dystrophic axons were identifiable by their high contrast due to PPD staining, and were amenable for quantification (red profiles), while intact axons were inconsistently detectable by segmentation and shown here only for illustration (black profiles). (F) (G) Thresholded glial cells and processes (green areas) were segmented for the entire nerve. (H) Overlay of all three segmented areas used for analysis of nerve degeneration. Scale bar: 100 μm.
Figure 3
Figure 3
Glial coverage expands in correlation to progressive axonal loss, while neither glial coverage nor axon loss correlate with axon dystrophy. (A) Binary masks of the total glial cell and/or scar area obtained by segmentation of the same nerves (a through e) analyzed in Fig. 1. The aggregate glial cell coverage increases with the severity of pathology in the selected nerves, noticeably within focal gliotic areas (nerves c and d), and as an extensive scar region (nerve e). (B) Bar graph representing the percent area covered by glia in individual nerve cross-sections, sorted by descending axonal density (as in Fig. 1C). (C) For the same nerves, the segmented dystrophic axons (red areas) are shown overlaid on the original nerve image shown in black and white, to improve observation. (D) Bar graph representing the percent area covered by degenerative axon profiles in the same nerve cross-sections, sorted by descending axonal density. Scatterplot graphs of the correlation analysis for (E) dystrophic axon coverage versus mean axon density, (F) relative glial area per nerve versus relative area of total dystrophic axons, and (G) relative glial area per nerve versus mean axon density. R2 values are provided in each graph and indicated with a solid line. Scale bars: 100 μm.
Figure 4
Figure 4
The relative coverage of glia and degenerative axons serves as an objective parameter to assess the severity of glaucomatous nerve damage in DBA/2J mice. (A) Plot of individual optic nerves from 10-month-old Gpnmb+/SjJ DBA/2J and DBA/2J mice, showing the relative coverage of glia/scar (black) and dystrophic axons (red), and sorted by ascending glial coverage. (B) Visual scoring damage in the same nerves, as mild (green), moderate (yellow) and severe (red). (C and D) Gallery of overlaid masks of segmented glia/scar (green) and degenerative axons (red) for representative Gpnmb+/SjJ DBA/2J nerves and DBA/2J nerves, with relative areas for glia/scar and dystrophic axons indicated for each (top and bottom percent, respectively). Scale bar: 50 μm.
Figure 5
Figure 5
Remodeling and reactivity of optic nerve astrocytes, microglia and oligodendrocytes associated with the expansion of glial cell and/or scar coverage. Confocal images of astrocytes, microglia and oligodendrocytes in two nerves representative of mild (AD) and severe degeneration (EH) (see Figs. 1B and 3A). Images are 10 μm-maximal intensity projections of cryosections double-immunostained for GFAP and Iba1 (A and E) or Olig2 (B and F). High-magnification views of nerve sectors framed in A, B, E and F. (C and G) Single-channel views of GFAP, Iba1 and Olig2 immunostainings, shown in black and white, to illustrate coverage. (D and H) Corresponding pseudocolor view to detect variations in signal levels (intensity scale shown far right in H). Scale bar: 100 μm (A–H) and 25 μm (insets).

Similar articles

Cited by

References

    1. Anderson MG, Libby RT, Gould DB, Smith RS, John SW. High-dose radiation with bone marrow transfer prevents neurodegeneration in an inherited glaucoma. Proceedings of the National Academy of Sciences of the United States of America. 2005;102:4566–4571. - PMC - PubMed
    1. Bosco A, Romero CO, Breen KT, Chagovetz AA, Steele MR, Ambati BK, Vetter ML. Neurodegeneration severity can be predicted from early microglia alterations monitored in vivo in a mouse model of chronic glaucoma. Dis Model Mech. 2015;8:443–455. - PMC - PubMed
    1. Bosco A, Steele MR, Vetter ML. Early microglia activation in a mouse model of chronic glaucoma. The Journal of comparative neurology. 2011;519:599–620. - PMC - PubMed
    1. Buckingham BP, Inman DM, Lambert W, Oglesby E, Calkins DJ, Steele MR, Vetter ML, Marsh-Armstrong N, Horner PJ. Progressive ganglion cell degeneration precedes neuronal loss in a mouse model of glaucoma. The Journal of neuroscience: the official journal of the Society for Neuroscience. 2008;28:2735–2744. - PMC - PubMed
    1. Buffo A, Vosko MR, Erturk D, Hamann GF, Jucker M, Rowitch D, Gotz M. Expression pattern of the transcription factor Olig2 in response to brain injuries: implications for neuronal repair. Proceedings of the National Academy of Sciences of the United States of America. 2005;102:18183–18188. - PMC - PubMed

Publication types