Review
. 2016 Jun 15:80:273-287.
doi: 10.1016/j.bios.2016.01.065. Epub 2016 Jan 28.

Nano-biosensors to detect beta-amyloid for Alzheimer's disease management

Affiliations
Review

Nano-biosensors to detect beta-amyloid for Alzheimer's disease management

Ajeet Kaushik et al. Biosens Bioelectron. .

Abstract

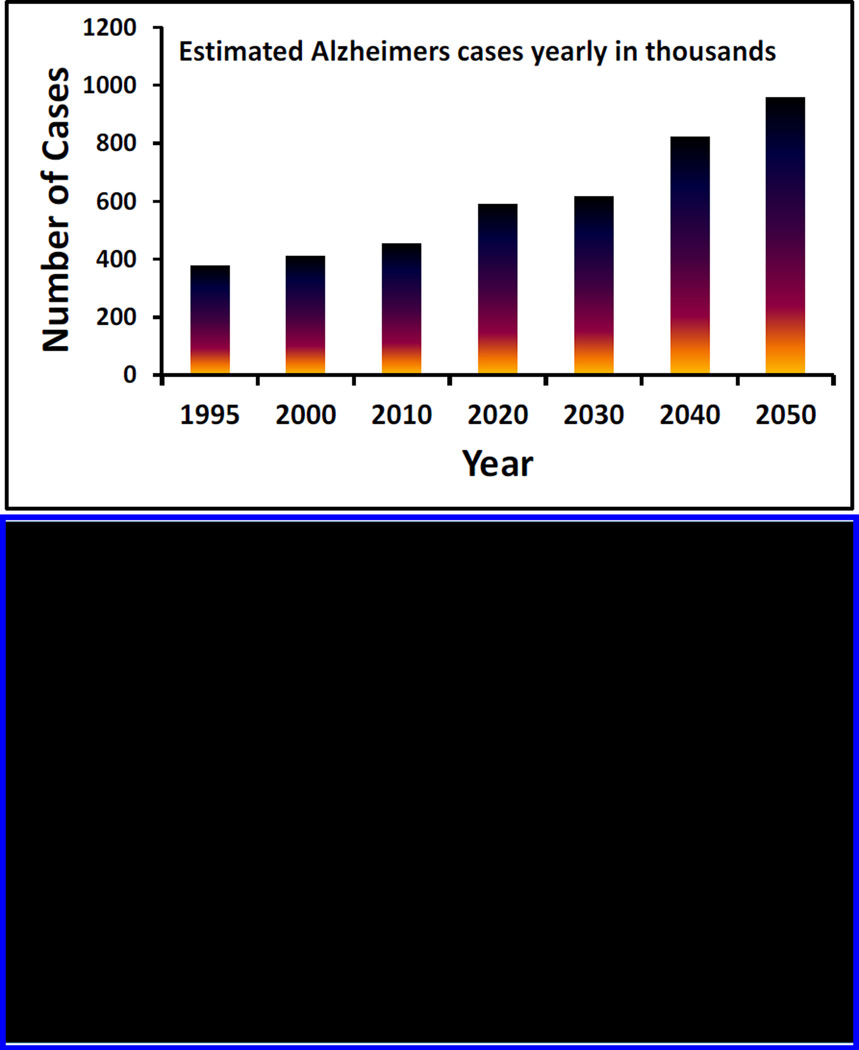
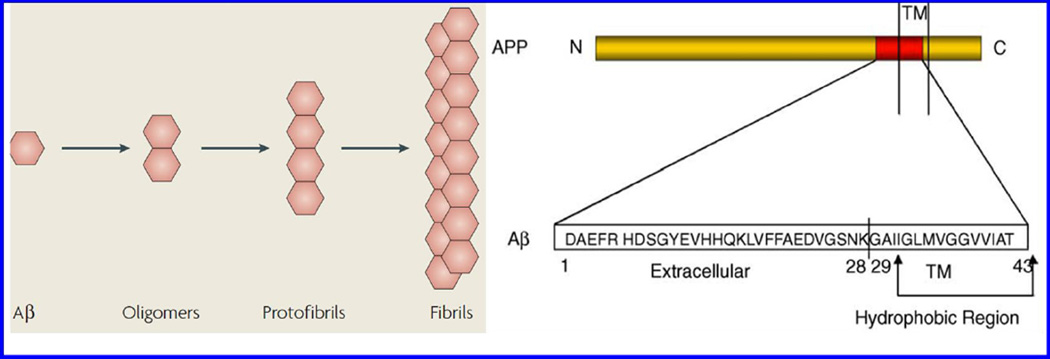
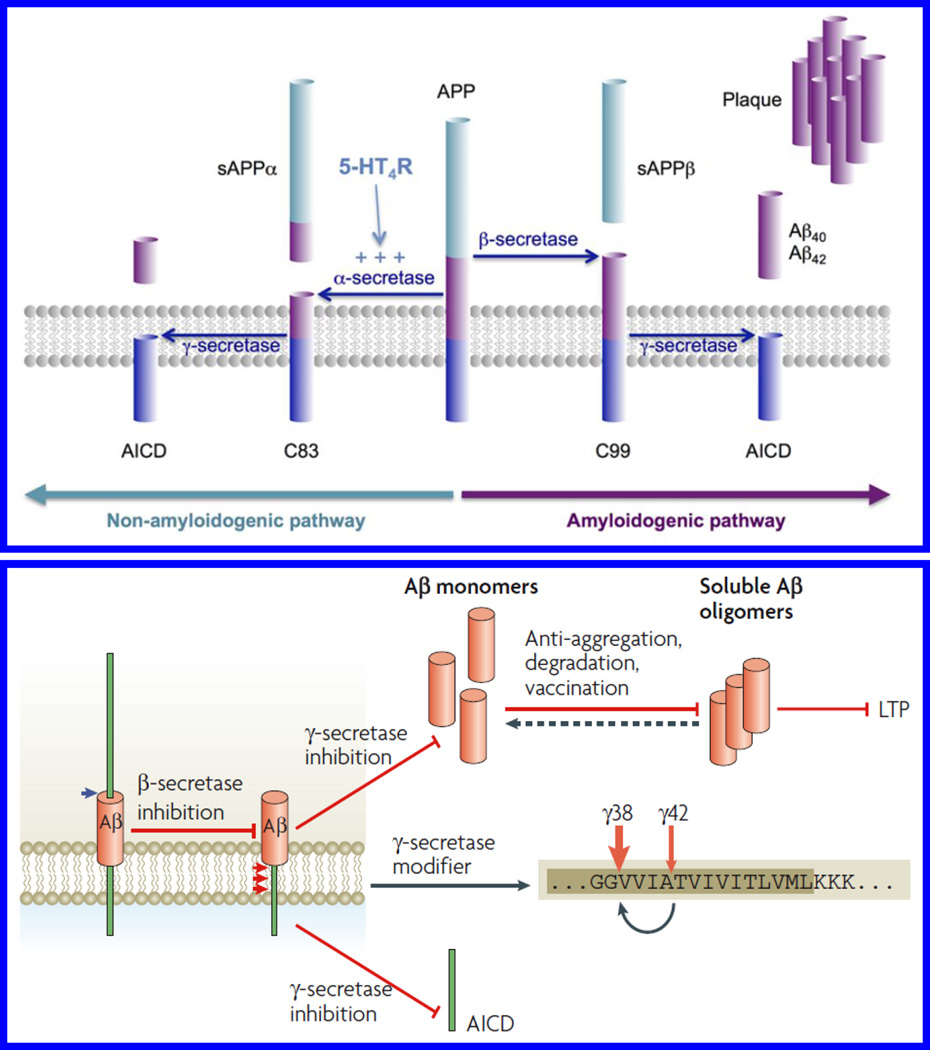
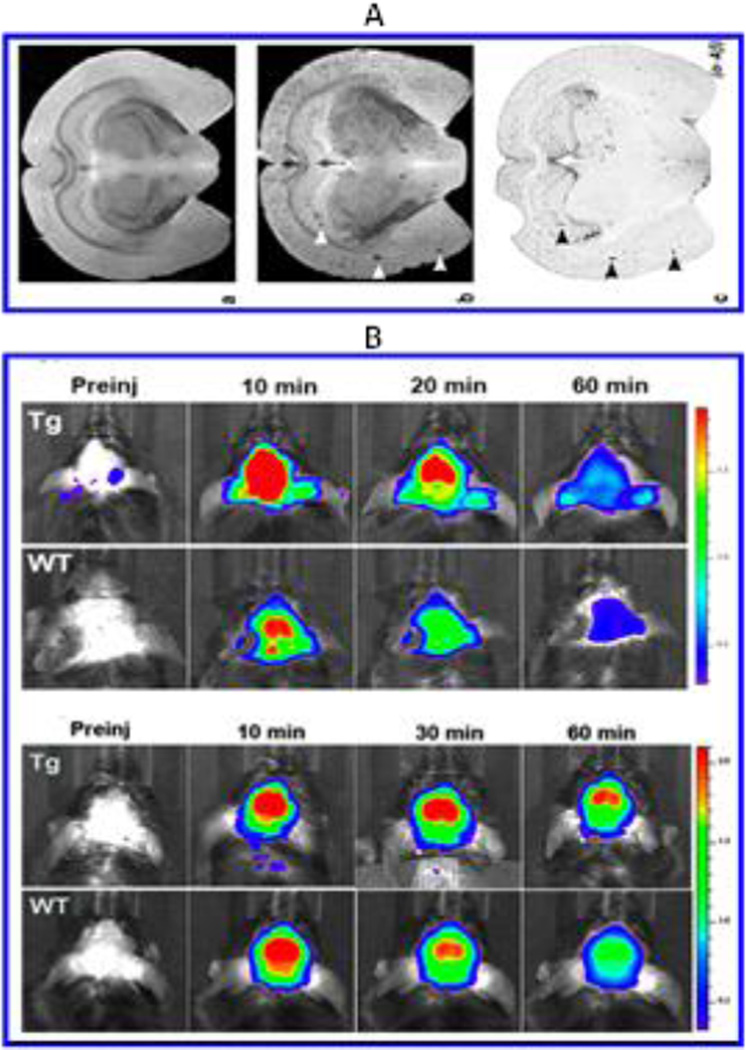
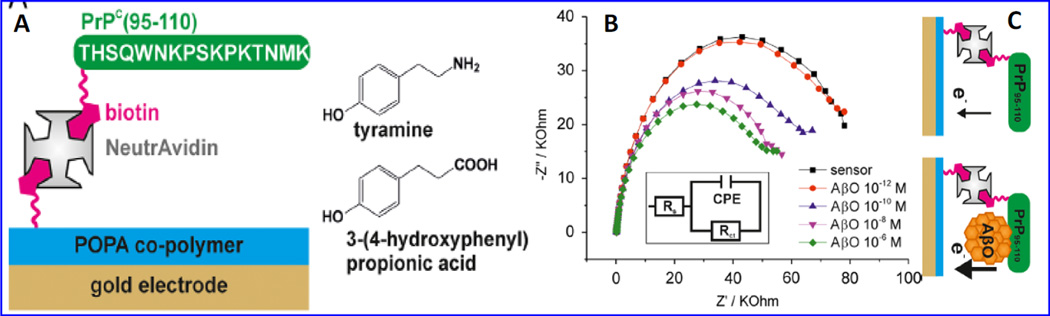
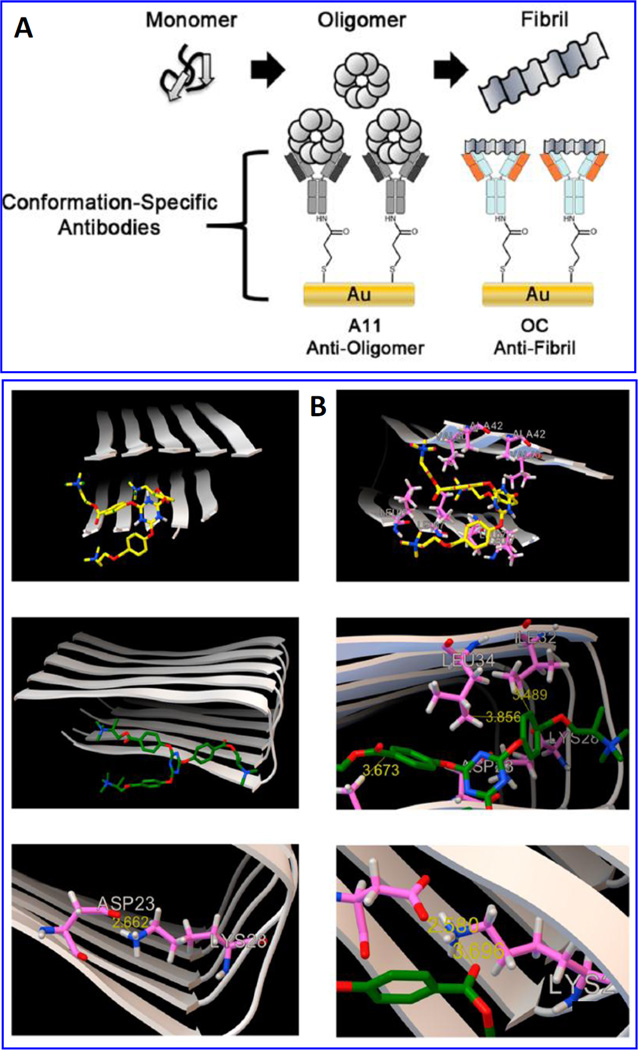
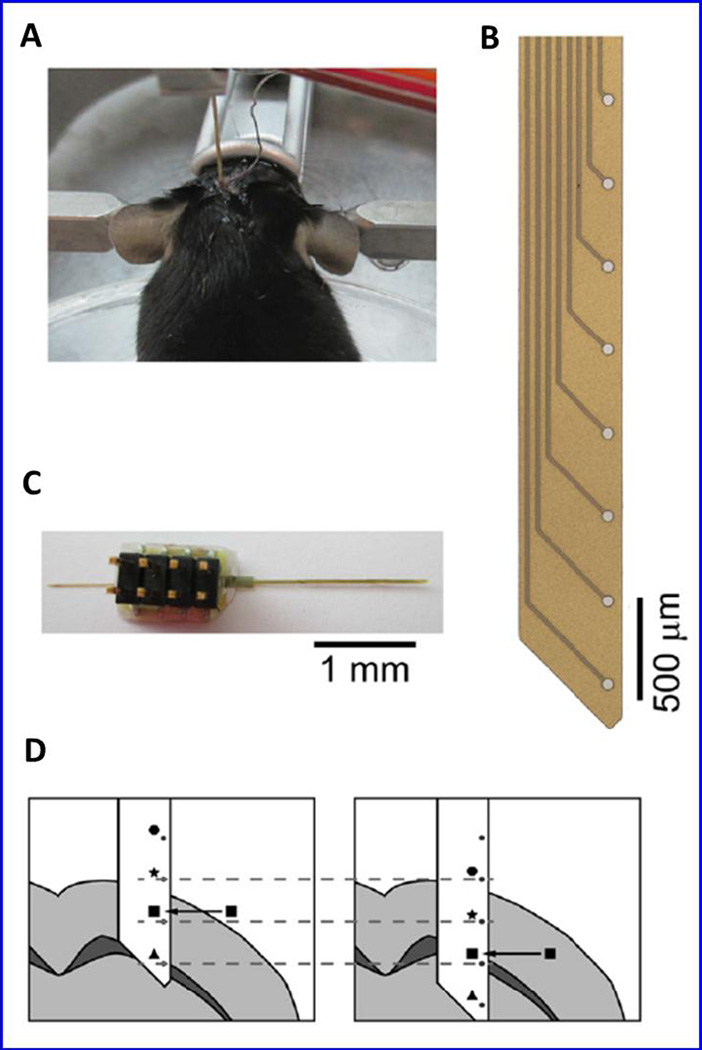
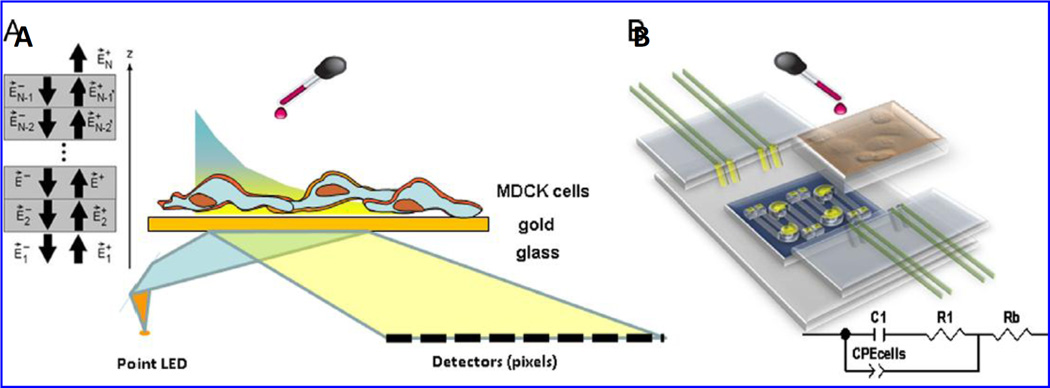
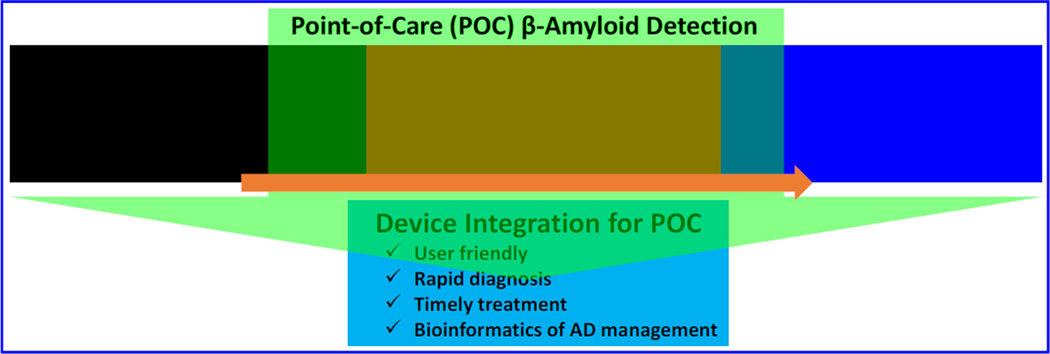
Beta-amyloid (β-A) peptides are potential biomarkers to monitor Alzheimer's diseases (AD) for diagnostic purposes. Increased β-A level is neurotoxic and induces oxidative stress in brain resulting in neurodegeneration and causes dementia. As of now, no sensitive and inexpensive method is available for β-A detection under physiological and pathological conditions. Although, available methods such as neuroimaging, enzyme-linked immunosorbent assay (ELISA), and polymerase chain reaction (PCR) detect β-A, but they are not yet extended at point-of-care (POC) due to sophisticated equipments, need of high expertize, complicated operations, and challenge of low detection limit. Recently, β-A antibody based electrochemical immuno-sensing approach has been explored to detect β-A at pM levels within 30-40 min compared to 6-8h of ELISA test. The introduction of nano-enabling electrochemical sensing technology could enable rapid detection of β-A at POC and may facilitate fast personalized health care delivery. This review explores recent advancements in nano-enabling electrochemical β-A sensing technologies towards POC application to AD management. These analytical tools can serve as an analytical tool for AD management program to obtain bio-informatics needed to optimize therapeutics for neurodegenerative diseases diagnosis management.

Keywords: Alzheimer's diseases; Beta-amyloid; Diseases management; Electrochemical sensor; Point-of-care sensing.


Figures

Figure 1
Figure 1
Illustration of early estimated AD cases along with the approach and need of AD management
Figure 2
Figure 2
Various forms of β-A form associated with AD progression.
Figure 3
Figure 3
Therapeutic approaches targeting β-A protein production and oligomerization.
Figure 4
Figure 4
A) EX-vivo MRI for the detection of β-A after injection of Gd-DTPA-A_1–40 in (a) 6-month-old control, and (b) APP/PS1 -transgenic mouse brains (Figure reprinted Ref Yousef Zaime Wadghiri, copyright Wiley InterScience-2013) (Wadghiri et al. 2003). These results were validated using immunohistochemistry (c). B) In-vivo MRI imaged of 2 NIR responsive probes infected in mice to monitor β-A aggregation in mice as a function of time and imaging agents (Figure reprinted ref Hualong Fu, Copyright ACS-2015) (Fu et al. 2015).
Figure 5
Figure 5
A) Chemical structure and synthesis of CRANAD-3 utilized as NIR responsive imaging agent. B) Therapeutic effects of CRANAD-3 for AD monitoring, a) Neuroimaging of APP/PS1 mice with CRANAD-3 before and after treatment with the BACE-1 inhibitor LY2811376 using in-vivo model with quantitative analysis (b), c) NIRF images of 4-month APP/PS1 mice after 6 month of treatment with CRANAD-17 and their quantitative analysis (d), e) validation of results using ELISA analysis, f) plaque counting, and g) histological staining with thioflavin S. (Figure Reprinted Ref. Xueli Zhang-2015, Copyright PNAAS or Science)(Zhang et al. 2015).
Figure 6
Figure 6
Presentation of AF647-nanovehicles uptake in brain arteriole of wild type mouse (A) and APP transgenic mouse (B). MRI study of Gd-DTPA-nanovehicles in wild type (WT) mice (C & D), and Gd-DTPAnanovehicles in APP transgenic mice (E & F). Figure reprinted ref. Jaruszewski, copyright Elsvier-2014)(Jaruszewski et al. 2014)
Figure 7
Figure 7
Illustration of fluorescence imaging at 90% laser power and PMT of Aβ42 detection (0 to 100 ng/mL) using SC-D17 (top arrays) or Cov-12F4 (bottom arrays). (Figure reprinted ref Paola Gagni, copyright Elsvier-2013) (Gagni et al. 2013). Schematic illustration for the fabrication of optical DNA barcode microarrays for the detection of ADDL. An optically active microarray modifies with oligonucleotides captured DNA barcode sequence. NPs modified microarrays to enhance the signal and with oligonucleotides these arrays capture barcode DNA those hybridized to the captured barcode strands. The obtained signal was enhanced using Ag nanoparticles. The signal NPs modified sensing microarray was measured as a function of ADDL level as shown in inset. [Figure reprinted Ref. Georganopoulou, Copyright Science-2015)(Georganopoulou et al. 2005)
Figure 8
Figure 8
Illustration of a protocol showing a pathway to develop core-shell nanoparticle/hybrid graphene oxide based multi-functional platform label-free SERS detection of β-A to monitor AD. [Figure reprinted Ref. Teresa Demeritt-2015, Copyright ACS-2015)
Figure 9
Figure 9
Representation of SPRi experimental process flow for the detection of β-A fibril elongation using a SPR active Au arrays SPRi. The capturing of β-A elongation on various Au microarrays in shown in inset. (Figure reprinted Ref Xin R. Cheng, Copyright ACS-2013)(Cheng et al. 2013)
Figure 10
Figure 10
Demonstration of ADP3 peptoid modified Au array based SPRi for detecting antibodies against β-A 42 in human serum. On serum injection in a flow cell the β-A was captured by ADP3 led to change in refractive index of array. This signal change was detected using a CCD camera. (Figure reprinted Ref. Zijian Zhao-2015, copyright RSC-2015)(Zhao et al. 2015)
Figure 11
Figure 11
Illustration of waveguide-coupled bimetallic (WcBiM)-SPR. (Figure reprinted Ref. Yaon Kyung Lee-2014, Copyright PLoS One-2014) (Lee et al. 2014)
Figure 12
Figure 12
Chemical structure of curcumin (A) and Fc-KLVFFAE (B) (Figure reprinted Ref. Veloso, copyright Elsevier-2012) (Veloso and Kerman 2012)
Figure 13
Figure 13
A) Fabrication of gelsolin-bound electrochemical β-A biosensor, B) a linear calibration curve plotted as DPV response and β-A1–40/1–42 concentrations (0.1, 0.2, 0.4, 2, 4, 10, 20, 50 nM). The developed HRP-Au-gelsolin and HRP-gelsolin was used a as an electroactive, and C) presentation of β-A variation in CSF. (Figure reprinted Ref Yan Yan Yu-2015, copyright Elsevier-2015) (Yu et al. 2015)
Figure 14
Figure 14
Illustration of electrochemical biosensor based on β-A1–16-heme-AuNPs to detect β-A based on specific mAb. B) A calibration curve plotted between electrochemical response and β-A concentrations (0.02–5.00 nM). A linear calibration curve was obtained using 0.02, 0.10, 0.20, 0.50, 0.80, 1.20 and 1.50 nM β-A level. (Figure reprinted Ref Lin Liu-2013, copyright Elsevier-2013) (Liu et al. 2013).
Figure 15
Figure 15
A) APP sequence containing β-A segment and illustration of electrochemical sensor to probe BACE1 activity and screening. (Figure reprinted Ref. Ning Xia, Copyright Elsevier-2015) (Xia et al. 2015).
Figure 16
Figure 16
β-A native sequence isolated from and demonstration of β-A1–42, and total β-A detection. (Figure reprinted Ref. Liu, BIOS 2014, Copyright Elsevier-2014) (Liu et al. 2014)
Figure 17
Figure 17
Illustration of CNT-MESFET device fabrication. (Figure reprinted Ref Oh-2013, copyright Elsevier-2013) (Oh et al. 2013)
Figure 18
Figure 18
An LBL based EIS sensor fabricated onto Au coated POPA (polytyramine/poly 3-(4-hydroxyphenyl propionic acid)) using electro-polymerization. The sensing surface was modified by tyramine moieties using NHS-biotin chemistry. This surface was further modified with NeutrAvidin to bind with biotinylated PrPC (95–110). This EIS Biosensor detected β-A oligomers (pM to µM total Aβ peptide concentration) using incubation time of 20 min and PBS electrolyte containing 10 mM Fe (II)/Fe(III) redox probe. (Figure reprinted Ref. Rushworth, Copyright Elsevier-2014) (Rushworth et al. 2014)
Figure 19
Figure 19
Illustration of a detection principle to monitoring β-A1–42 fibrils and toxic oligomers based on conformational specific antibodies loading using EIS, B) Demonstration of molecular modeling simulations to confirm the binding affinities of TAE-1 (a, b) and TAE-2 (c, d) to Aβ1–42 fibrils (2BEG)57 using Autodock Vina run at an exhaustiveness of 400. Results confirmed that TAE-1 and TAE-2 showed maximum binding affinity (evaluated based on estimating binding energy (ΔGb, kcal/mol). (Figure reprinted Ref. Veloso, Copyright ACS-2014) (Veloso et al. 2014)
Figure 20
Figure 20
An illustration of a post mortem stereotaxically implanted mouse (a), detection probe (b), polyimide probe to measure an array of eight 50 µm diameter platinum electrodes, and representation of the probe insertion into the brain and impedance spectra were recorded at every 100 µm step. (Figure reprinted Ref. Beduer, Copyright IOP-2015) (Beduer et al. 2015)
Figure 21
Figure 21
(A) Illustration of an experimental set-up containing SPR and EIS to detect β-A in living cells. (Figure reprinted Ref. Gheorghiu, Copyright Elsevier-2014) (Gheorghiu et al. 2014).
Figure 22
Figure 22
A vision for β-A detection at POC of AD monitoring and diseases management.

Similar articles

Cited by

References

    1. Adle-Biassette H, Levy Y, Colornbel M, Poron F, Natchev S, Keohane C, Gray F. Neuropathol. Appl. Neurobiol. 1995;21(3):218–227. - PubMed
    1. András IE, Toborek M. IUBMB life. 2013;65(1):43–49. - PMC - PubMed
    1. Beduer A, Joris P, Mosser S, Fraering PC, Renaud P. J. Neural. Eng. 2015;12(2):024001. - PubMed
    1. Bogomolova A, Komarova E, Reber K, Gerasimov T, Yavuz O, Bhatt S, Aldissi M. Anal. Chem. 2009;81(10):3944–3949. - PubMed
    1. Butterfield DA, Drake J, Pocernich C, Castegna A. Trend Mol. Med. 2001;7(12):548–554. - PubMed

Publication types

MeSH terms