

Quantification of pain in sickle mice using facial expressions and body measurements
- PMID: 26852657
- PMCID: PMC4746724
- DOI: 10.1016/j.bcmd.2015.12.006
Quantification of pain in sickle mice using facial expressions and body measurements
Abstract
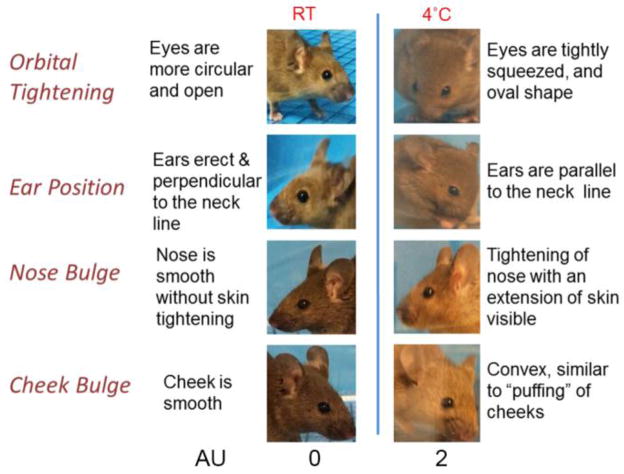
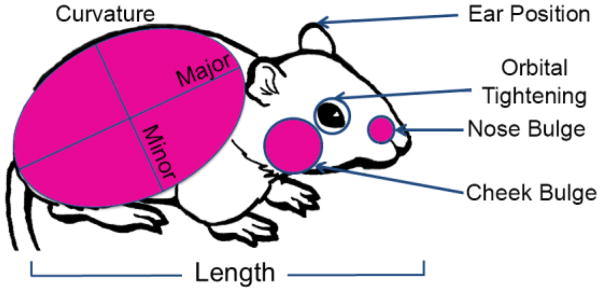
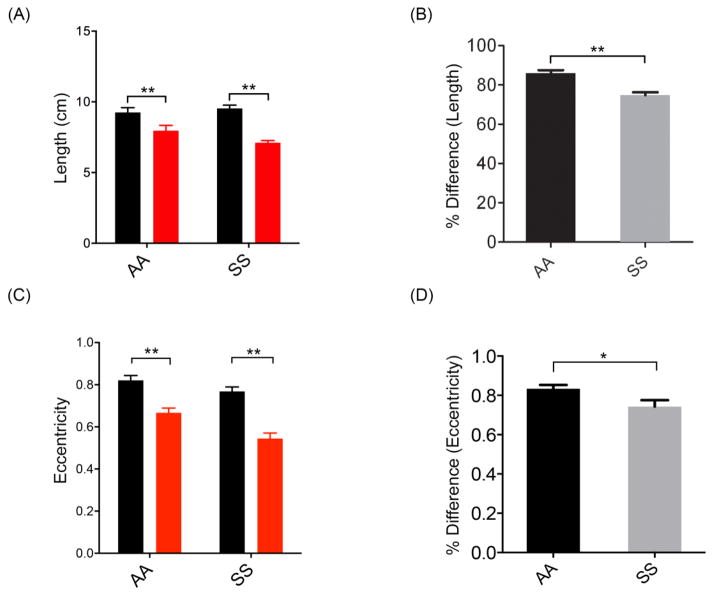
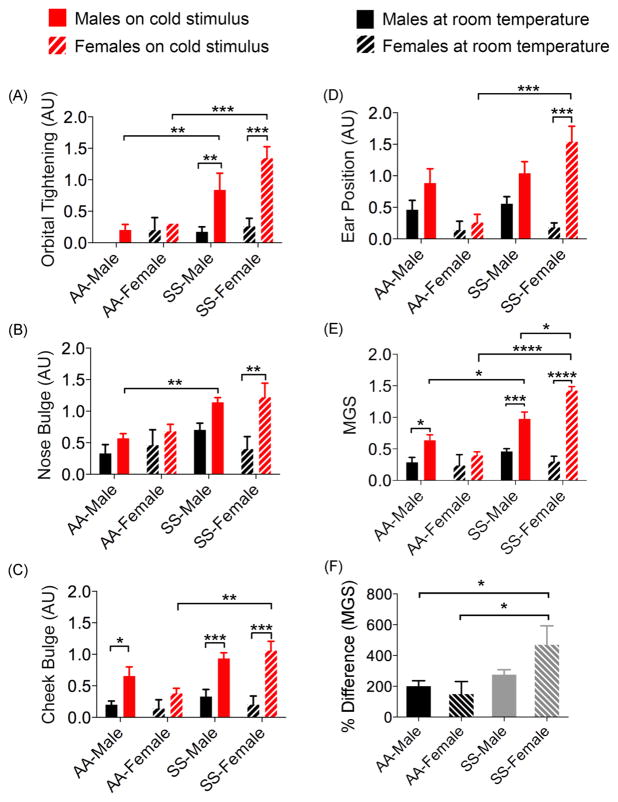
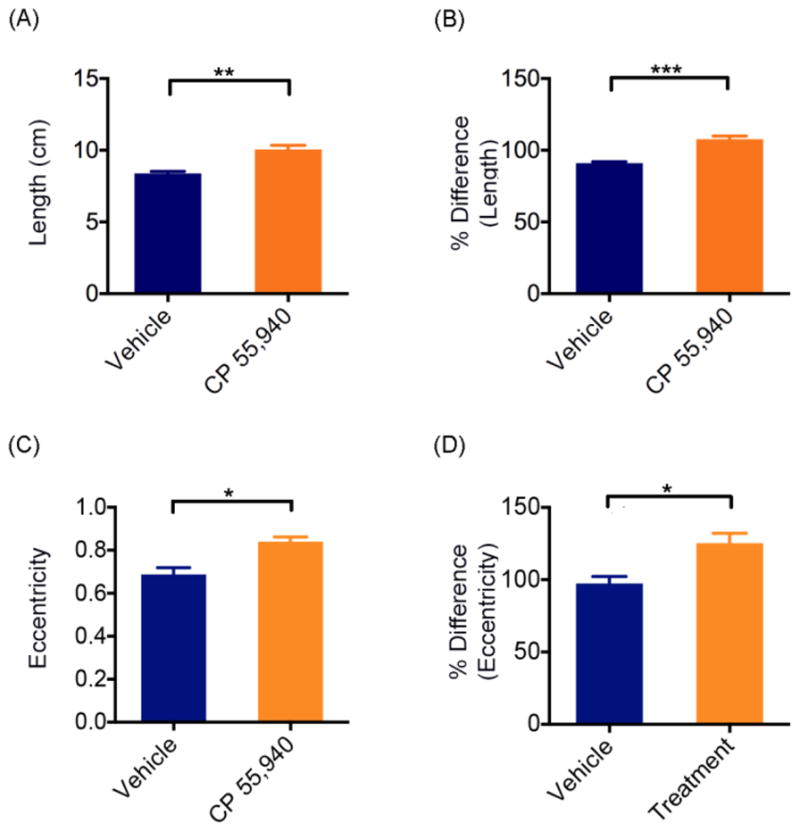
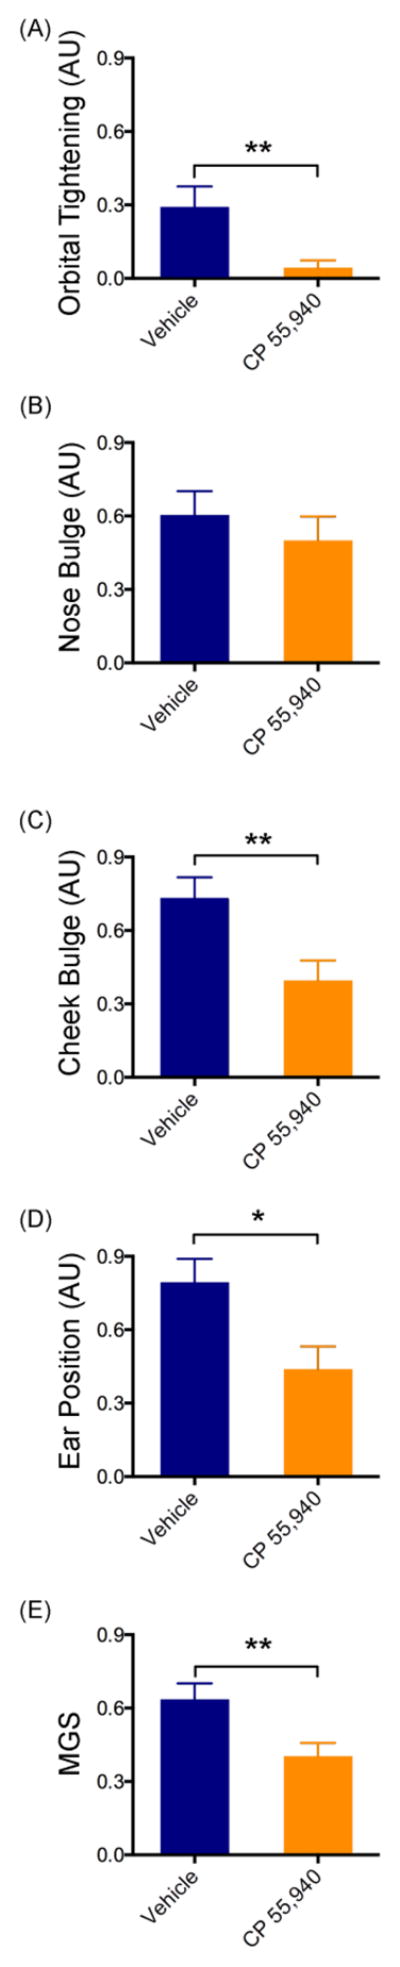
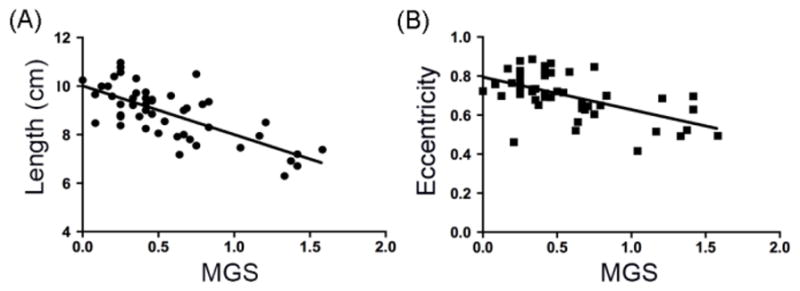
Pain is a hallmark feature of sickle cell disease (SCD). Subjects typically quantify pain by themselves, which can be biased by other factors leading to overtreatment or under-treatment. Reliable and accurate quantification of pain, in real time, might enable to provide appropriate levels of analgesic treatment. The mouse grimace scale (MGS), a standardized behavioral coding system with high accuracy and reliability has been used to quantify varied types of pain. We hypothesized that addition of the objective parameters of body length and back curvature will strengthen the reproducibility of MGS. We examined MGS scores and body length and back curvature of transgenic BERK sickle and control mice following cold treatment or following treatment with analgesic cannabinoid CP55,940. We observed that sickle mice demonstrated decreased length and increased back curvature in response to cold. These observations correlate with changes in facial expression for the MGS score. CP55,940 treatment of sickle mice showed an increase in body length and a decrease in back curvature concordant with MGS scores indicative of an analgesic effect. Thus, body parameters combined with facial expressions may provide a quantifiable unbiased method for objective measure of pain in SCD.
Keywords: Cannabinoid; Hyperalgesia; Mouse grimace scale; Pain; Sickle cell disease.
Copyright © 2015 Elsevier Inc. All rights reserved.
Conflict of interest statement
The authors declare no conflict of interest.
Figures
Similar articles
-
Mouse models for studying pain in sickle disease: effects of strain, age, and acuteness.Br J Haematol. 2012 Feb;156(4):535-44. doi: 10.1111/j.1365-2141.2011.08977.x. Epub 2011 Dec 15. Br J Haematol. 2012. PMID: 22171826 Free PMC article.
-
Pain-related behaviors and neurochemical alterations in mice expressing sickle hemoglobin: modulation by cannabinoids.Blood. 2010 Jul 22;116(3):456-65. doi: 10.1182/blood-2010-01-260372. Epub 2010 Mar 19. Blood. 2010. PMID: 20304807 Free PMC article.
-
Dexmedetomidine ameliorates nocifensive behavior in humanized sickle cell mice.Eur J Pharmacol. 2015 May 5;754:125-33. doi: 10.1016/j.ejphar.2015.02.027. Epub 2015 Feb 25. Eur J Pharmacol. 2015. PMID: 25724786 Free PMC article.
-
Thinking beyond sickling to better understand pain in sickle cell disease.Eur J Haematol. 2014 Aug;93(2):89-95. doi: 10.1111/ejh.12340. Epub 2014 May 16. Eur J Haematol. 2014. PMID: 24735098 Review.
-
The grimace scale: a useful tool for assessing pain in laboratory animals.Exp Anim. 2024 Jul 9;73(3):234-245. doi: 10.1538/expanim.24-0010. Epub 2024 Feb 22. Exp Anim. 2024. PMID: 38382945 Free PMC article. Review.
Cited by
-
A Review of Pain Assessment Methods in Laboratory Rodents.Comp Med. 2019 Dec 1;69(6):451-467. doi: 10.30802/AALAS-CM-19-000042. Epub 2019 Dec 20. Comp Med. 2019. PMID: 31896391 Free PMC article. Review.
-
Methods Used and Application of the Mouse Grimace Scale in Biomedical Research 10 Years on: A Scoping Review.Animals (Basel). 2021 Mar 3;11(3):673. doi: 10.3390/ani11030673. Animals (Basel). 2021. PMID: 33802463 Free PMC article.
-
An insular view of the social decision-making network.Neurosci Biobehav Rev. 2019 Aug;103:119-132. doi: 10.1016/j.neubiorev.2019.06.005. Epub 2019 Jun 10. Neurosci Biobehav Rev. 2019. PMID: 31194999 Free PMC article. Review.
-
Spatiotemporal Alterations in Gait in Humanized Transgenic Sickle Mice.Front Immunol. 2020 Oct 15;11:561947. doi: 10.3389/fimmu.2020.561947. eCollection 2020. Front Immunol. 2020. PMID: 33178189 Free PMC article.
-
Effect of chronic opioid therapy on pain and survival in a humanized mouse model of sickle cell disease.Blood Adv. 2019 Mar 26;3(6):869-873. doi: 10.1182/bloodadvances.2018024299. Blood Adv. 2019. PMID: 30885998 Free PMC article.
References
-
- Rees DC, Williams TN, Gladwin MT. Sickle-cell disease. Lancet. 2010;376:2018–2031. - PubMed
-
- Ballas SK, Gupta K, Adams-Graves P. Sickle cell pain: a critical reappraisal. Blood. 2012;120:3647–3656. - PubMed
-
- Hebbel RP. Ischemia-reperfusion Injury in Sickle Cell Anemia Relationship to Acute Chest Syndrome, Endothelial Dysfunction, Arterial Vasculopathy, and Inflammatory Pain. Hematol Oncol Clin North Am. 2014;28:181. - PubMed
-
- Hebbel RP, Osarogiagbon R, Kaul D. The endothelial biology of sickle cell disease: Inflammation and a chronic vasculopathy. Microcirculation. 2004;11:129–151. - PubMed
Publication types
MeSH terms
Substances
Grants and funding
LinkOut - more resources
Full Text Sources
Other Literature Sources
Medical
