

Light adaptation does not prevent early retinal abnormalities in diabetic rats
- PMID: 26852722
- PMCID: PMC4745072
- DOI: 10.1038/srep21075
Light adaptation does not prevent early retinal abnormalities in diabetic rats
Abstract
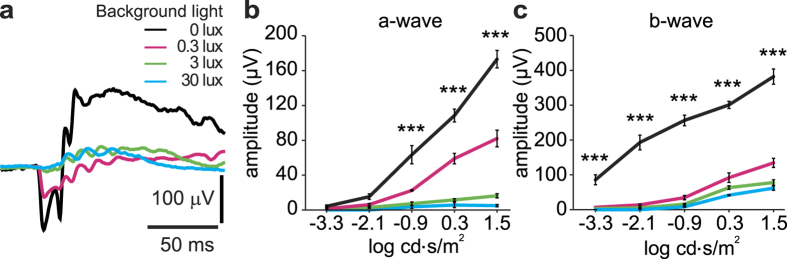
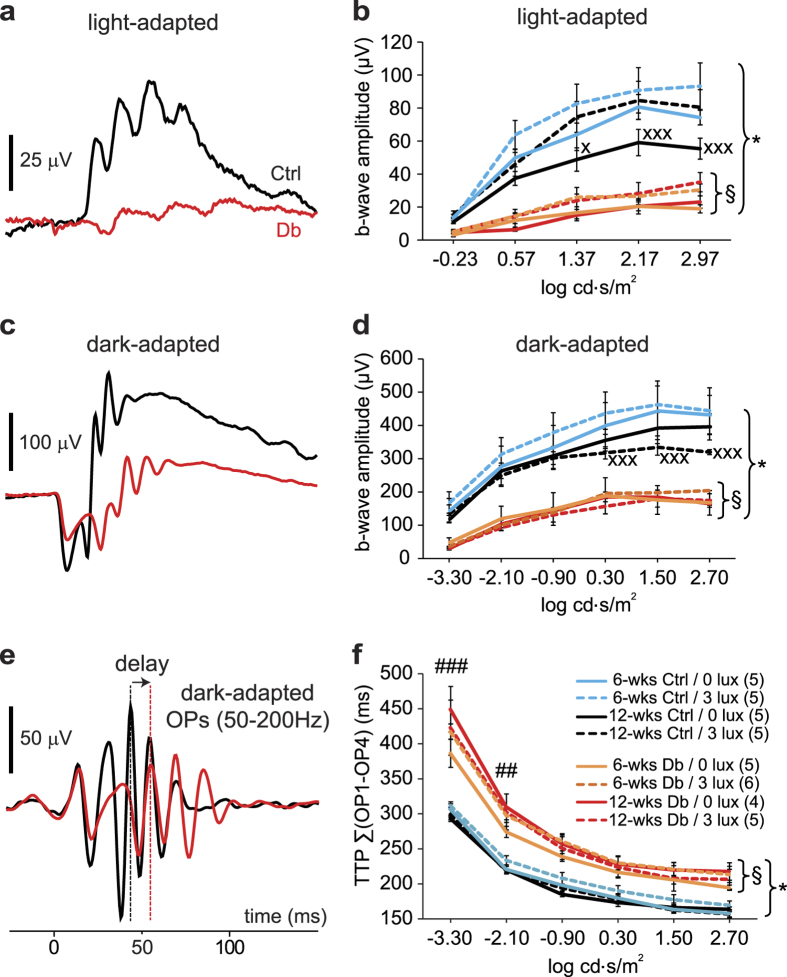
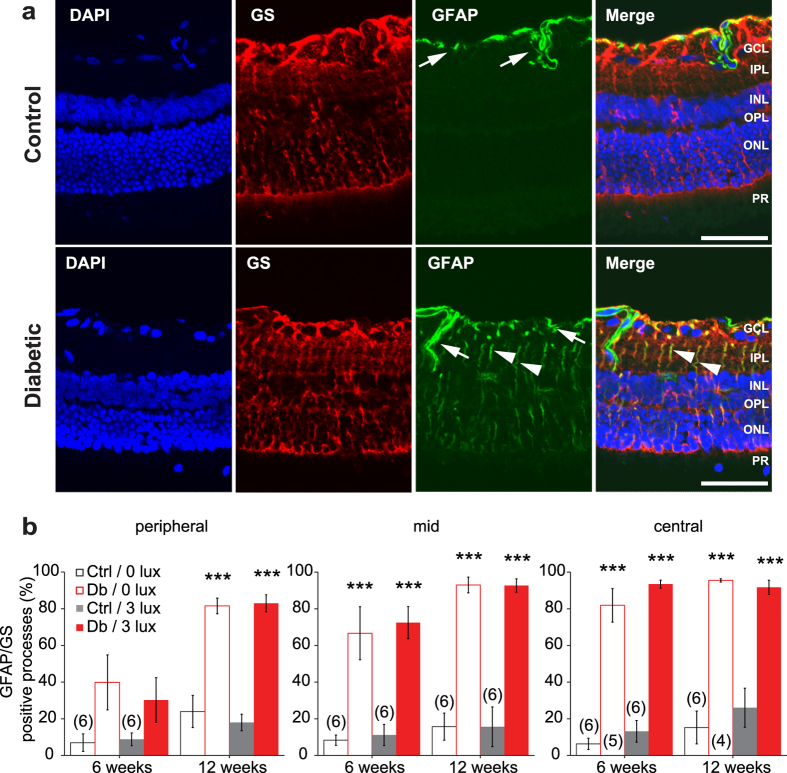
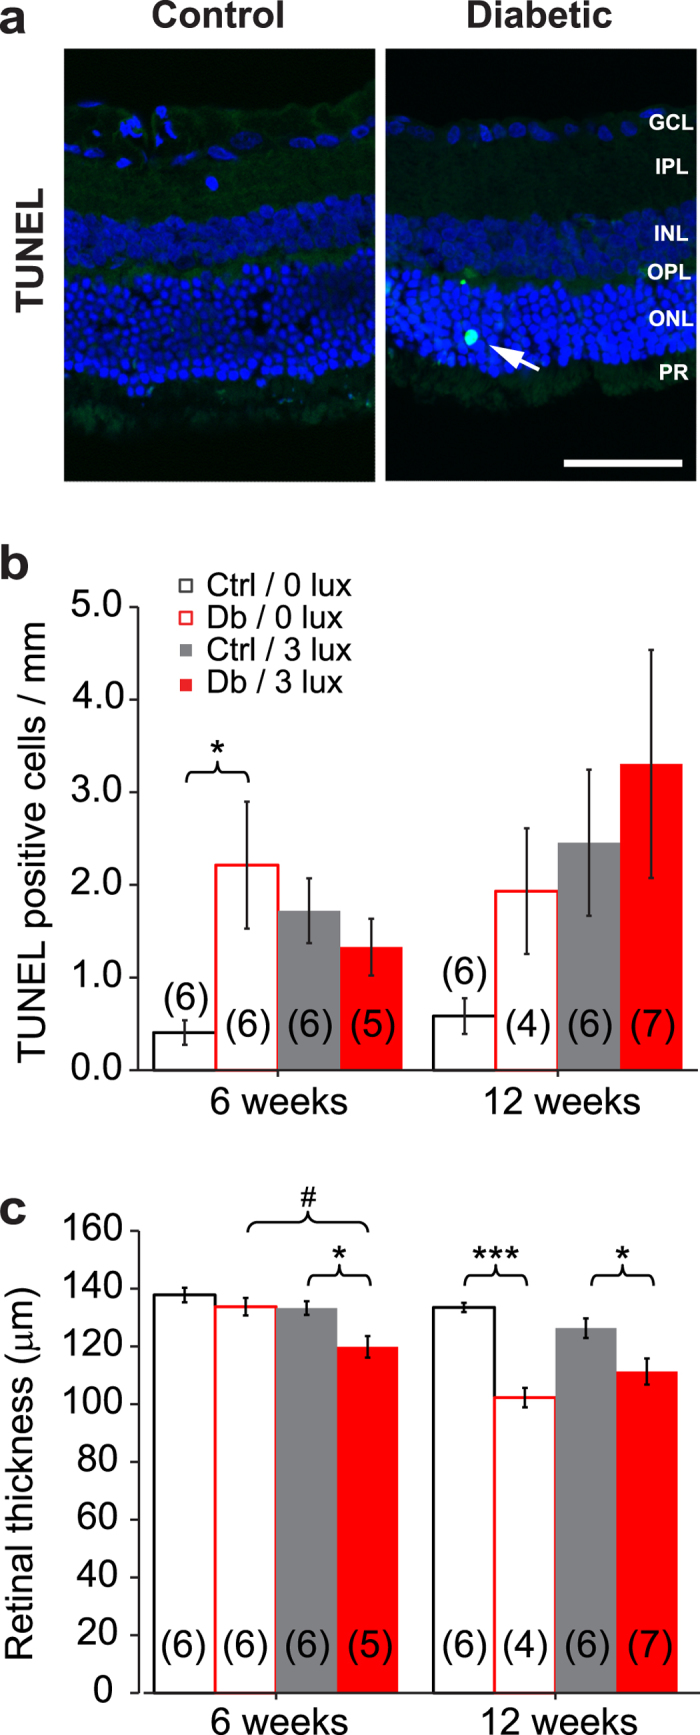
The aetiology of diabetic retinopathy (DR), the leading cause of blindness in the developed world, remains controversial. One hypothesis holds that retinal hypoxia, exacerbated by the high O2 consumption of rod photoreceptors in the dark, is a primary cause of DR. Based on this prediction we investigated whether early retinal abnormalities in streptozotocin-induced diabetic rats are alleviated by preventing the rods from dark adapting. Diabetic rats and their non-diabetic littermates were housed in a 12:12 hour light-dim light photocycle (30 lux during the day and 3 lux at night). Progression of early retinal abnormalities in diabetic rats was assessed by monitoring the ERG b-wave and oscillatory potentials, Müller cell reactive gliosis, and neuronal cell death, as assayed by TUNEL staining and retinal thickness at 6 and 12 weeks after diabetes induction. Maintaining diabetic animals in a dim-adapting light did not slow the progression of these neuronal and glial changes when compared to diabetic rats maintained in a standard 12:12 hour light-dark photocycle (30 lux during the day and 0 lux at night). Our results indicate that neuronal and glial abnormalities in early stages of diabetes are not exacerbated by rod photoreceptor O2 consumption in the dark.
Figures
Similar articles
-
Early retinal damage in experimental diabetes: electroretinographical and morphological observations.Exp Eye Res. 2002 May;74(5):615-25. doi: 10.1006/exer.2002.1170. Exp Eye Res. 2002. PMID: 12076083
-
Early inner retinal astrocyte dysfunction during diabetes and development of hypoxia, retinal stress, and neuronal functional loss.Invest Ophthalmol Vis Sci. 2011 Dec 2;52(13):9316-26. doi: 10.1167/iovs.11-7879. Invest Ophthalmol Vis Sci. 2011. PMID: 22110070
-
Erythropoietin protects retinal neurons and glial cells in early-stage streptozotocin-induced diabetic rats.Exp Eye Res. 2008 Feb;86(2):375-82. doi: 10.1016/j.exer.2007.11.010. Epub 2007 Nov 22. Exp Eye Res. 2008. PMID: 18191124
-
Hypoxia and Dark Adaptation in Diabetic Retinopathy: Interactions, Consequences, and Therapy.Curr Diab Rep. 2015 Dec;15(12):118. doi: 10.1007/s11892-015-0686-2. Curr Diab Rep. 2015. PMID: 26493191 Review.
-
Spare the rods and spoil the retina: revisited.Eye (Lond). 2016 Feb;30(2):189-92. doi: 10.1038/eye.2015.254. Epub 2015 Dec 11. Eye (Lond). 2016. PMID: 26656085 Free PMC article. Review.
Cited by
-
Do photoreceptor cells cause the development of retinal vascular disease?Vision Res. 2017 Oct;139:65-71. doi: 10.1016/j.visres.2017.03.011. Epub 2017 May 8. Vision Res. 2017. PMID: 28438678 Free PMC article. Review.
-
The effects of early diabetes on inner retinal neurons.Vis Neurosci. 2020 Sep 16;37:E006. doi: 10.1017/S095252382000005X. Vis Neurosci. 2020. PMID: 32933604 Free PMC article.
-
Transducin1, Phototransduction and the Development of Early Diabetic Retinopathy.Invest Ophthalmol Vis Sci. 2019 Apr 1;60(5):1538-1546. doi: 10.1167/iovs.18-26433. Invest Ophthalmol Vis Sci. 2019. PMID: 30994864 Free PMC article.
-
Photoreceptor responses to light in the pathogenesis of diabetic retinopathy.Vis Neurosci. 2020 Sep 14;37:E007. doi: 10.1017/S0952523820000061. Vis Neurosci. 2020. PMID: 32921331 Free PMC article. Review.
-
Loss of CD40 attenuates experimental diabetes-induced retinal inflammation but does not protect mice from electroretinogram defects.Vis Neurosci. 2017 Jan;34:E009. doi: 10.1017/S0952523817000074. Vis Neurosci. 2017. PMID: 28965505 Free PMC article.
References
-
- Fong D. S. et al. Retinopathy in diabetes. Diabetes Care 27, S84–87 (2004). - PubMed
-
- de Gooyer T. E. et al. Retinopathy is reduced during experimental diabetes in a mouse model of outer retinal degeneration. Invest. Ophthalmol. Vis. Sci. 47, 5561–5568 (2006). - PubMed
-
- Ly A. et al. Early inner retinal astrocyte dysfunction during diabetes and development of hypoxia, retinal stress, and neuronal functional loss. Invest. Ophthalmol. Vis. Sci. 52, 9316–9326 (2011). - PubMed
Publication types
MeSH terms
Substances
Grants and funding
LinkOut - more resources
Full Text Sources
Other Literature Sources
Medical
