. 2016 Feb 8:6:20602.
doi: 10.1038/srep20602.

Intestinal Microbiota Distinguish Gout Patients from Healthy Humans

Affiliations

Intestinal Microbiota Distinguish Gout Patients from Healthy Humans

Zhuang Guo et al. Sci Rep. .

Abstract

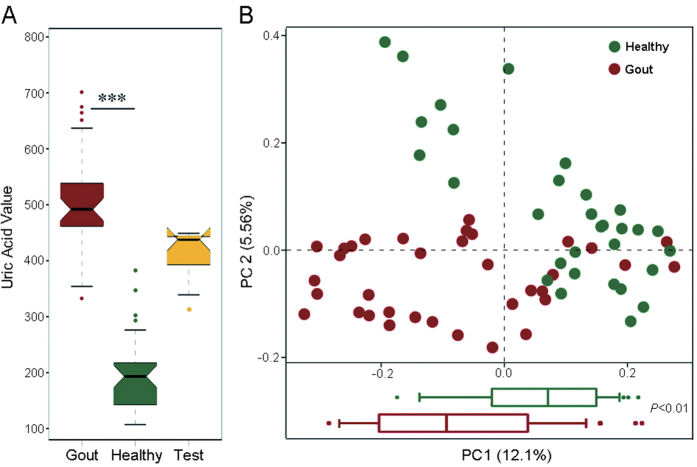
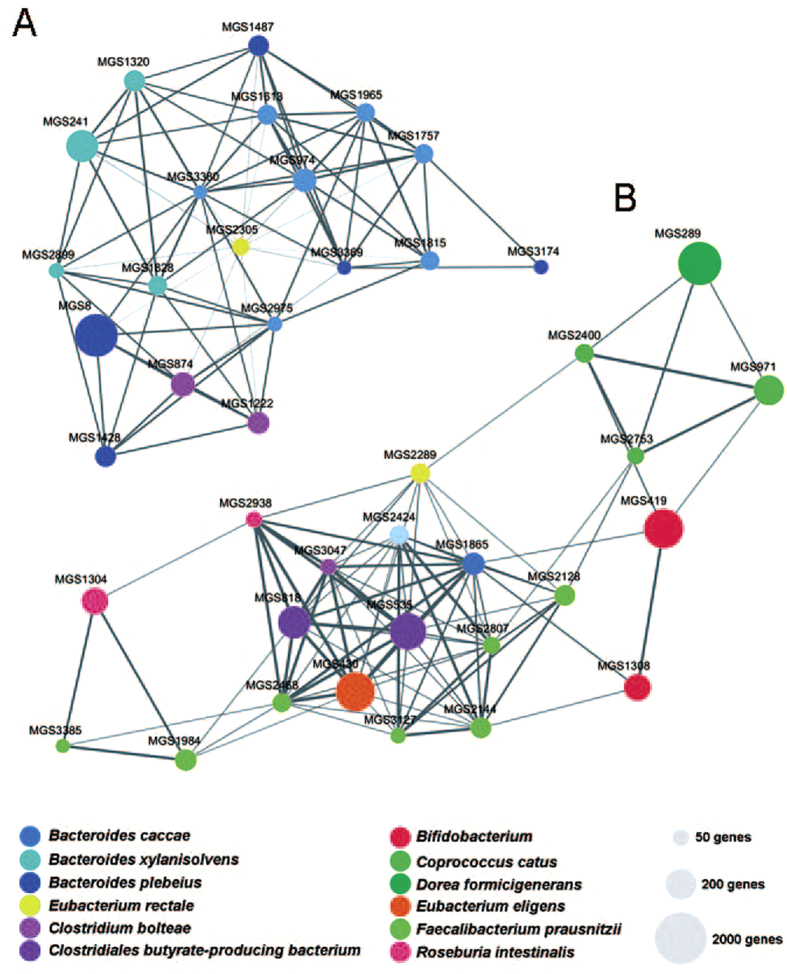
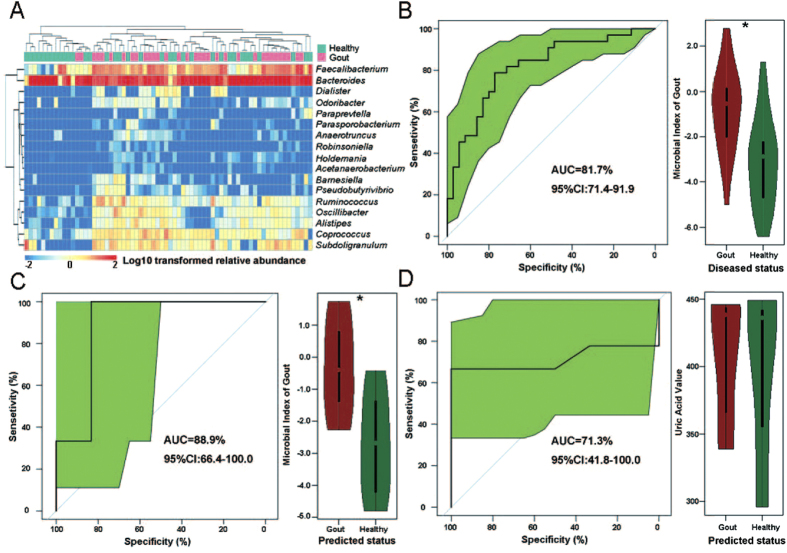
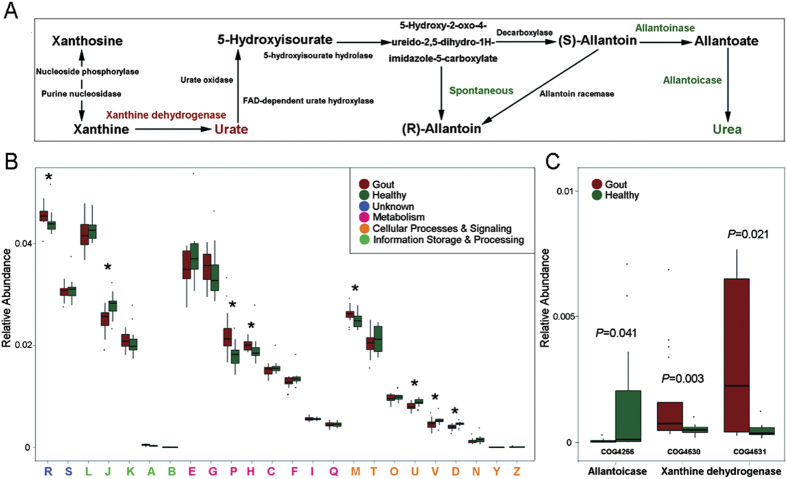
Current blood-based approach for gout diagnosis can be of low sensitivity and hysteretic. Here via a 68-member cohort of 33 healthy and 35 diseased individuals, we reported that the intestinal microbiota of gout patients are highly distinct from healthy individuals in both organismal and functional structures. In gout, Bacteroides caccae and Bacteroides xylanisolvens are enriched yet Faecalibacterium prausnitzii and Bifidobacterium pseudocatenulatum depleted. The established reference microbial gene catalogue for gout revealed disorder in purine degradation and butyric acid biosynthesis in gout patients. In an additional 15-member validation-group, a diagnosis model via 17 gout-associated bacteria reached 88.9% accuracy, higher than the blood-uric-acid based approach. Intestinal microbiota of gout are more similar to those of type-2 diabetes than to liver cirrhosis, whereas depletion of Faecalibacterium prausnitzii and reduced butyrate biosynthesis are shared in each of the metabolic syndromes. Thus the Microbial Index of Gout was proposed as a novel, sensitive and non-invasive strategy for diagnosing gout via fecal microbiota.


Figures

Figure 1
Figure 1. The composition of gut microbiota alters profoundly in gout patients.
(A) The uric acid values in the gout patients, healthy (control) and validation groups. (B) A principal component (PCoA) score plot based on weighted UniFrac metrics for all participants. Each point represents the composition of the intestinal microbiota of one participant.
Figure 2
Figure 2. Taxonomic characterization of the intestinal microbiota in gout.
Differentially abundant MGS networks enriched in gout patients (n = 19, panel A) and healthy individuals (n = 22, panel B). The edge width is proportional to the correlation strength. The node size is proportional to the mean abundance in the respective population. Nodes with the same color are classified in the same phylogenetic species. Every node represented a MGS.
Figure 3
Figure 3. Classification of the gout status using bacterial genus-level biomarkers based on 16S pyrosequencing data and stratification of RISK hosts in a validation cohort.
(A) The heatmap indicated the ability of the genus-level biomarkers to discriminate the healthy and gout groups. (B) Accuracy of the microbiota-based predictive model is measured by AUC in the gout and the control groups, and the box figure of MiG for all participants in the gout and the control groups were shown. (C) Accuracy of the microbiota-based model is measured by AUC in the validation group. (D) Accuracy of blood uric acid value based model is measured by AUC in the validation group.
Figure 4
Figure 4. Functional features of gut microbiota in gout.
(A) The metabolism of purine degradation. The enzymes in red were enriched in the gout patient group and those in green were enriched in the healthy (control) group. (B) Comparison of COGs between the patient and the control groups. A: RNA processing and modification; J: Translation, ribosomal structure and biogenesis; D: Cell cycle control, cell division, chromosome partitioning; M: Cell wall/membrane/envelope biogenesis; U: Intracellular trafficking, secretion, and vesicular transport; V: Defence mechanisms; H: Coenzyme transport and metabolism; P: Inorganic ion transport and metabolism; R: General function prediction only. The capital letters in red represent those functions enriched in the gout patient group, while the capital letters in blue represent those functions enriched in the control group. (C) Comparison of distribution of COGs of xanthine dehydrogenase and allantoicase between the patient and the control groups.

References

    1. Burns C. M. & Wortmann R. L. Gout therapeutics: new drugs for an old disease. Lancet 377, 165–177 (2011). - PubMed
    1. Richette P. & Bardin T. Gout. Lancet 375, 318–328 (2010). - PubMed
    1. Zhu Y., Pandya B. J. & Choi H. K. Comorbidities of gout and hyperuricemia in the US general population: NHANES 2007–2008. Am J Med 125, 679–687 (2012). - PubMed
    1. Kuo C. F., Grainge M. J., Mallen C., Zhang W. & Doherty M. Rising burden of gout in the UK but continuing suboptimal management: a nationwide population study. Ann Rheum Dis 74, 661–667 (2014). - PMC - PubMed
    1. Guo M. et al. Polymorphism of rs7688672 and rs10033237 in cGKII/PRKG2 and gout susceptibility of Han population in northern China. Gene 562, 50–54 (2015). - PubMed

MeSH terms