

Bioluminescent imaging of ABCG2 efflux activity at the blood-placenta barrier
- PMID: 26853103
- PMCID: PMC4745077
- DOI: 10.1038/srep20418
Bioluminescent imaging of ABCG2 efflux activity at the blood-placenta barrier
Abstract
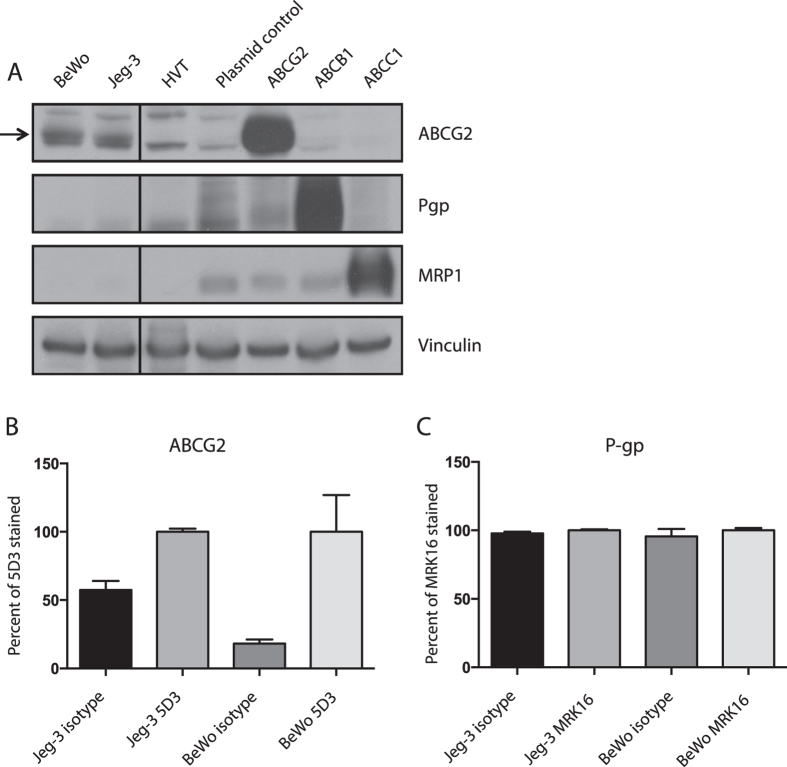
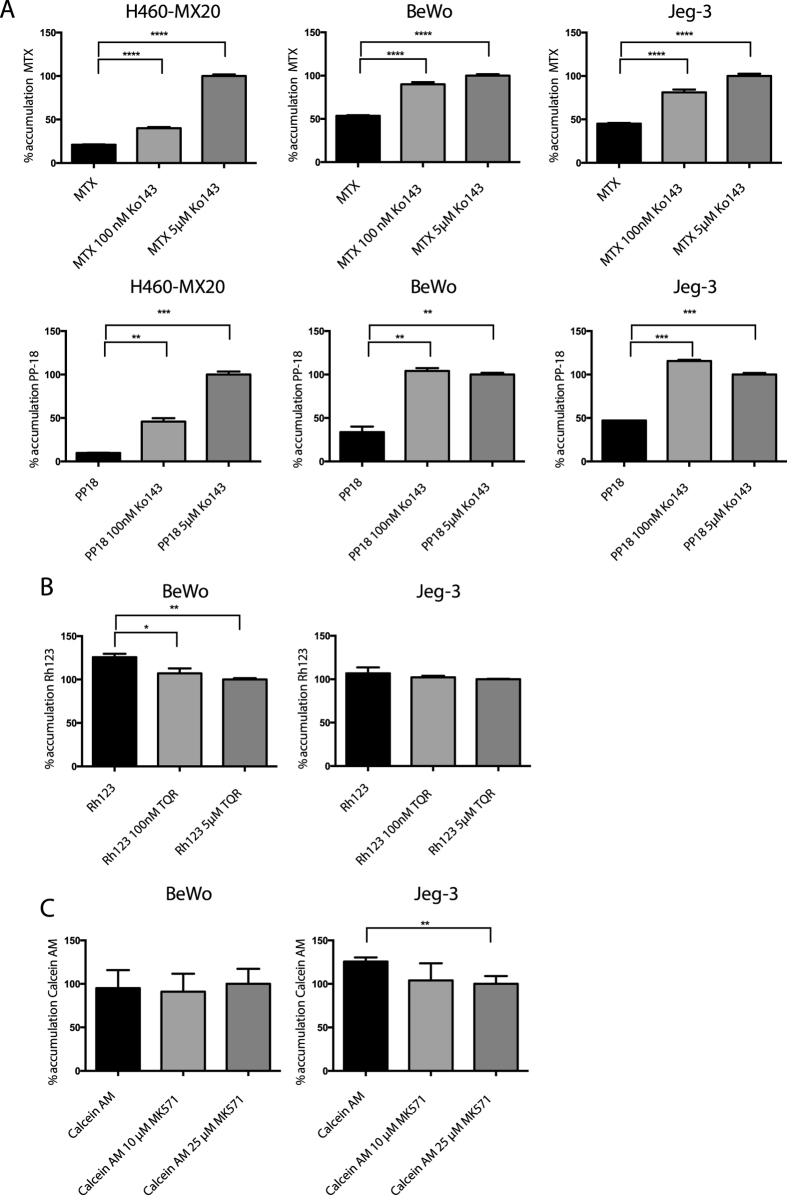
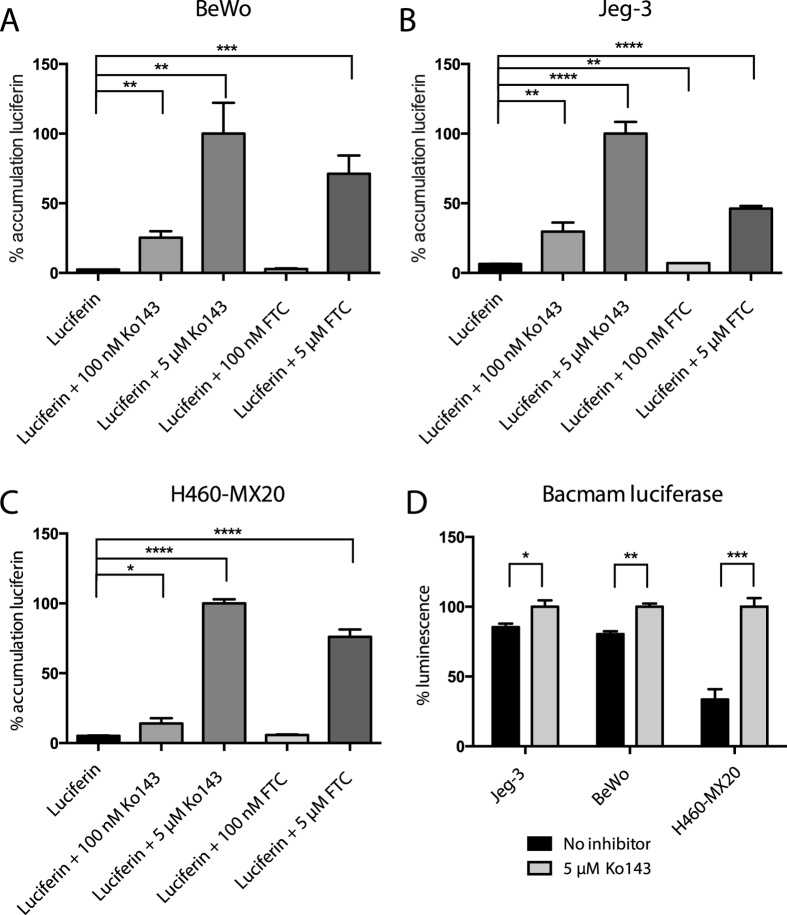
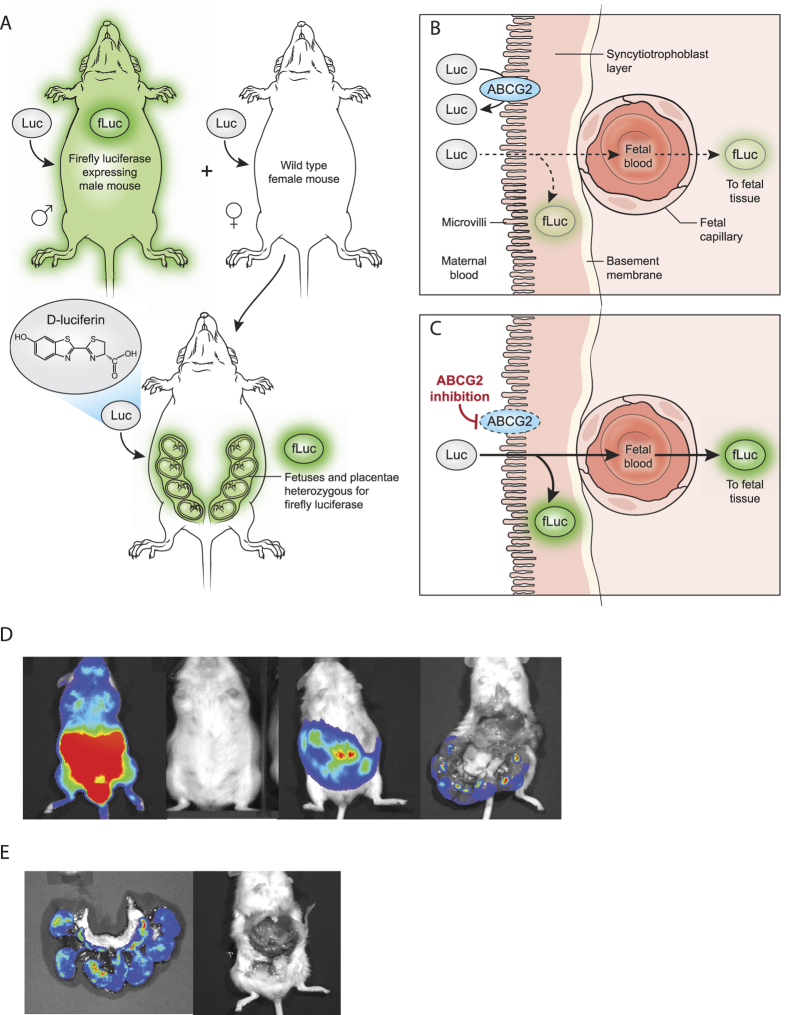
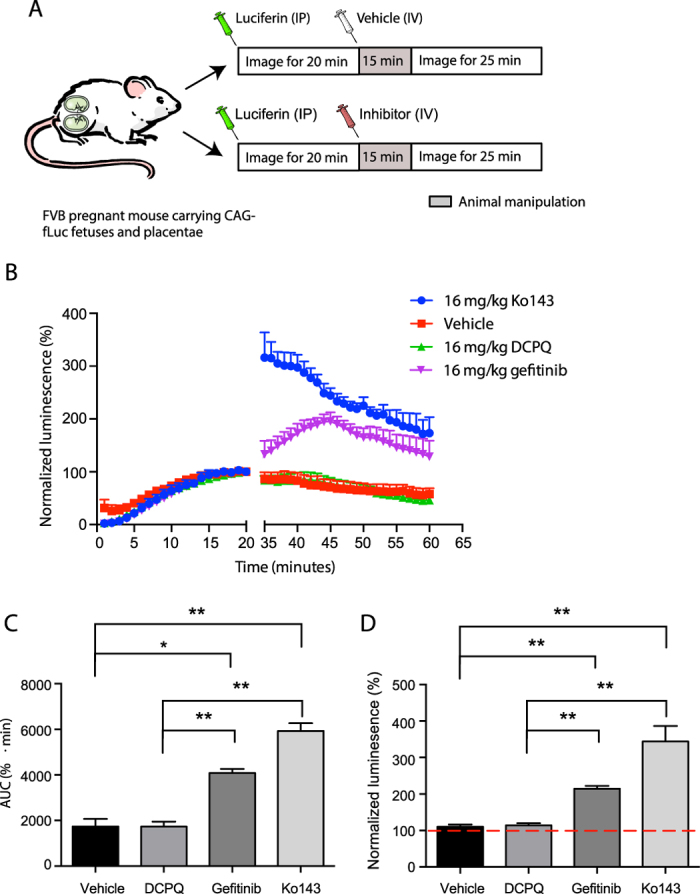
Physiologic barriers such as the blood placenta barrier (BPB) and the blood brain barrier protect the underlying parenchyma from pathogens and toxins. ATP-binding cassette (ABC) transporters are transmembrane proteins found at these barriers, and function to efflux xenobiotics and maintain chemical homeostasis. Despite the plethora of ex vivo and in vitro data showing the function and expression of ABC transporters, no imaging modality exists to study ABC transporter activity in vivo at the BPB. In the present study, we show that in vitro models of the placenta possess ABCG2 activity and can specifically transport D-luciferin, the endogenous substrate of firefly luciferase. To test ABCG2 transport activity at the BPB, we devised a breeding strategy to generate a bioluminescent pregnant mouse model to demonstrate transporter function in vivo. We found that coadministering the ABCG2 inhibitors Ko143 and gefitinib with D-luciferin increased bioluminescent signal from fetuses and placentae, whereas the control P-gp inhibitor DCPQ had no effect. We believe that our bioluminescent pregnant mouse model will facilitate greater understanding of the BPB and ABCG2 activity in health and disease.
Figures
Similar articles
-
Bioluminescent imaging of drug efflux at the blood-brain barrier mediated by the transporter ABCG2.Proc Natl Acad Sci U S A. 2013 Dec 17;110(51):20801-6. doi: 10.1073/pnas.1312159110. Epub 2013 Dec 2. Proc Natl Acad Sci U S A. 2013. PMID: 24297888 Free PMC article.
-
ABCG2/BCRP expression modulates D-Luciferin based bioluminescence imaging.Cancer Res. 2007 Oct 1;67(19):9389-97. doi: 10.1158/0008-5472.CAN-07-0944. Cancer Res. 2007. PMID: 17909048
-
In Vivo Bioluminescent Imaging of ATP-Binding Cassette Transporter-Mediated Efflux at the Blood-Brain Barrier.Methods Mol Biol. 2016;1461:227-39. doi: 10.1007/978-1-4939-3813-1_19. Methods Mol Biol. 2016. PMID: 27424909 Free PMC article.
-
In Vitro Models for Studying Transport Across Epithelial Tissue Barriers.Ann Biomed Eng. 2019 Jan;47(1):1-21. doi: 10.1007/s10439-018-02124-w. Epub 2018 Sep 14. Ann Biomed Eng. 2019. PMID: 30218224 Review.
-
Development of a Novel Tool To Demystify Drug Distribution at Tissue-Blood Barriers.Chembiochem. 2023 Jul 3;24(13):e202200804. doi: 10.1002/cbic.202200804. Epub 2023 Jun 1. Chembiochem. 2023. PMID: 36951632 Review.
Cited by
-
Coix Seed Extract Enhances the Anti-Pancreatic Cancer Efficacy of Gemcitabine through Regulating ABCB1- and ABCG2-Mediated Drug Efflux: A Bioluminescent Pharmacokinetic and Pharmacodynamic Study.Int J Mol Sci. 2019 Oct 23;20(21):5250. doi: 10.3390/ijms20215250. Int J Mol Sci. 2019. PMID: 31652737 Free PMC article.
-
A Comprehensive Exploration of Bioluminescence Systems, Mechanisms, and Advanced Assays for Versatile Applications.Biochem Res Int. 2024 Feb 5;2024:8273237. doi: 10.1155/2024/8273237. eCollection 2024. Biochem Res Int. 2024. PMID: 38347947 Free PMC article. Review.
-
The pre- and post-authorisation data published by the European medicines agency on the use of biologics during pregnancy and lactation.Br J Clin Pharmacol. 2020 Mar;86(3):580-590. doi: 10.1111/bcp.14145. Epub 2020 Jan 23. Br J Clin Pharmacol. 2020. PMID: 31633830 Free PMC article.
-
The Placental Barrier: the Gate and the Fate in Drug Distribution.Pharm Res. 2018 Feb 23;35(4):71. doi: 10.1007/s11095-017-2286-0. Pharm Res. 2018. PMID: 29476301 Review.
-
Placental ABC Transporters: Biological Impact and Pharmaceutical Significance.Pharm Res. 2016 Dec;33(12):2847-2878. doi: 10.1007/s11095-016-2028-8. Epub 2016 Sep 19. Pharm Res. 2016. PMID: 27644937 Free PMC article. Review.
References
Publication types
MeSH terms
Substances
Grants and funding
LinkOut - more resources
Full Text Sources
Other Literature Sources
Miscellaneous
