. 2016 Mar 7;26(5):563-74.
doi: 10.1016/j.cub.2015.12.063. Epub 2016 Feb 4.

Interface Contractility between Differently Fated Cells Drives Cell Elimination and Cyst Formation

Affiliations

Interface Contractility between Differently Fated Cells Drives Cell Elimination and Cyst Formation

Christina Bielmeier et al. Curr Biol. .

Abstract

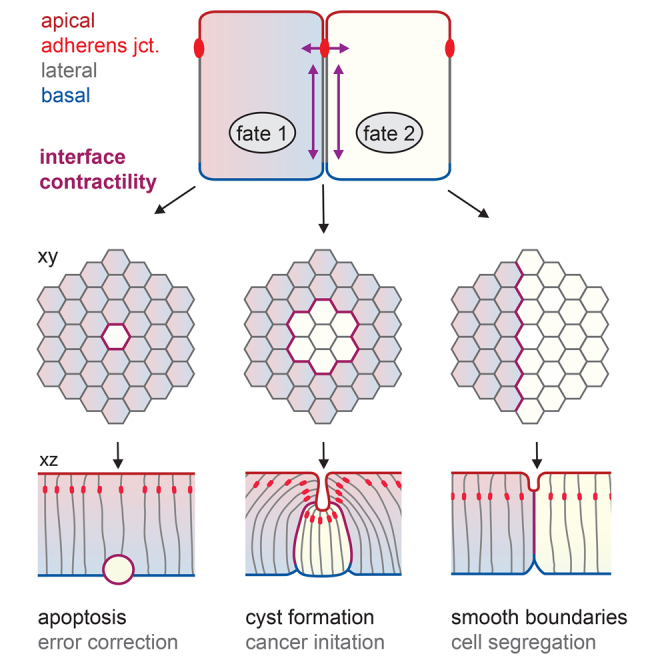
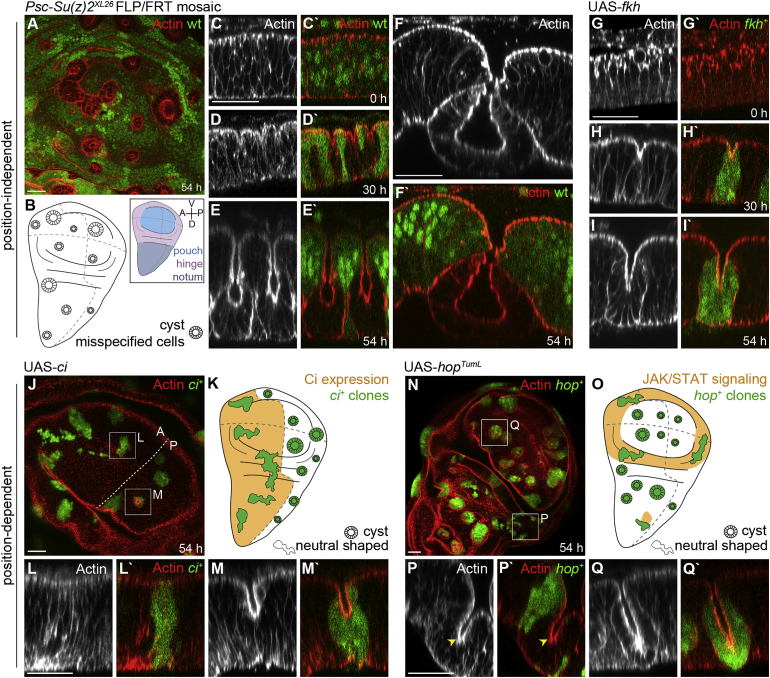
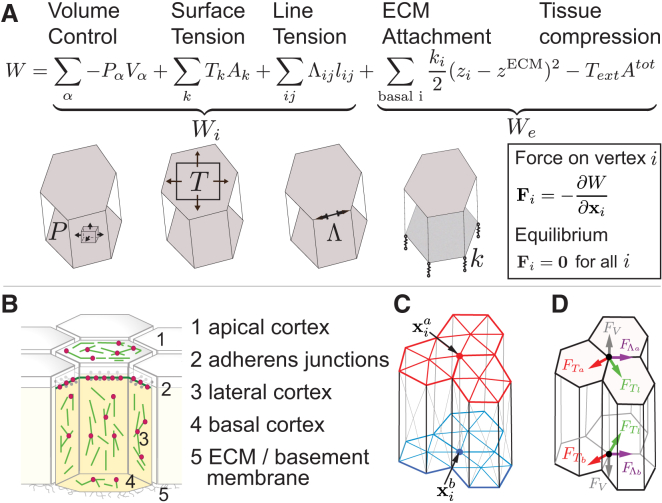
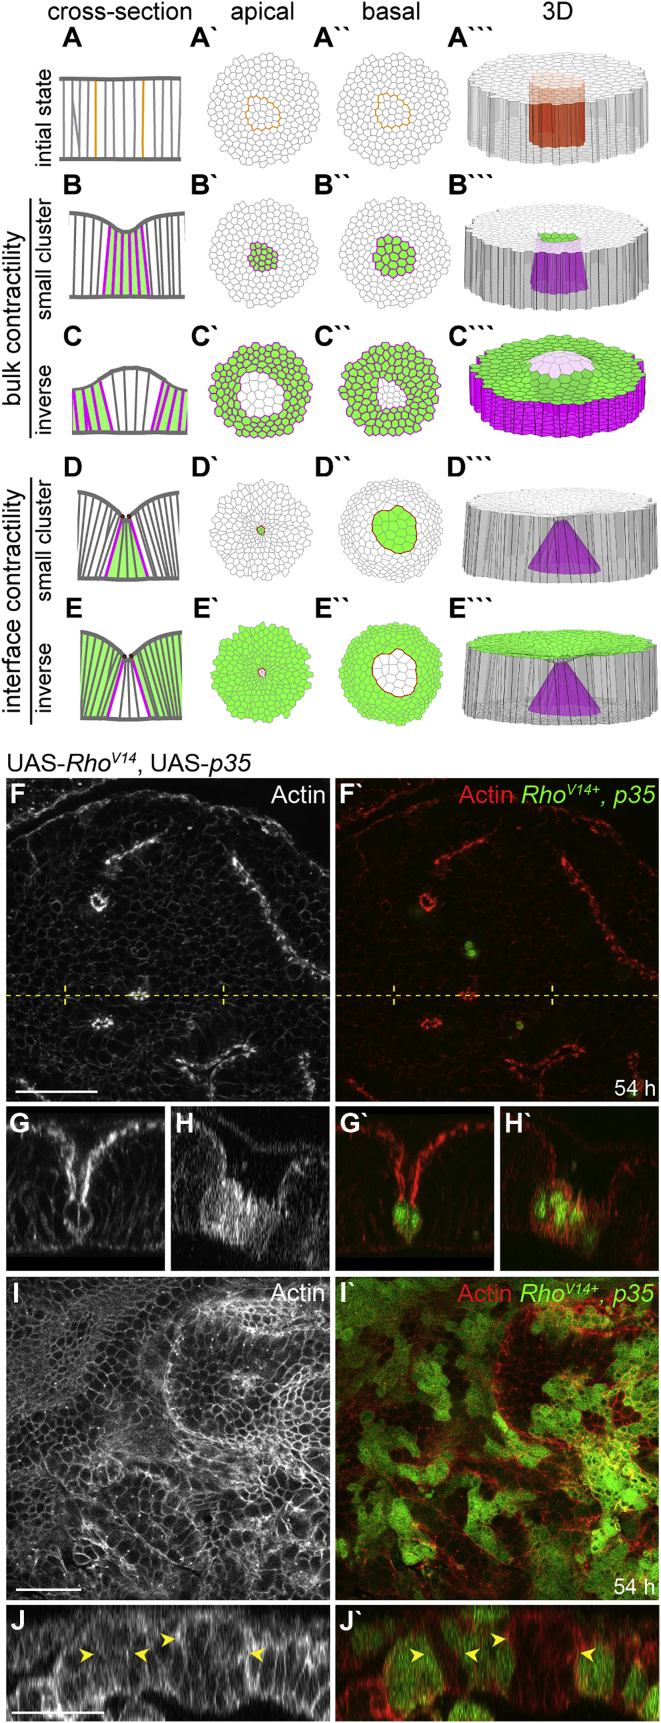
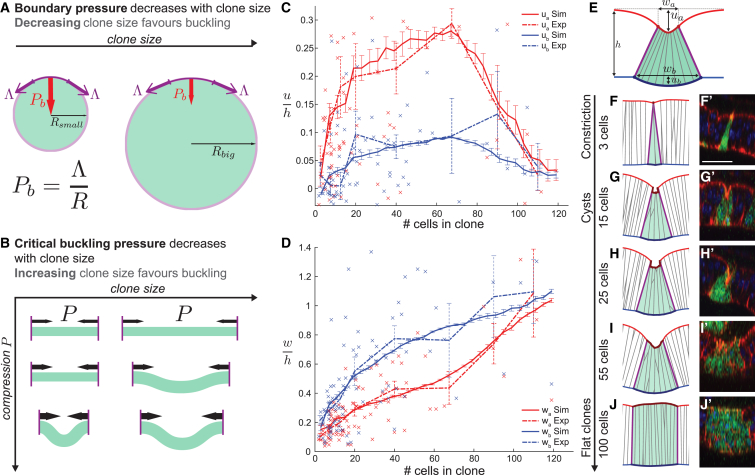
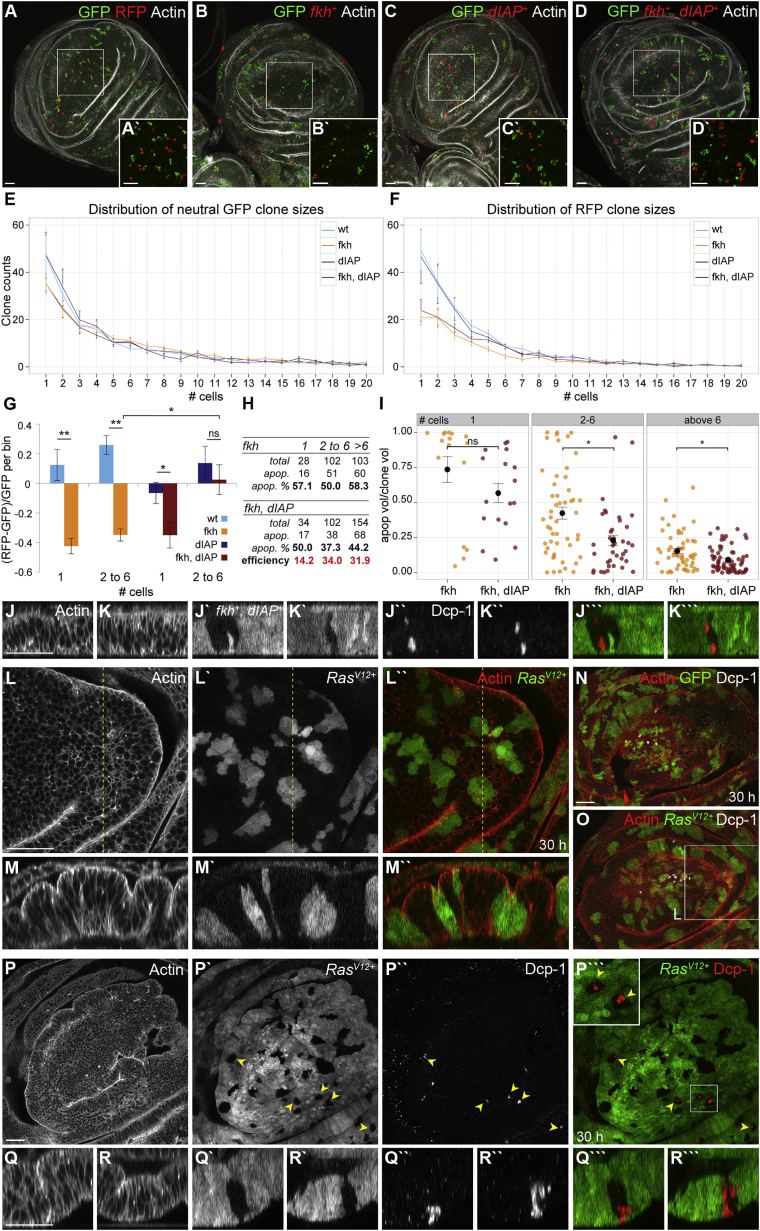
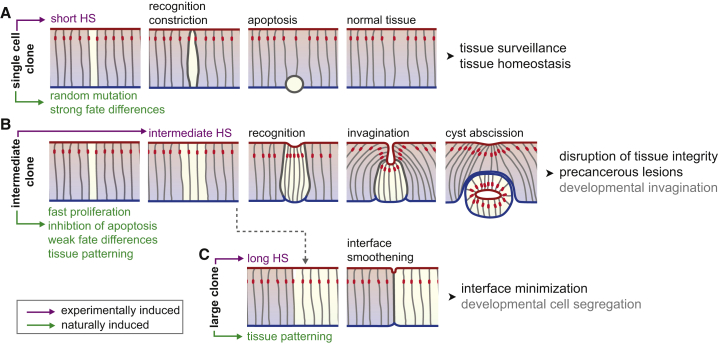
Although cellular tumor-suppression mechanisms are widely studied, little is known about mechanisms that act at the level of tissues to suppress the occurrence of aberrant cells in epithelia. We find that ectopic expression of transcription factors that specify cell fates causes abnormal epithelial cysts in Drosophila imaginal discs. Cysts do not form cell autonomously but result from the juxtaposition of two cell populations with divergent fates. Juxtaposition of wild-type and aberrantly specified cells induces enrichment of actomyosin at their entire shared interface, both at adherens junctions as well as along basolateral interfaces. Experimental validation of 3D vertex model simulations demonstrates that enhanced interface contractility is sufficient to explain many morphogenetic behaviors, which depend on cell cluster size. These range from cyst formation by intermediate-sized clusters to segregation of large cell populations by formation of smooth boundaries or apical constriction in small groups of cells. In addition, we find that single cells experiencing lateral interface contractility are eliminated from tissues by apoptosis. Cysts, which disrupt epithelial continuity, form when elimination of single, aberrantly specified cells fails and cells proliferate to intermediate cell cluster sizes. Thus, increased interface contractility functions as error correction mechanism eliminating single aberrant cells from tissues, but failure leads to the formation of large, potentially disease-promoting cysts. Our results provide a novel perspective on morphogenetic mechanisms, which arise from cell-fate heterogeneities within tissues and maintain or disrupt epithelial homeostasis.

Keywords: actomyosin contractility; cell elimination; continuum mechanics; epithelial cyst; epithelium; physical modeling; tissue patterning; vertex model.


Figures

None
Graphical abstract
Figure 1
Figure 1
Ectopic Expression of Cell-Fate-Specifying Transcription Factors Causes Cysts (A, C–J, L–N, P–Q) Wing disc pouch containing GFP-negative, Psc/Su(z)2XL26 clones (A–F; GFP is shown as green in A and C–F), or GFP-positive, fkh-expressing (G–I), ci-expressing (J–M), and hoptumL-expressing (N–Q) clones (green in G–Q). Actin is shown in red or gray (A, C–I, J, L–N, P, and Q). Confocal xy sections at 54 hr (A, J, and N) and cross-sections (C–I, L, M, P, and Q) at 0, 30, and 54 hr after clone induction are shown. (B) Scheme of position-independent cyst formation by Psc/Su(z)2XL26 and fkh+ clones (gray). Inset defines disc subregions, compartment boundaries (dotted lines) and anterior, posterior, dorsal, and ventral axis. (K and O) Scheme of position-dependent cyst formation by ci-expressing (K) and hoptumL-expressing (O) clones in regions where Hh/Ci (K) or JAK/STAT (O) signaling (orange) is low. Boxes in (J) and (N) frame clones whose cross-sections are displayed below. Arrowhead (P) points to endogenous tissue fold. Scale bars, 25 μm. See also Figures S1 and S2.
Figure 2
Figure 2
Cyst Formation Is Cell Non-autonomous and Correlates with Actomyosin Enrichment at the MWI (A and B) xz cross-sections of wild-type clones 30 hr after induction of large domains of (A) fkh+- or (B) ey+-expressing cells (green). Actin in red or gray. (C) Scheme of position-independent wild-type cysts surrounded by misspecified cells (green). (D and G–I) xz cross-section of fkh-expressing clones (green, D; red, G–I) 30 hr after induction in discs stained for Actin (D), expressing Sqh-GFP (G), stained for Sqh-1P (H), or expressing Zip-GFP (I) (gray or red, D; green, G–I). Arrowheads highlight enrichment at MWI. (E and F) Boxplots of normalized actin intensity at apical adherens junction (E) and basolateral interfaces (F) between wild-type (wt/wt), misspecified fkh+ (mis/mis), and wild-type and fkh+ cells (wt/mis). A two-tailed WSR test was applied. p < 0.01, ∗∗p < 0.001; ns, not significant. See Figure S3R for details. (J and K) xz cross-section of Psc/Su(z)2XL26 clones in discs expressing CollagenIV-GFP (Vkg-GFP), stained for βPS-Integrin (βPS) 54 hr after induction. Wild-type cells are gray in (J). Arrowheads (K) point to basement membrane deformation at MWI. (L–O) xy sections of wild-type (green or gray, L and N) and fkh-expressing clones (green or gray, M and O) 54 hr after induction at one-third of cell height. Boxes frame regions shown at higher magnification in (K), (N), and (O). Scale bars, 25 μm. See also Figures S2 and S3.
Figure 3
Figure 3
A Physical Description of Epithelia in a Three-Dimensional Vertex Model (A) Forces are obtained from an effective mechanical work function W that is the sum of internal and external work functions, Wi and We. We takes into account (1) intracellular pressure Pα constraining cell volume, (2) surface tensions Tk acting on cell surfaces k, and (3) line tensions Λij acting on edges between vertices i and j. We takes into account (1) springs resisting the deformation of basal vertices away from a reference plane and (2) external forces establishing compressive stress Text < 0. (B) Epithelial surface tensions arise from actomyosin cortices (actin green, myosin red) associated with apical, lateral, and basal faces. Line tensions arise from actin cables observed at adherens junctions. Extracellular matrix proteins (ECMs) cover the basal tissue surface. (C) In the model, tissue geometry is characterized by a set of vertices with positions xi. An additional vertex is introduced at the barycenter of each surface. Triangles connecting central and contour vertices define cell boundaries. (D) Forces acting on vertex i are obtained by differentiating the mechanical work with respect to vertex positions xi. Forces have contributions from surface tensions (FT), line tensions (FΛ), and cellular pressures (Fv). See also Figure S4.
Figure 4
Figure 4
MWI Contractility Is Sufficient and Necessary to Recapitulate Cyst Formation (A–E′′′) Vertex model simulations visualize epithelial shapes in cross-section (A–E), apical (A′–E′), basal (A′′–E′′), and 3D (A′′′–E′′′) views. A clone of 20 misspecified cells is shown before (A) and after changes to mechanical properties of misspecified cells (green) (B and C, “bulk contractility”) or the MWI (D and E, “interface contractility”). Magenta and red lines represent a 3-fold increase in lateral surface and apical line tension, respectively. (F–J) xy sections (F and I) and cross-sections (G, H, and J) of RhoV14,p35-expressing cells (green) 54 hr after induction. Actin is in gray or red. Arrowheads in (J) point to interspersed wild-type clones failing to form cysts. Dotted line in (F) indicates position at which cross-section (G) was reconstructed. Scale bars, 25 μm. See also Figure S3.
Figure 5
Figure 5
Final Clone Shape Depends on Clone Size (A) Laplace’s Law (Pb = Λ/R) predicts that the pressure Pb exerted by a contractile boundary with line tension Λ depends on the radius R of the enclosed material. Thus, large clones feel less pressure from a contractile boundary and are less likely to buckle. (B) The resistance to bending of an elastic disk depends on its radius. Smaller clones exhibit higher resistance to buckling than larger clones. (C and D) Experimental (dotted) and simulated (continuous line) deformations of apical (red) or basal (blue) cyst surfaces with respect to clone size. Parameters ua, ub (C) and wa and wb (D) are illustrated in (E). Error bars represent mean and SEM of 85 fkh-expressing clones 30 hr after induction and 15 simulations per data point. (E) Deformation parameters measured experimentally and fitted by simulations. wa, apical clone width; wb, basal clone width; ua, apical surface indentation; ub, basal surface deformation. (F–J) Simulated and experimental cross-sections of clones containing different cell numbers. Apical constriction, cyst formation, or minimal deformations correlate with clone size. Note that cross-section choice results in junctions not spanning apico-basal axis. Scale bars, 25 μm. See also Figures S4 and S5.
Figure 6
Figure 6
Small Misspecified Clusters Are Eliminated from Epithelia by MWI Contractility (A–D) Tie-Dye discs 30 hr after induction carrying neutral GFP-expressing (green) and RFP-expressing clones (A) or fkh+- (B), dIAP1+- (C), and fkh,dIAP1+-expressing clones (D) (red; Actin in gray). Boxes frame position of higher magnification insets. (E and F) Neutral GFP (E) and transgene-expressing RFP (F) clone size frequencies 30 hr after induction. RFP+ clones express either RFP alone or fkh+ and/or dIAP1+, as indicated. Histograms display clone counts for each clone size, binned into single-cell steps. (G) Relative loss of fkh+ and fkh,dIAP1+-expressing clones compared to wild-type or dIAP1+ control clones. For each disc, GFP+ clone counts were subtracted from RFP+ clone counts per size bin and normalized to GFP+ clone counts for the respective bin. (E–G) Mean and SEM of n = 8–10 discs for each genotype, analyzed by one-tailed WMW or Welch’s t tests are shown. p < 0.01, ∗∗p < 0.001, ns, not significant. See Figures S6A and S6D for details. (H) Counts of fkh+- or fkh,dIAP1+-expressing apoptotic clones binned into three size categories: one cell, two to six cells, and above six cells. Total counts, apoptotic counts, and percentages of apoptotic clones per size bin are shown. Efficiency of inhibiting apoptosis by dIAP1 expression was calculated as percentage of apoptosis in fkh+ (n = 3 discs, 233 clones) / percentage of apoptosis in fkh,dIAP1+ clones (n = 3 discs, 290 clones) per bin size. (I) Dot plot of Dcp-1-positive volume fractions in fkh+- and fkh,dIAP1+-expressing apoptotic clones binned into indicated size classes. Mean and SEM within bins analyzed by two-tailed WMW tests are shown. p < 0.01; ns, not significant. See Figure S6E for details. (J–K′′′) Cross-sections of fkh,dIAP1+-expressing cells (J′ and K′; green, J′′′ and K′′′) 30 hr after induction. Actin (J and K), Dcp-1 (J′′ and K′′; red, J′′′ and K′′′). (L–M′′) RasV12-expressing clones (L′ and M′; green, L′′ and M′′) 30 hr after induction, stained for Actin (L and M; red, L′′ and M′′). Line indicates position at which xz cross-section (M) was reconstructed. (N and O) GFP- (N) or RasV12-expressing clones (O) (green) stained for Actin (red) and Dcp-1 (gray). (P–R′′′) xy sections (P) and xz cross-section (Q and R) of RasV12-expressing cells (P′–R′; green, P′′′–R′′′) 30 hr after induction stained for Actin (P–R) and Dcp-1 (P′′–R′′; red, P′′′–R′′′). Box frames higher magnification inset. Arrowheads point to apoptotic wild-type clones. Scale bars, 25 μm. See also Figure S6.
Figure 7
Figure 7
Morphogenetic Behaviors Induced by Interface Contractility Tissue with apical (red), basal (blue), lateral surfaces (gray), and adherens junctions (red). Magenta indicates experimentally induced conditions (HS, heat shock), green potentially natural scenarios creating differently fated clone sizes. Gray indicates speculation on a role of interface contractility in development. (A) Single misspecified cells are experimentally induced by a short heat shock (HS). Random mutations arise naturally in single cells and may cause fate differences. Interface contractility causes apical constriction and apoptosis to preserve tissue homeostasis. (B) Intermediate-sized clones are induced experimentally by intermediate HS. Misspecified cell clusters may arise naturally from single cells that proliferate before detection or escape apoptosis by potent onco- or tumor-suppressor-gene mutations. During development, intermediate clusters arise by patterning. Cysts compromise tissue integrity and potentially promote precancerous lesions. (C) Large clones are induced experimentally by long HS. During development, large lineage domains arise by patterning and tissue growth. Interface contractility leads to interface smoothening as observed at lineage boundaries.

Comment in

Similar articles

Cited by

References

    1. Heisenberg C.P., Bellaïche Y. Forces in tissue morphogenesis and patterning. Cell. 2013;153:948–962. - PubMed
    1. Varner V.D., Nelson C.M. Cellular and physical mechanisms of branching morphogenesis. Development. 2014;141:2750–2759. - PMC - PubMed
    1. San Roman A.K., Shivdasani R.A. Boundaries, junctions and transitions in the gastrointestinal tract. Exp. Cell Res. 2011;317:2711–2718. - PMC - PubMed
    1. Dahmann C., Oates A.C., Brand M. Boundary formation and maintenance in tissue development. Nat. Rev. Genet. 2011;12:43–55. - PubMed
    1. Batlle E., Henderson J.T., Beghtel H., van den Born M.M.W., Sancho E., Huls G., Meeldijk J., Robertson J., van de Wetering M., Pawson T., Clevers H. Beta-catenin and TCF mediate cell positioning in the intestinal epithelium by controlling the expression of EphB/ephrinB. Cell. 2002;111:251–263. - PubMed

Publication types

Substances

LinkOut - more resources