. 2017 Oct 3;14(10):1326-1334.
doi: 10.1080/15476286.2015.1112487. Epub 2016 Feb 6.

MicroRNAs activate gene transcription epigenetically as an enhancer trigger

Affiliations

MicroRNAs activate gene transcription epigenetically as an enhancer trigger

Min Xiao et al. RNA Biol. .

Abstract

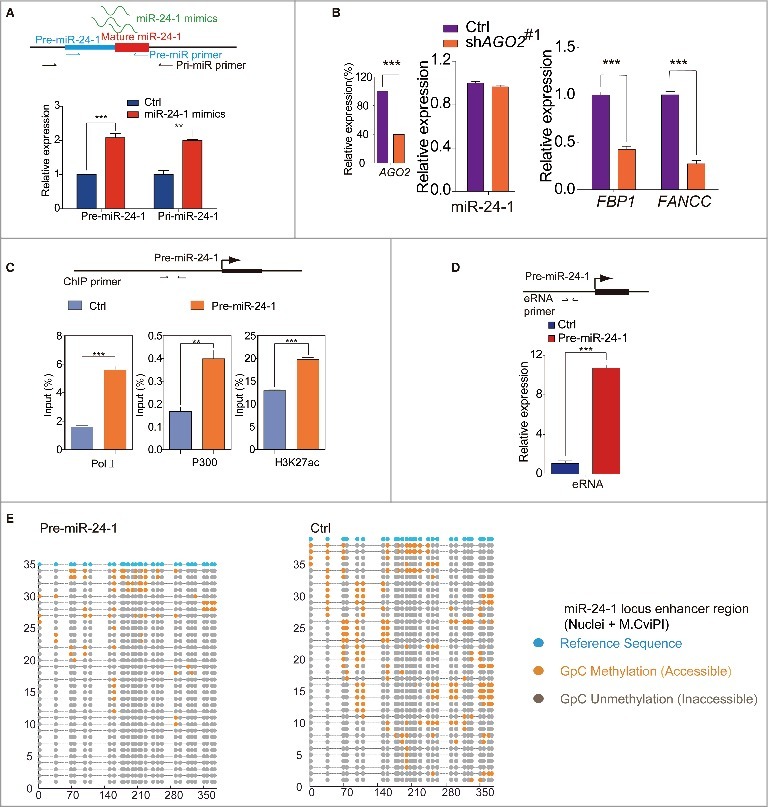
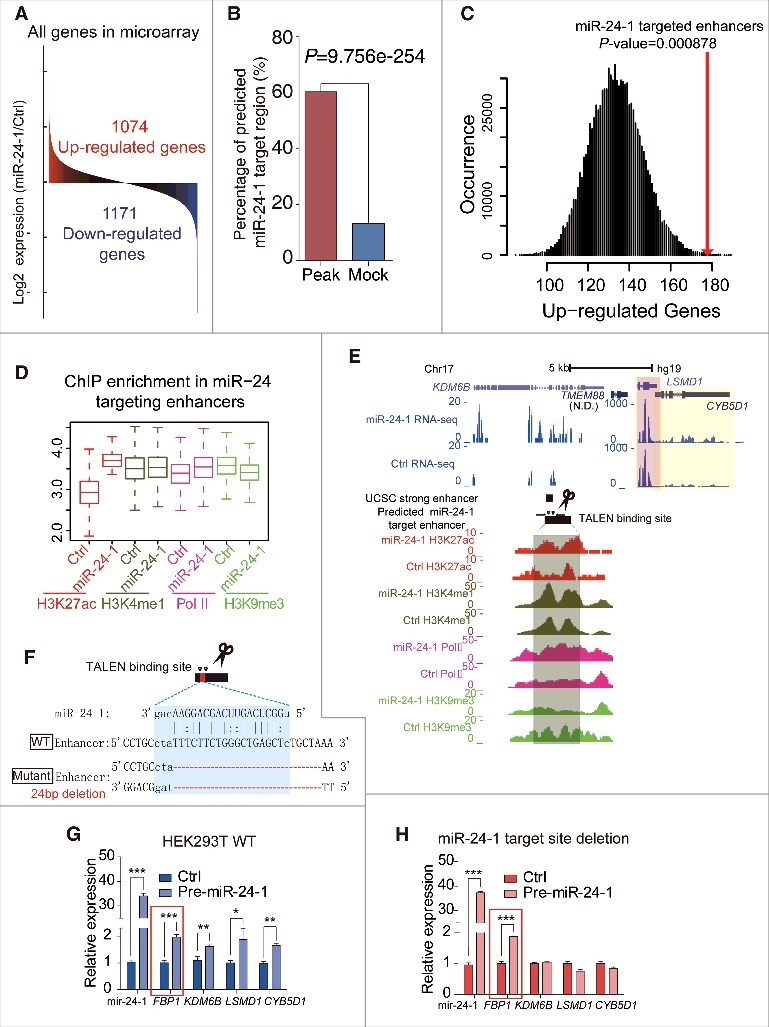
MicroRNAs (miRNAs) are small non-coding RNAs that function as negative gene expression regulators. Emerging evidence shows that, except for function in the cytoplasm, miRNAs are also present in the nucleus. However, the functional significance of nuclear miRNAs remains largely undetermined. By screening miRNA database, we have identified a subset of miRNA that functions as enhancer regulators. Here, we found a set of miRNAs show gene-activation function. We focused on miR-24-1 and found that this miRNA unconventionally activates gene transcription by targeting enhancers. Consistently, the activation was completely abolished when the enhancer sequence was deleted by TALEN. Furthermore, we found that miR-24-1 activates enhancer RNA (eRNA) expression, alters histone modification, and increases the enrichment of p300 and RNA Pol II at the enhancer locus. Our results demonstrate a novel mechanism of miRNA as an enhancer trigger.

Keywords: Chromatin modification; enhancer; miR-24; microRNA; nucleus; transcriptional activation.


Figures

Figure 1.
Figure 1.
Classification and characterization of enhancer-associated miRNAs. (A) Classification of enhancer-associated miRNAs based on H3K27ac enrichment of miRNA loci across 7 cell lines. miRNAs are organized by the different cell types, starting with the H3K27ac-enriched among all 7 cell types at the top and proceeding down to specifically enriched in one cell type. Each column represents a different cell type and each row shows relative H3K27ac enrichment at one miRNA genomic locus, with signal around ±5 kb region plotted. (B) Relationship between miRNA expression, enhancer activity and transcription of neighboring genes in GM12878 (UCSC). miRNAs are ranked from high to low based on H3K27ac density. The left 4 columns depict the patterns of enhancer markers within ±5 kb of miRNA loci. The right 4 columns are the transcription level of miRNAs in different cellular compartments and the neighboring genes. Correlation coefficiency between H3K27ac and others are shown in Fig. S1E. Color bars at the bottom indicate the range for each depth-normalized data set. See also Fig. S1.
Figure 2.
Figure 2.
Enhancer associated miRNA mediates transcriptional gene activation. (A) miR-26a-1 (upper panel), miR-339 (lower panel) up-regulate their respective neighboring genes expression. (B) UCSC genome browser: miR-3179-2 and miR-3180-2 accompanied by the same neighboring genes sit in the peak and valley of H3K4me1/H3K27ac derived from 7 cell lines in ENCODE UCSC, respectively (upper panel). Overexpression of these two miRNAs, the neighboring gene transcripts are quantified by qPCR (lower panel). (C) Western blot analysis of FBP1 and FANCC levels. (D) miRNA mimic up-regulates the neighbor genes expression. (E) Depletion of miR-24-3p using antagomir reduced its neighboring genes mRNA expression. All values are normalized to GAPDH and error bars show mean ± SEM for 3 biological replicates. *P < 0.05, **P < 0.01, ***P < 0.001 by 2-tailed student's t-test. See also Fig. S2.
Figure 3.
Figure 3.
miRNA mediated transcriptional gene activation requires the intact miRNA and its targeted enhancer. (A) Sequences of miR-24-1 and its mutants. (B) Analysis of HEK293T transfected with wild-type and mutant miR-24-1 by real-time RT-qPCR. GFP is used to normalize the transfection efficiency. (C) Schematic representation of the TALEN constructs targeting to the miRNA site in the enhancer locus (red, ChIP-seq track). TALENs were designed for pairwise heterodimeric binding to indicated target sequences (blue box) and the sketch map shows the reference sequence and miR-24-1 deletion#1 sequence. (D-E) miR-24-1 deletion#1 abolished neighboring gene activation. Different expression level of miR-24-1 did not up-regulate FBP1 expression in miR-24-1 deletion#1. The trigon represents the miRNA expression level from low to high. All values are normalized to GAPDH and error bars show mean ± SEM for 3 technical replicates. *P < 0.05, **P < 0.01, ***P < 0.001 by 2-tailed student's t-test. See also Fig. S3.
Figure 4.
Figure 4.
Epigenetic events involved in miRNAs' transcriptional activation. (A) miRNA mimic (green lines) increases the endogenous miRNA expression (red rectangle, mature miRNA; blue rectangle, pre-miRNA). Arrows indicate primer locations for qPCR analysis of endogenous miRNA. (B) Depletion of AGO2 blocks transcriptional activation of neighboring genes. (C) Pol II, p300 and H3K27ac ChIP assays on the miR-24-1 locus. (D) The schematic diagram (upper panel) represents the position of eRNA primers. qPCR data from the lower panel shows that eRNAs are produced from the miR-24-1 locus upon miRNA overexpression. Fig. A-D, data shown are mean ± SEM from 3 independent transfections. **P < 0.01, ***P < 0.001 by 2-tailed Student's t-test. (E) The occupancy pattern of chromatin status of miR-24-1 enhancer locus by NOMe-seq. Nuclei were extracted from HEK293T cells and treated with M.CviPI GpC methyltransferase and subjected to bisulfite conversion and cloning. Circles represent GpC dinucleotides (Blue: the reference GpC sites; Gray: occupied, unmethylated and inaccessible to M.CviPI; Orange: unoccupied, methylated and accessible to M.CviPI). Horizontal lines represent randomly selected clones. Y-axis indicates the clone number and X-axis marks the sequence length of DNA. The changed occupancy in the enhancer and promoter region is around 70bp, unable to accommodate a singular nucleosome, hinting that those regions may be occupied by regulation factors. Both regions gained occupancy by miR-24-1 overexpression as compared with the control.
Figure 5.
Figure 5.
miRNAs activate genome-wide gene transcription. (A) Microarray shows that 1074 genes were upregulated after miR-24-1 transfection to HEK293T cells. Up- and downregulated genes are shaded in red and blue, respectively. (B) The miRanda algorithm analysis shows that 60.42% of total 3282 H3K27ac enriched regions were predicted as miR-24-1 targeted sites, while only 13.24% of total 2070 mock regions were predicted (P = 9.756e-254, χ2 Test). (C) Correlation between miR-24-1 target enhancers and adjacent up-regulated gene number calculated in ±100k of miR-24-1 targeted H3K27ac peaks. Difference in upregulated gene number is significant (P = 0.000878) relative to mock. The x-axis is the up-regulated genes number, and y-axis is the occurrence of every number in total 1 million times. In detail, we identified 1984 potential miR-24-1 targeted enhancers through H3K27ac histone ChiP-seq data and miRanda prediction. A total number of 179 upregulated genes revealed by microarray assay are located within ±100Kb of these enhancers. As the control, we created a background by randomly sampling sets of mock regions which has same length with targeted enhancers for 1 million times and computing the up-regulated genes number within ±100Kb of every mock region. Distribution of the upregulated genes number in the background is plotted as the black curve. Up-regulated genes number for potential miR-24-1 targeted enhancers is significant (P-value = 0.000878, red line) relative to our background model. (D) As shown by ChIP-seq boxplots, H3K27ac, H3K4me1 and Pol II was enriched while H3K9me3 decreased in the predicted miR-24-1 target region when miR-24 overepressed. (E) An example of Fig. 5D. Genomic locus of the predicted miR-24-1 target region overlapped with the strong enhancer (blue, left). After miR-24-1 overexpressed, H3K27ac, H3K4me1 and Pol II was enriched while H3K9me3 decreased. LSMD1 (pink shadow) and CYB5D1 (yellow shadow) became upregulated as RNA-seq analysis shown. Also by microarray data, LSMD1 appears to be up-regulated. (F) Schematic of TALENs design for miR-24-1 targeted locus predicted by miRanda overlapped with an enhancer (blue). (G–H) miR-24-1 target site deletion abolished neighboring gene activation. FBP1 in red box as a positive control. All values are normalized to GAPDH and error bars show mean ± SEM for 3 biological replicates *P < 0.05, **P < 0.01, ***P < 0.001 by 2-tailed student's t-test.

Similar articles

Cited by

References

    1. Fabian MR, Sonenberg N, Filipowicz W. Regulation of mRNA translation and stability by microRNAs. Annu Rev Biochem 2010; 79:351-79; PMID:20533884; https://doi.org/10.1146/annurev-biochem-060308-103103 - DOI - PubMed
    1. Pasquinelli AE. MicroRNAs and their targets: recognition, regulation and an emerging reciprocal relationship. Nat Rev Genet 2012; 13:271-82; PMID:22411466; https://doi.org/10.1038/nrg3162 - DOI - PubMed
    1. Bartel DP. MicroRNAs: genomics, biogenesis, mechanism, and function. Cell 2004; 116:281-97; PMID:14744438; https://doi.org/10.1016/S0092-8674(04)00045-5 - DOI - PubMed
    1. Matsui M, Chu Y, Zhang H, Gagnon KT, Shaikh S, Kuchimanchi S, Manoharan M, Corey DR, Janowski BA. Promoter RNA links transcriptional regulation of inflammatory pathway genes. Nucleic Acids Res 2013; 41:10086-109; PMID:23999091; https://doi.org/10.1093/nar/gkt777 - DOI - PMC - PubMed
    1. Majid S, Dar AA, Saini S, Yamamura S, Hirata H, Tanaka Y, Deng G, Dahiya R. MicroRNA-205-directed transcriptional activation of tumor suppressor genes in prostate cancer. Cancer 2010; 116:5637-49; PMID:20737563; https://doi.org/10.1002/cncr.25488 - DOI - PMC - PubMed

Publication types