. 2016 Mar 8;23(3):517-28.
doi: 10.1016/j.cmet.2016.01.007. Epub 2016 Feb 4.

Environment Impacts the Metabolic Dependencies of Ras-Driven Non-Small Cell Lung Cancer

Affiliations

Environment Impacts the Metabolic Dependencies of Ras-Driven Non-Small Cell Lung Cancer

Shawn M Davidson et al. Cell Metab. .

Abstract

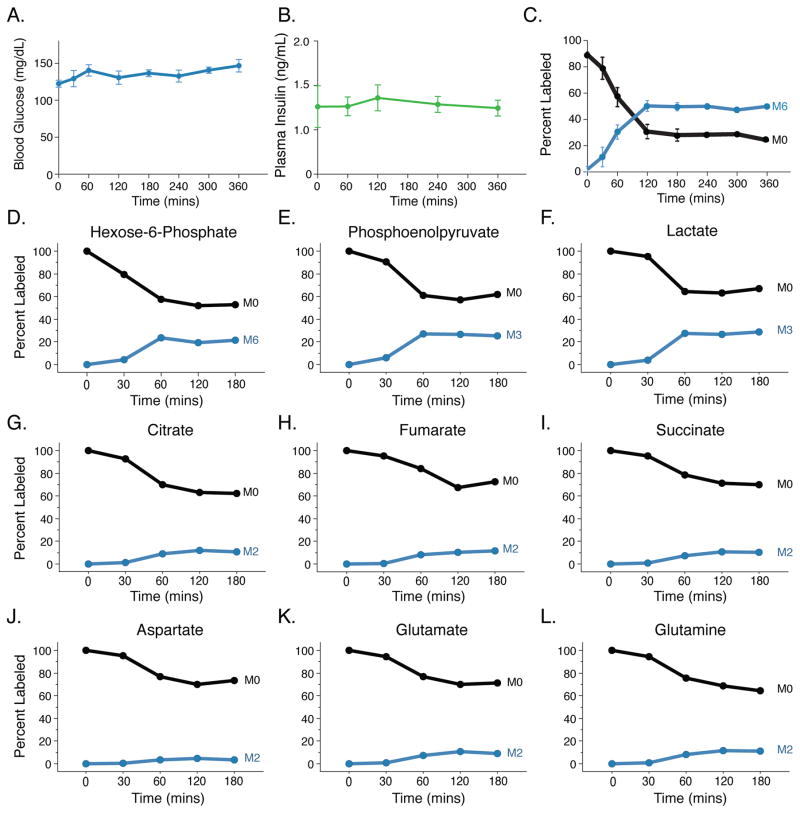
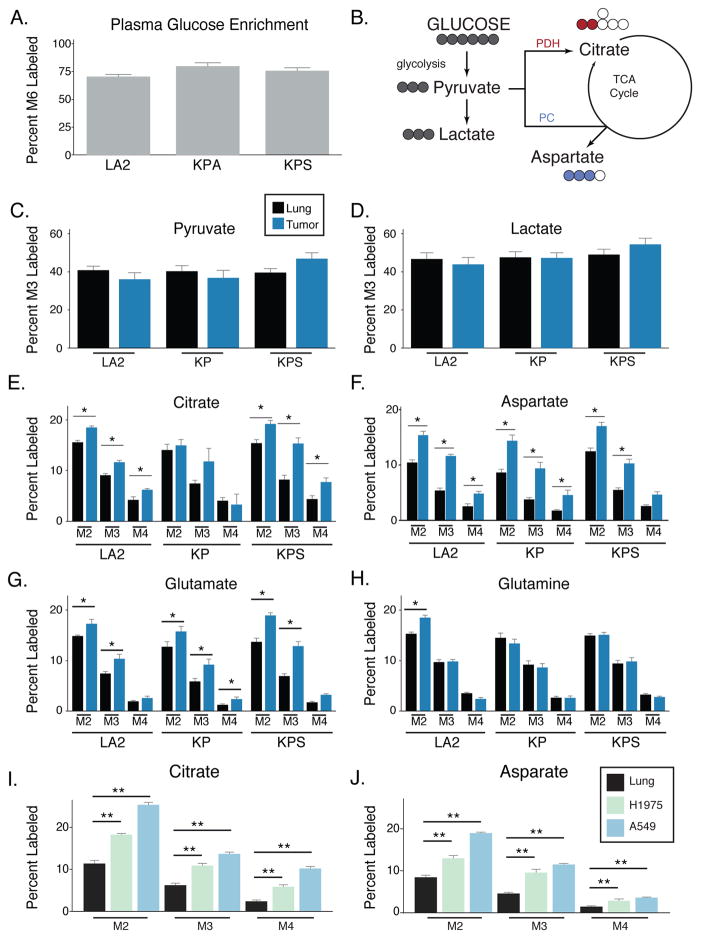
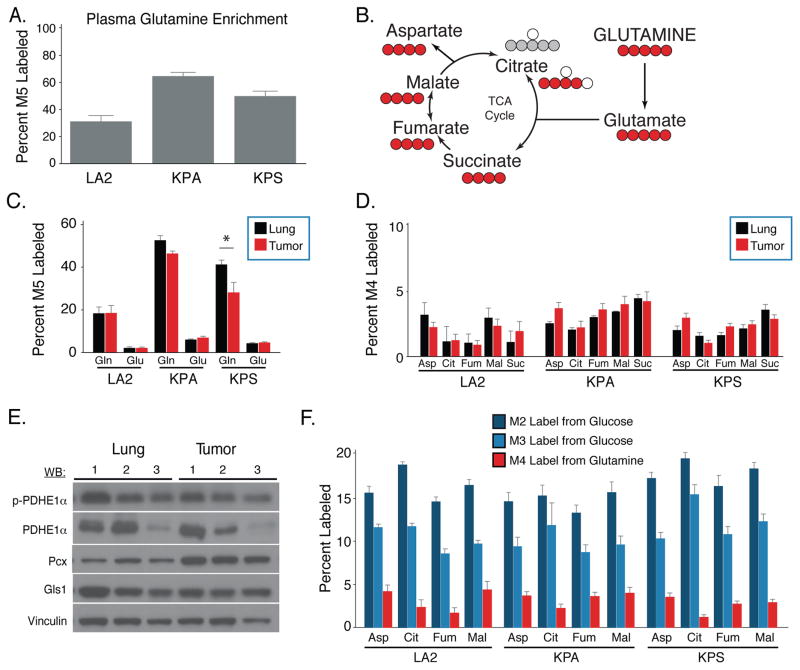
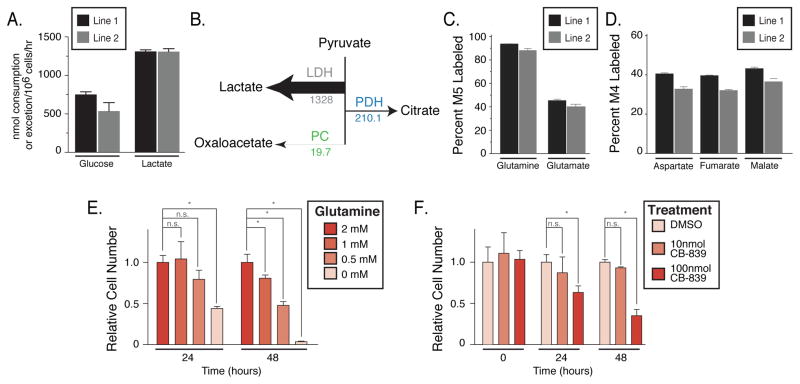
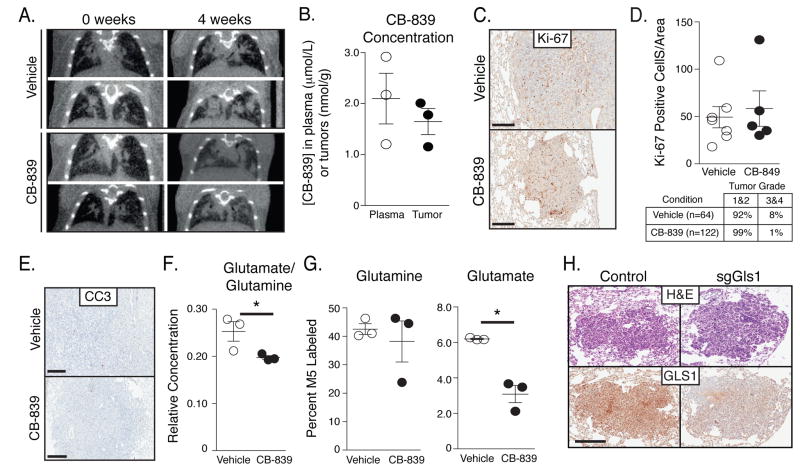
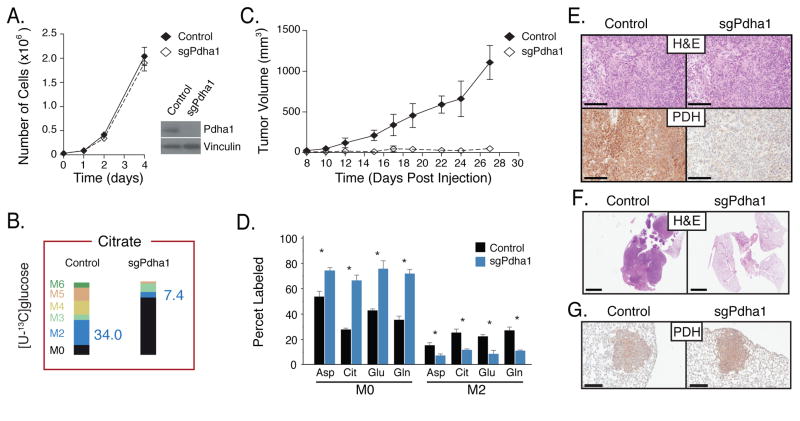
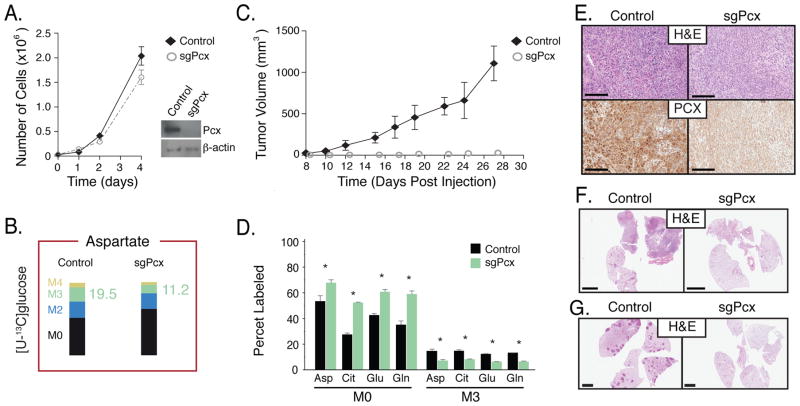
Cultured cells convert glucose to lactate, and glutamine is the major source of tricarboxylic acid (TCA)-cycle carbon, but whether the same metabolic phenotype is found in tumors is less studied. We infused mice with lung cancers with isotope-labeled glucose or glutamine and compared the fate of these nutrients in tumor and normal tissue. As expected, lung tumors exhibit increased lactate production from glucose. However, glutamine utilization by both lung tumors and normal lung was minimal, with lung tumors showing increased glucose contribution to the TCA cycle relative to normal lung tissue. Deletion of enzymes involved in glucose oxidation demonstrates that glucose carbon contribution to the TCA cycle is required for tumor formation. These data suggest that understanding nutrient utilization by tumors can predict metabolic dependencies of cancers in vivo. Furthermore, these data argue that the in vivo environment is an important determinant of the metabolic phenotype of cancer cells.


Figures

Figure 1
Figure 1. Steady state labeling of metabolites in tissues
(A) Blood glucose levels over time in mice infused with [U-13C]glucose. Values shown are mean +/− SEM, n = 4. (B) Plasma insulin levels over time in mice infused with [U-13C]glucose. Values shown are mean +/− SEM, n = 4. (C) Plasma enrichment of fully labeled glucose (M6) in animals infused with [U-13C]glucose over time. Values shown are mean +/− SEM, n = 4. (D–F) Representative serial sacrifice (n=1) of WT animals after infusion of [U-13C]glucose. Labeling of glycolytic intermediates in lung tissue from wild type mice infused with [U-13C]glucose for the indicated time at 20mg/kg/min. The unlabeled (M0) and fully-labeled (M3 or M6) isotopomer is shown for each species. (G–I) Representative serial sacrifice (n=1) of WT animals after infusion of [U-13C]glucose. Labeling of TCA intermediates in lung tissue from wild type mice infused with [U-13C]glucose for the indicated time at 20mg/kg/min. The unlabeled (M0) and prominent M2 labeled isotopomer are shown for each species. (J–L) Representative serial sacrifice (n=1) of WT animals after infusion of [U-13C]glucose. Labeling of aspartate, glutamate, and glutamine in in lung tissue from wild type mice infused with [U-13C]glucose for the indicated time at 20mg/kg/min. The unlabeled (M0) and prominent M2 labeled isotopomer are shown for each species.
Figure 2
Figure 2. Increased glucose carbon contribution to the TCA in autochthonous K-ras driven lung tumors and xenografted lung cancer cells compared to adjacent lung
(A) Enrichment of fully labeled glucose (M6) in plasma from mice after a 6-hour [U-13C]glucose infusion. (LA2, n = 4; KP, n = 6; KPS, n = 5). (B) Schematic showing major isotopomer transitions from glucose to label glycolytic and TCA cycle intermediates. The dominant TCA cycle isotopomers derived from the oxidation of glucose-derived pyruvate by the PDH complex has two labels (as shown in red for citrate), while the dominant isotopomer derived from pyruvate carboxylase (PC) retains three labeled carbon (as shown in blue for aspartate). (C, D) The percent M3 labeled pyruvate and lactate in lung (black) and lung tumors (blue) from mice following a 6-hour [U-13C]glucose infusion. (LA2, n = 4; KP, n = 6; KPS, n = 5). (E–H) The percent labeling of citrate, aspartate, glutamate, and glutamine in lung (black) and lung tumors (blue) from mice following a 6-hour [U-13C]glucose infusion. The M2, M3 and M4 isotopomers are shown for each metabolite. (LA2, n = 4; KP, n = 6; KPS, n = 5 for tumor and adjacent lung). For all panels, values represent the mean ± SEM. * Difference is statistically significant by two-tailed paired T-test, * p < 0.05. (I, J) The percent labeling of citrate and aspartate in normal lung (black) and xenografts derived from H1975 cells (EGFR-driven human lung cancer cells, green) or A549 cells (KRAS-driven human lung cancer cells, blue) from mice following a 6-hour [U-13C]glucose infusion. The M2, M3 and M4 isotopomers are shown for each metabolite. (Lung, n = 8; H1975 tumor, n = 8; A549 tumor n = 8). For all panels, values represent the mean ± SEM. * Difference is statistically significant by two-tailed paired T-test, * p < 0.05 or ** p < 0.01.
Figure 3
Figure 3. Glutamine carbon contributes minimally to the TCA cycle in K-ras driven lung tumors and adjacent lung
(A) Enrichment of fully labeled glutamine (M5) in plasma from mice following 6-hour [U-13C]glutamine infusion. (LA2, n = 4; KP, n = 4; KPS, n = 4). (B) Schematic showing major isotopomer transitions from glutamine to label TCA cycle intermediates. The dominant TCA cycle isotopomers produced by oxidative of glutamine metabolism have 4 labeled carbons for all species shown (red circles), while the dominant isotopomer of citrate from reductive glutamine metabolism is M5 (grey circles). (C) The percent M5 labeled glutamate and glutamine in lung (black) and lung tumors (red) from mice following 6-hour [U-13C]glutamine infusion. (LA2, n = 4; KP, n = 4; KPS, n = 4). (D) The percent M4 labeling of aspartate (Asp), citrate (Cit), fumarate (Fum), malate (Mal) and succinate (Suc) in the lung (black) and lung tumors (red) from mice following 6-hour [U-13C]glutamine infusion. (LA2, n = 4; KP, n = 4; KPS, n = 4). (E) Western blot analysis of phospho-pyruvate dehydrogenase subunit E1α (p-PDHE1α), total PDHE1α (PDHE1α), pyruvate carboxylase (Pcx), and glutaminase (Gls1) expression in three representative KP lung tumors (Tumor) and normal lung tissue from three mice (Lung). Vinculin expression was also assessed in all samples as a loading control. (F) The percent labeling of aspartate (Asp), citrate (Cit), fumarate (Fum), and malate (Mal) in tumor tissue from the indicated models after a 6 hour infusion of [U-13C]glucose and [U-13C]glutamine. Values were normalized to plasma enrichment of glucose or glutamine to allow comparison of the indicated isotopomers. (For [U-13C]glucose infusions, LA2, n = 4; KP, n = 6; KPS, n = 5. For [U-13C]glutamine infusions, LA2, n = 4; KP, n = 4; KPS, n = 4). For all panels, values represent the mean ± SEM. *Difference is statistically significant by two-tailed paired T-test, p < 0.05.
Figure 4
Figure 4. Metabolism of glucose and glutamine by cell lines derived from KP lung tumors
(A) Rate of glucose consumption and lactate excretion by two independently derived lung cancer cell lines from KP lung tumors (Line 1 and Line 2), n = 3. (B) Absolute fluxes downstream of pyruvate calculated from glucose and glutamine 13C labeling data in the lung cancer cell lines derived from KP lung tumors. The values shown for each flux are fmol/cell/hr, and the arrows indicating each flux are to scale. (C) The percent M5 labeled glutamate and glutamine from [U-13C]glutamine in the lung cancer cell lines derived from KP lung tumors, n = 3. (D) The percent M4 labeled aspartate, fumarate and malate from [U-13C]glutamine in the lung cancer cell lines derived from KP lung tumors, n = 3. (E) Equal numbers of the lung cancer cell lines derived from KP mice were placed in media containing the indicated concentration of glutamine. Relative cell numbers present after 24 and 48 hours are shown, n=3. (F) Equal numbers of the lung cancer cell lines derived from KP mice were plated, and then cultured in the presence of vehicle alone (DMSO) or the indicated concentration of CB-839, a glutaminase inhibitor. Relative cell numbers present at the time of vehicle or CB-839 addition or after 24 or 48 hours of exposure are shown, n=3. For all panels, values represent mean ± SD, * denotes difference is statistically significant by two-tailed T-test, p < 0.05.
Figure 5
Figure 5. KP-lung tumors are not dependent on high glutaminase activity
(A) Coronal μCT scan sections showing the lungs of mice prior to treatment, and after treatment for 4 weeks with vehicle or the glutaminase inhibitor CB-839 treated mice. The images are representative of those obtained from 5 vehicle- and 6 CB-839-treated mice after 4 weeks of CB-839 treatment. (B) Concentration of glutaminase inhibitor CB-839 in plasma and tumor, with each circle representing a value in a single animal. The mean value and SD are also shown. (C) Ki-67 staining of lung tumor sections obtained from KP mice treated with vehicle or CB-839 for 4 weeks. The staining shown is representative of that observed in tissue from 5 vehicle- and 6 CB-839-treated mice. Scale bar: 200μM. (D) Quantification of Ki-67 staining in KP lung tumor sections obtained from mice treated with vehicle or CB-839 for 4 weeks. Each point represents data from an independently derived tumor, and the mean +/− SEM is indicated as are the % tumors graded histologically as grade 1&2 or 3&4. (E) Representative immunohistochemical staining of Cleaved-Caspase 3 (CC3) in vehicle versus CB-839 treated mice. Scale bars indicate 200μM. (F) Relative concentration of glutamate to glutamine in tumors from KP mice treated with vehicle or glutaminase inhibitor for 4 weeks. (G) The percent M5 labeled glutamine and glutamate in lung tumors from KP mice infused for 6-hours with [U-13C]glutamine. Animals were treated for 4 weeks with vehicle or CB-839 as indicated. Each point represents data from an independently derived tumor, and the mean +/− SEM is indicated. (H) Short guide RNA sequences to disrupt Gls1 or a non-targeted control were delivered along with Cas9 and Cre recombinase to induce KP lung tumors. Representative IHC images examining Gls1 expression in tumors arising in mice exposed to control sgRNAs, or sgRNAs that target Gls1 is shown. Scale bar: 200μM. *Difference is statistically significant by two-tailed T-test, p < 0.05.
Figure 6
Figure 6. Lung cancer cells require Pdha1 for tumor formation in vivo
(A) sgRNAs targeting Pdha1 or control were introduced into lung cancer cells derived from KP lung tumor. Proliferation of control and Pdha1 disrupted cells in culture is shown (n=3), as is a Western blot analysis showing Pdha1 expression from isogenic clones. (B) The same cells described in (A) were cultured in the presence of [U-13C]glucose. Percent labeling of citrate isotopomers is shown for Control and Pdha1-disrupted cell lines. The percent M2 isotopomer of citrate that can be generated from glucose via flux through Pdha1 is also presented in blue, and percent labeling of other isotopomers of citrate displayed, n = 3. (C) The same cells described in (A) were introduced as allografts into the flanks nu/nu mice. Tumor growth over time is shown. n = 4/cell line. (D) The same cells described in (A) were introduced as allografts into the flanks of mice. The percent labeling of aspartate (Asp), citrate (Cit), glutamate (Glu), and glutamine (Glu) in lung tumors derived from control cells (black) or material present at the injection site from Pdha1-disrupted cells (blue) was determined following a 6-hour [U-13C]glucose infusion. The M0 and M2 isotopomers are shown for each metabolite. All values in mean ± SEM. *Difference is statistically significant by two-tailed T-test, p < 0.05. (E) The same cells described in (A) were introduced as allografts into the flanks of nu/nu mice. Immunohistochemistry assessing Pdha1 expression in lung tumors derived from control cells or material present at the injection site from Pdha1-disrupted cells is shown. Scale bar: 200μM. (F) Representative H&E staining of the same cells described in (A) 4 weeks after orthotopic transplantation into the lungs of nu/nu mice. Scale bar: 200μM. (G) Representative immunohistochemical staining for Pdha1 in tumors arising in KP mice infected with pSECC containing a control sgRNA (Control) or sgPdha1 (n = 25 tumors from ctrl and 18 tumors from sgPdha1 from 3 mice analyzed, all tumors retained Pdha1 expression). Scale bar indicates 200μm.
Figure 7
Figure 7. Lung cancer cells require Pcx for tumor formation in vivo
(A) sgRNAs targeting Pcx or control were introduced into lung cancer cells derived from KP lung tumor. Proliferation of control and Pcx disrupted cells in culture is shown (n=3), as is a Western blot analysis showing Pcx expression from isogenic clones. (B) The same cells described in (A) were cultured in the presence of [U-13C]glucose. Percent labeling of aspartate isotopomers is shown for Control and Pcx-disrupted cell lines. The percent M3 isotopomer of aspartate that can be generated from glucose via flux through Pcx is also presented in green, and percent labeling of other isotopomers of aspartate displayed, n = 3. (C) The same cells described in (A) were introduced as allografts into the flanks of nu/nu mice. Immunohistochemistry assessing Pcx expression in lung tumors derived from control cells or material present at the injection site from Pcx-disrupted cells is shown. (D) The same cells described in (A) were introduced as allografts into the flanks of mice. The percent labeling of aspartate (Asp), citrate (Cit), glutamate (Glu), and glutamine (Glu) in lung tumors derived from control cells (black) or material present at the injection site from Pcx-disrupted cells (green) was determined following a 6-hour [U-13C]glucose infusion. The M0 and M3 isotopomers are shown for each metabolite. All values in mean ± SEM. *Difference is statistically significant by two-tailed T-test, p < 0.05. (E) The same cells described in (A) were introduced as allografts into the flanks of nu/nu mice. Immunohistochemistry assessing Pcx expression in lung tumors derived from control cells or material present at the injection site from Pcx-disrupted cells is shown. Scale bar: 200μM. (F) Representative H&E staining of the same cells described in (A) 4 weeks after orthotopic transplantation into the lungs of mice. Scale bar: 200μM. (G) Representative hematoxylin and eosin staining of KP mice infected with pSECC containing a control sgRNA (Control) and sgPcx (n = 4 mice analyzed, no tumors were observed in the sgPcx mice). Scale bar indicates 2mm.

Comment in

References

    1. Avanesov AS, Ma S, Pierce KA, Yim SH, Lee BC, Clish CB, Gladyshev VN. Age- and diet-associated metabolome remodeling characterizes the aging process driven by damage accumulation. Elife. 2014:e02077–e02077. - PMC - PubMed
    1. Ayala JE, Samuel VT, Morton GJ, Obici S, Croniger CM, Shulman GI, Wasserman DH, McGuinness OP Consortium NMMPC. Standard operating procedures for describing and performing metabolic tests of glucose homeostasis in mice. Dis Model Mech. 2010:525–534. - PMC - PubMed
    1. Bonnet S, Archer SL, Allalunis-Turner J, Haromy A, Beaulieu C, Thompson R, Lee CT, Lopaschuk GD, Puttagunta L, Bonnet S, et al. A Mitochondria-K+ Channel Axis Is Suppressed in Cancer and Its Normalization Promotes Apoptosis and Inhibits Cancer Growth. Cancer Cell. 2007:37–51. - PubMed
    1. Cairns RA, Harris IS, Mak TW. Regulation of cancer cell metabolism. Nature Reviews Cancer. 2011:85–95. - PubMed
    1. Cheng T, Sudderth J, Yang C. Pyruvate carboxylase is required for glutamine-independent growth of tumor cells (PNAS) 2011 - PMC - PubMed

Publication types

MeSH terms