. 2016 Apr;37(4):1361-74.
doi: 10.1002/hbm.23107. Epub 2016 Feb 8.

Abnormal salience signaling in schizophrenia: The role of integrative beta oscillations

Affiliations

Abnormal salience signaling in schizophrenia: The role of integrative beta oscillations

Elizabeth B Liddle et al. Hum Brain Mapp. 2016 Apr.

Abstract

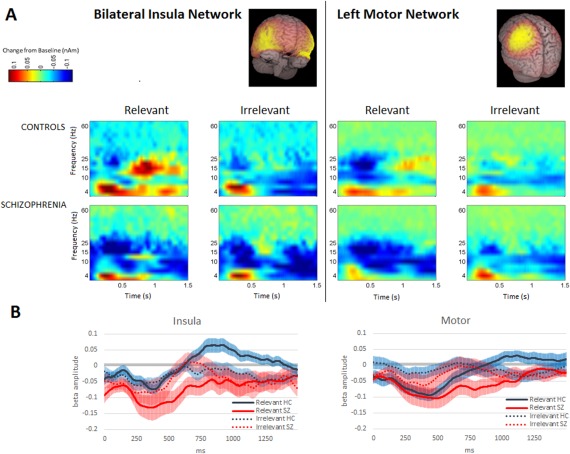
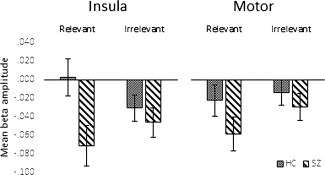
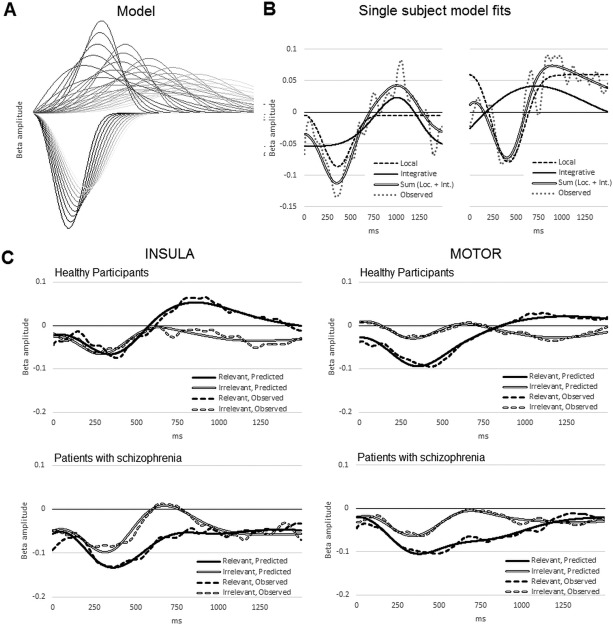
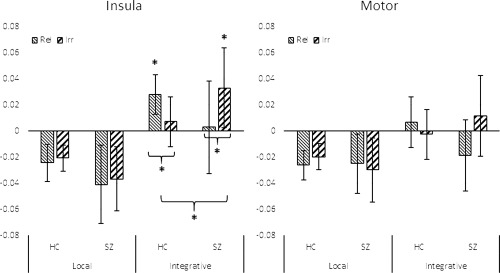
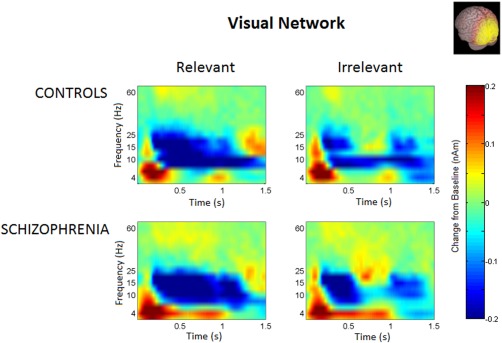
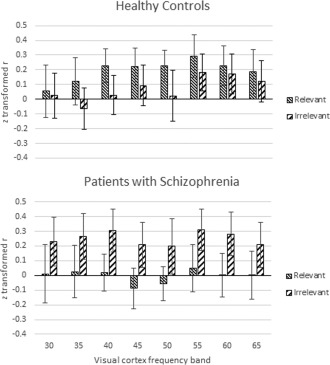
Aberrant salience attribution and cerebral dysconnectivity both have strong evidential support as core dysfunctions in schizophrenia. Aberrant salience arising from an excess of dopamine activity has been implicated in delusions and hallucinations, exaggerating the significance of everyday occurrences and thus leading to perceptual distortions and delusional causal inferences. Meanwhile, abnormalities in key nodes of a salience brain network have been implicated in other characteristic symptoms, including the disorganization and impoverishment of mental activity. A substantial body of literature reports disruption to brain network connectivity in schizophrenia. Electrical oscillations likely play a key role in the coordination of brain activity at spatially remote sites, and evidence implicates beta band oscillations in long-range integrative processes. We used magnetoencephalography and a task designed to disambiguate responses to relevant from irrelevant stimuli to investigate beta oscillations in nodes of a network implicated in salience detection and previously shown to be structurally and functionally abnormal in schizophrenia. Healthy participants, as expected, produced an enhanced beta synchronization to behaviorally relevant, as compared to irrelevant, stimuli, while patients with schizophrenia showed the reverse pattern: a greater beta synchronization in response to irrelevant than to relevant stimuli. These findings not only support both the aberrant salience and disconnectivity hypotheses, but indicate a common mechanism that allows us to integrate them into a single framework for understanding schizophrenia in terms of disrupted recruitment of contextually appropriate brain networks.

Keywords: attention; electrophysiology; magnetoencephalography; neuroimaging; schizophrenia.


Figures

Figure 1
Figure 1
(A) Time frequency difference spectrograms representing oscillatory activity (relative to resting baseline) for the 2 s following presentation of a stimulus, for each network, group, and relevance condition. Time is on the horizontal axis, 0 corresponds to the stimulus presentation, and stimulus duration was 800 ms. Frequency is plotted on the vertical axis. Healthy participants, during relevant trials, show a marked period of beta ERS extending to a level above resting baseline in the insula network after a brief period of beta ERD; in the motor network during relevant trials, a similar pattern is observed. These effects are attenuated in irrelevant trials. Patients, in both networks, during both relevant and irrelevant conditions, show more conspicuous and prolonged beta ERD, and the suprabaseline insula ERS effect visible in controls in relevant trials appears to be absent. (B) Mean change from resting baseline of oscillatory amplitude in the beta‐band (13–30 Hz) in each network during the first 1500 ms of each trial. Controls are shown as a solid black line, patients as a red line (white in the print edition). Relevant trials are indicated by a solid line, irrelevant by a dotted line; standard errors are shown as transparent colored borders. [Color figure can be viewed in the online issue, which is available at http://wileyonlinelibrary.com.]
Figure 2
Figure 2
Mean beta amplitude values averaged across all time bins for each condition in each network, for each group. A significant Group × Relevance interaction in the insula indicated that the patients with schizophrenia showed a less marked modulation by relevance than healthy controls, showing marked mean beta desynchronization in both conditions, while a significant Group × Relevance × Network indicated that this effect of diagnosis was significantly less marked in the motor network. Error bars represent 95% confidence intervals.
Figure 3
Figure 3
(A) Samples from the series of Weibull distributions used to fit each participant's data. Downward deflecting curves represent desynchronization of local beta, the upward deflecting curves represent integrative beta. (B) Examples of a fitted model for two participants. The dashed curves represent the fitted local beta model, and the solid curves the fitted integrative beta model. The summed curves are indicated by a double line and the participant's observed data as a dotted line. The left‐most example shows a fitted integrative beta curve with a fairly long latency and narrow width; the right‐most example shows a fitted integrative beta curve with shorter peak latency and larger width. Both sum to form the characteristic beta ERD–ERS biphasic pattern. (C) Mean fitted curves for each group, in each condition, in each network. Mean model curves are shown as continuous lines, the mean observed data as a dashed line.
Figure 4
Figure 4
Effects of integrative beta (AUC) by network, condition, and group. Statistically significant contrasts (p < 0.05) are shown by an asterisk; error bars represent 95% confidence intervals. In the insula, healthy control participants showed integrative beta values that were significantly greater in the relevant condition than in the irrelevant condition, and significantly greater than zero. Patients actually showed a reversal of this pattern, showing significantly greater integrative beta in the irrelevant than relevant condition. The Group × Relevance contrast was also statistically significant. This was reflected in the motor network as a trend, but did not reach statistical significance. There were no significant effects of group or relevance on local beta.
Figure 5
Figure 5
Time frequency spectrograms for the visual network, by group, and relevance condition. [Color figure can be viewed in the online issue, which is available at http://wileyonlinelibrary.com.]
Figure 6
Figure 6
Correlations between insula integrative beta and visual gamma. The height of the bars shows the mean z‐transformed correlation between the inferred insula integrative beta signal and 8 overlapping gamma band oscillations from primary visual cortex, centered on the frequencies shown. Error bars are standard errors. Overall, the correlations were significantly positive, with correlations for relevant trials in the healthy group being statistically significant at p = 0.008.

References

    1. Allen EA, Liu J, Kiehl KA, Gelernter J, Pearlson GD, Perrone‐Bizzozero NI, Calhoun VD (2011): Components of cross‐frequency modulation in health and disease. Front Syst Neurosci 5:59. - PMC - PubMed
    1. American Psychiatric Association (1994): Diagnostic and Statistical Manual of Mental Disorders 4th ed. Washington, DC: American Psychiatric Association.
    1. Ammons RB, Ammons CH (1962): The Quick Test (QT): Provisional manual. Psychol Rep 11:111–161.
    1. Augustine JR (1996): Circuitry and functional aspects of the insular lobe in primates including humans. Brain Res Rev 22:229–244. - PubMed
    1. Baker AP, Brookes MJ, Rezek IA, Smith SM, Behrens T, Smith PJP, Woolrich M (2014): Fast transient networks in spontaneous human brain activity. eLife 3:e01867. - PMC - PubMed

Publication types