

Dietary fat composition influences glomerular and proximal convoluted tubule cell structure and autophagic processes in kidneys from calorie-restricted mice
- PMID: 26853994
- PMCID: PMC4854917
- DOI: 10.1111/acel.12451
Dietary fat composition influences glomerular and proximal convoluted tubule cell structure and autophagic processes in kidneys from calorie-restricted mice
Abstract
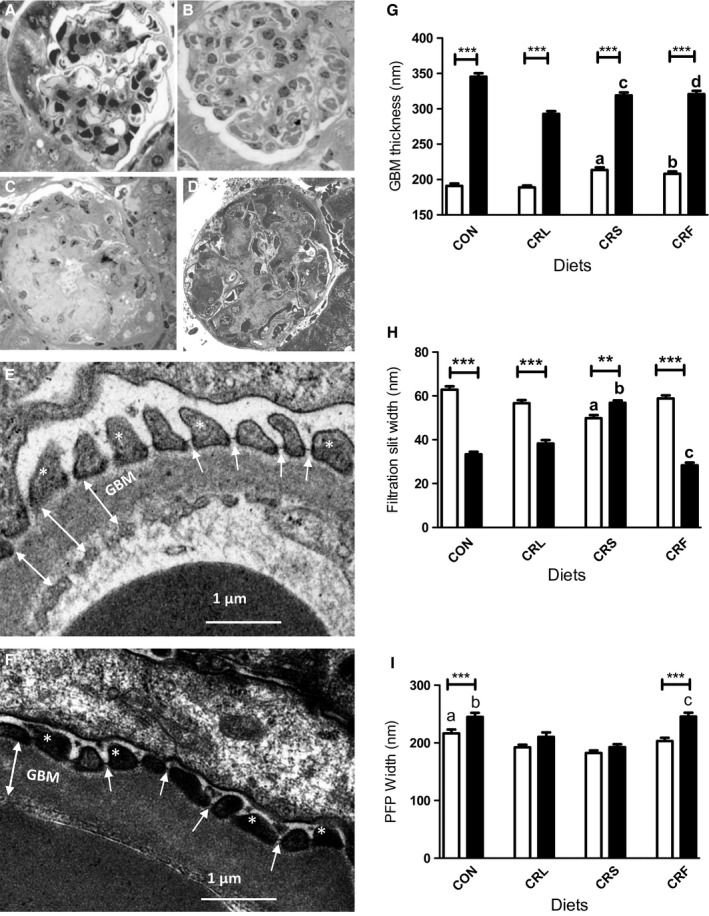
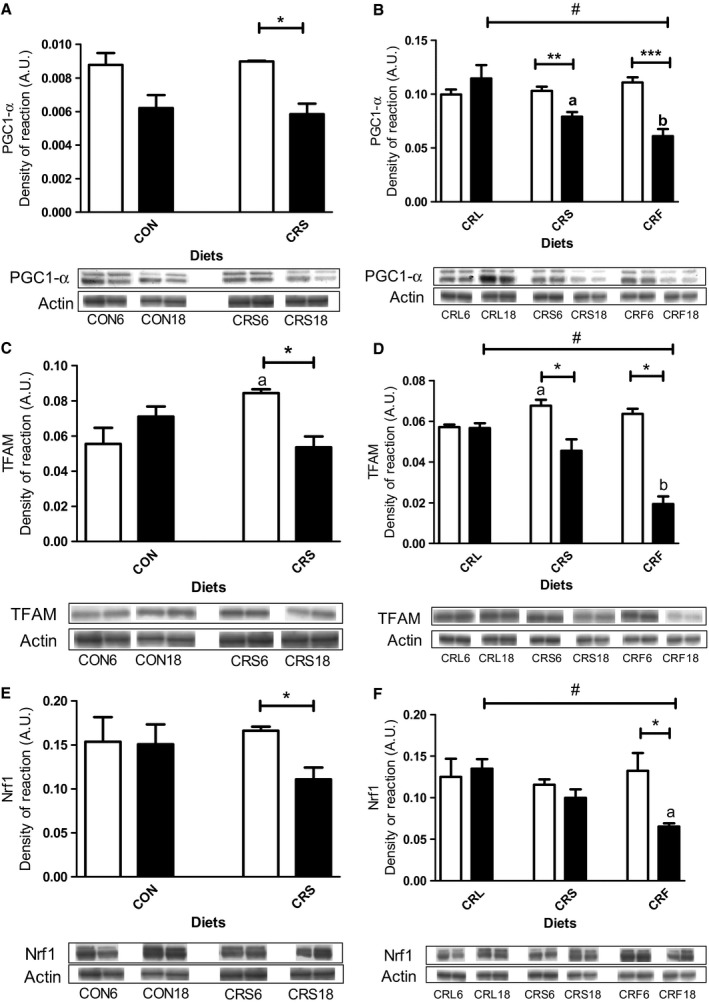
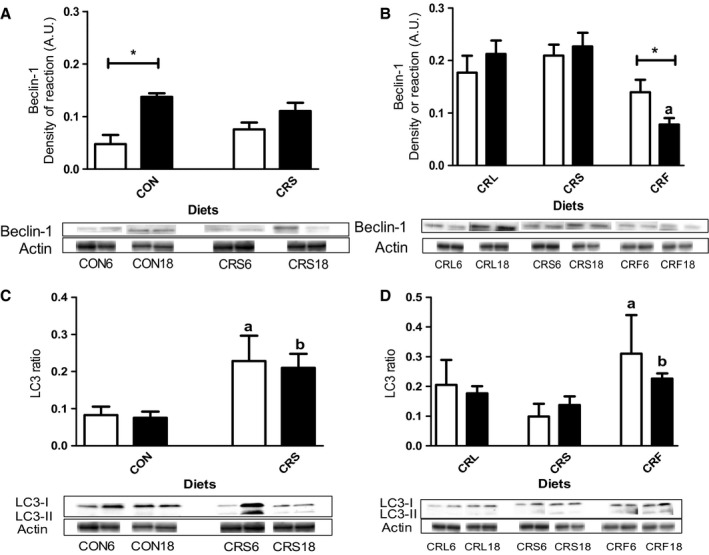
Calorie restriction (CR) has been repeatedly shown to prevent cancer, diabetes, hypertension, and other age-related diseases in a wide range of animals, including non-human primates and humans. In rodents, CR also increases lifespan and is a powerful tool for studying the aging process. Recently, it has been reported in mice that dietary fat plays an important role in determining lifespan extension with 40% CR. In these conditions, animals fed lard as dietary fat showed an increased longevity compared with mice fed soybean or fish oils. In this paper, we study the effect of these dietary fats on structural and physiological parameters of kidney from mice maintained on 40% CR for 6 and 18 months. Analyses were performed using quantitative electron microcopy techniques and protein expression in Western blots. CR mitigated most of the analyzed age-related parameters in kidney, such as glomerular basement membrane thickness, mitochondrial mass in convoluted proximal tubules and autophagic markers in renal homogenates. The lard group showed improved preservation of several renal structures with aging when compared to the other CR diet groups. These results indicate that dietary fat modulates renal structure and function in CR mice and plays an essential role in the determination of health span in rodents.
Keywords: aging; calorie restriction; dietary fat; kidney; mice.
© 2016 The Authors. Aging Cell published by the Anatomical Society and John Wiley & Sons Ltd.
Figures


Similar articles
-
The Impact of Aging, Calorie Restriction and Dietary Fat on Autophagy Markers and Mitochondrial Ultrastructure and Dynamics in Mouse Skeletal Muscle.J Gerontol A Biol Sci Med Sci. 2019 May 16;74(6):760-769. doi: 10.1093/gerona/gly161. J Gerontol A Biol Sci Med Sci. 2019. PMID: 30010806 Free PMC article.
-
Mitochondrial ultrastructure and markers of dynamics in hepatocytes from aged, calorie restricted mice fed with different dietary fats.Exp Gerontol. 2014 Aug;56:77-88. doi: 10.1016/j.exger.2014.03.023. Epub 2014 Apr 4. Exp Gerontol. 2014. PMID: 24704714 Free PMC article.
-
The Influence of Dietary Fat Source on Life Span in Calorie Restricted Mice.J Gerontol A Biol Sci Med Sci. 2015 Oct;70(10):1181-8. doi: 10.1093/gerona/glu177. Epub 2014 Oct 13. J Gerontol A Biol Sci Med Sci. 2015. PMID: 25313149 Free PMC article.
-
The influence of dietary fat source on liver and skeletal muscle mitochondrial modifications and lifespan changes in calorie-restricted mice.Biogerontology. 2015 Oct;16(5):655-70. doi: 10.1007/s10522-015-9572-1. Epub 2015 Apr 10. Biogerontology. 2015. PMID: 25860863 Free PMC article. Review.
-
Progress in nutritional immunology.Immunol Res. 2008;40(3):244-61. doi: 10.1007/s12026-007-0021-3. Immunol Res. 2008. PMID: 18253705 Review.
Cited by
-
MMP2-A2M interaction increases ECM accumulation in aged rat kidney and its modulation by calorie restriction.Oncotarget. 2017 Dec 24;9(5):5588-5599. doi: 10.18632/oncotarget.23652. eCollection 2018 Jan 19. Oncotarget. 2017. PMID: 29464020 Free PMC article.
-
Cytochrome b5 reductase 3 overexpression and dietary nicotinamide riboside supplementation promote distinctive mitochondrial alterations in distal convoluted tubules of mouse kidneys during aging.Aging Cell. 2024 Nov;23(11):e14273. doi: 10.1111/acel.14273. Epub 2024 Jul 12. Aging Cell. 2024. PMID: 39001573 Free PMC article.
-
A model of mitochondrial O2 consumption and ATP generation in rat proximal tubule cells.Am J Physiol Renal Physiol. 2020 Jan 1;318(1):F248-F259. doi: 10.1152/ajprenal.00330.2019. Epub 2019 Dec 2. Am J Physiol Renal Physiol. 2020. PMID: 31790302 Free PMC article.
-
Calorie Restriction Protects against Contrast-Induced Nephropathy via SIRT1/GPX4 Activation.Oxid Med Cell Longev. 2021 Oct 19;2021:2999296. doi: 10.1155/2021/2999296. eCollection 2021. Oxid Med Cell Longev. 2021. PMID: 34712381 Free PMC article.
-
Anti-inflammatory action of β-hydroxybutyrate via modulation of PGC-1α and FoxO1, mimicking calorie restriction.Aging (Albany NY). 2019 Feb 27;11(4):1283-1304. doi: 10.18632/aging.101838. Aging (Albany NY). 2019. PMID: 30811347 Free PMC article.
References
-
- Bolignano D, Mattace‐Raso F, Sijbrands EJ, Zoccali C (2014) The aging kidney revisited: a systematic review. Ageing Res. Rev. 14, 65–80. - PubMed
-
- Brunk UT, Terman A (2002) The mitochondrial‐lysosomal axis theory of aging: accumulation of damaged mitochondria as a result of imperfect autophagocytosis. Eur. J. Biochem. 269, 1996–2002. - PubMed
Publication types
MeSH terms
Substances
Grants and funding
LinkOut - more resources
Full Text Sources
Other Literature Sources
Medical
