. 2016 Feb 8:6:20395.
doi: 10.1038/srep20395.

Extracellular matrix stiffness dictates Wnt expression through integrin pathway

Affiliations

Extracellular matrix stiffness dictates Wnt expression through integrin pathway

Jing Du et al. Sci Rep. .

Abstract

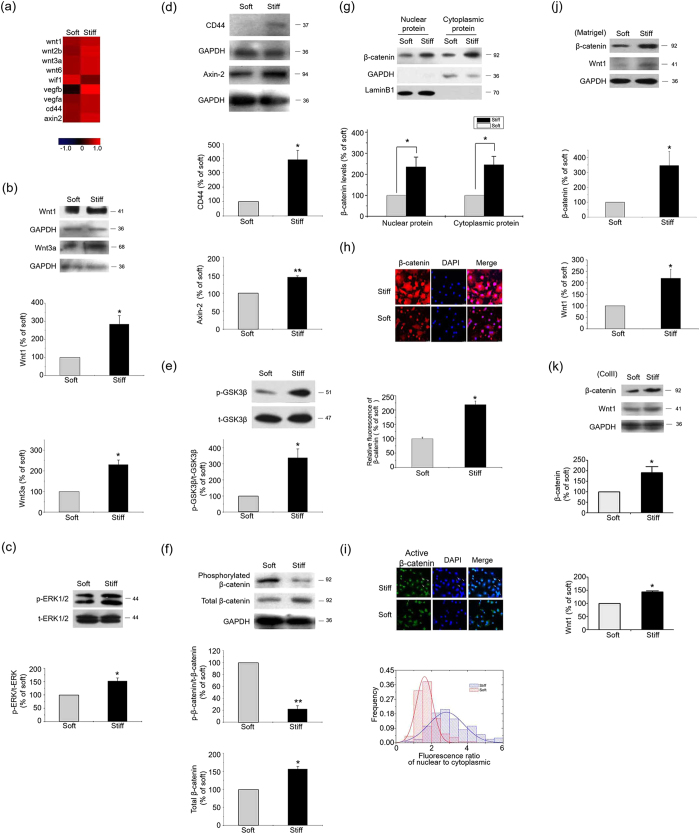
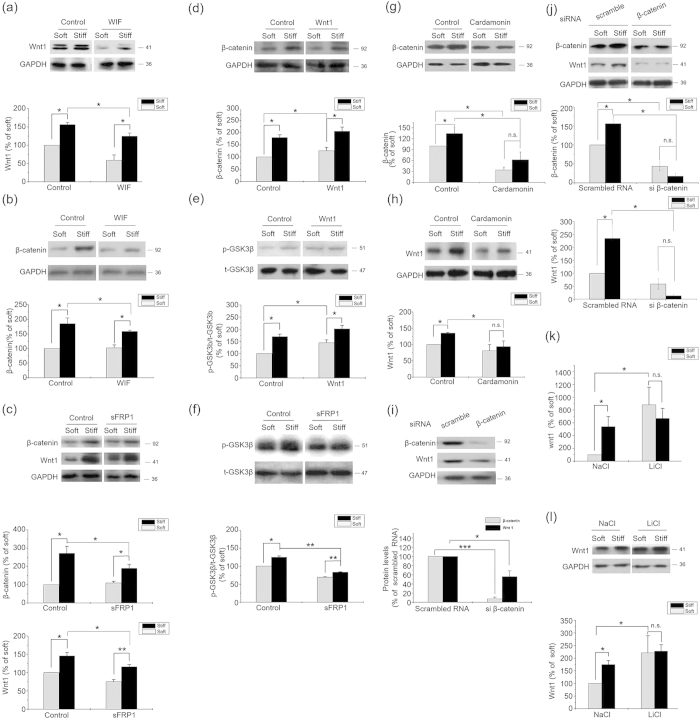
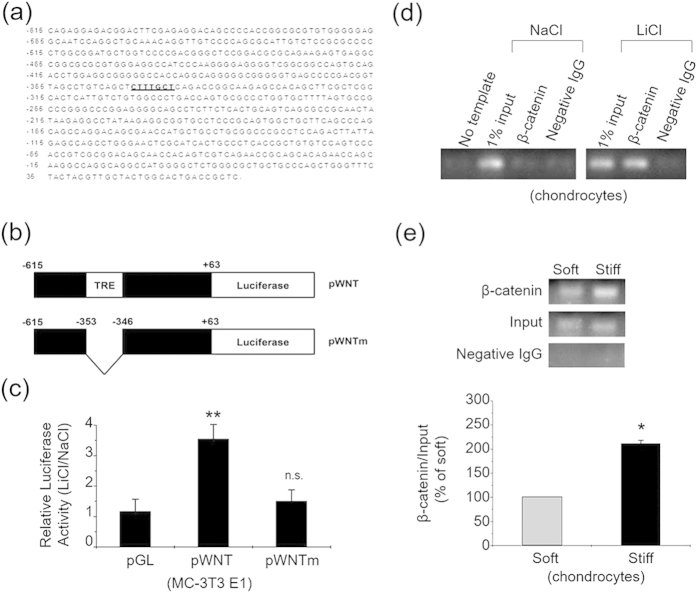
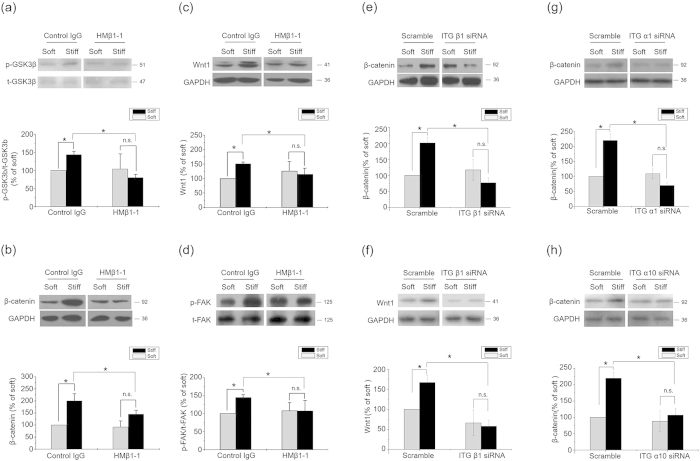
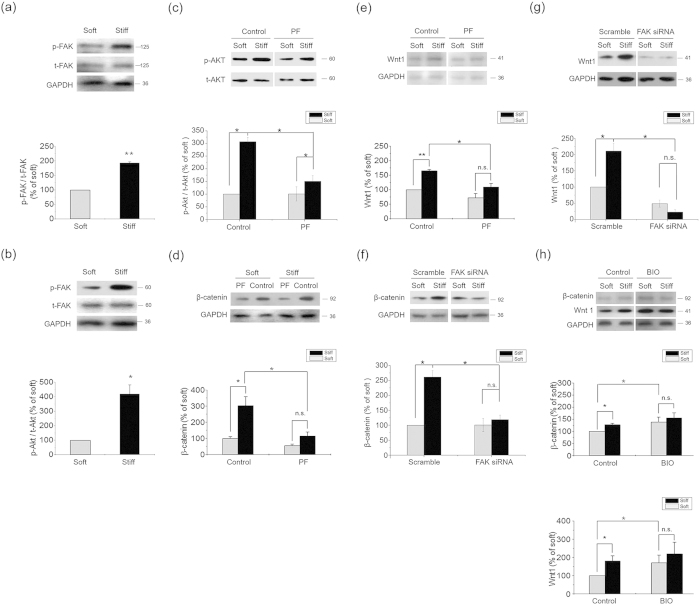
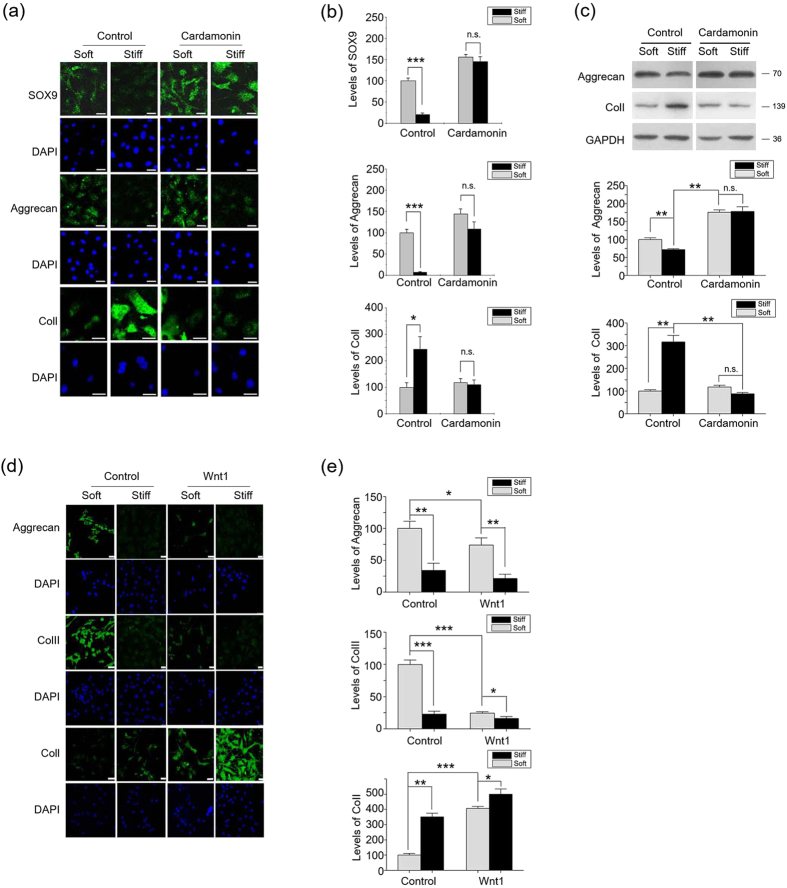
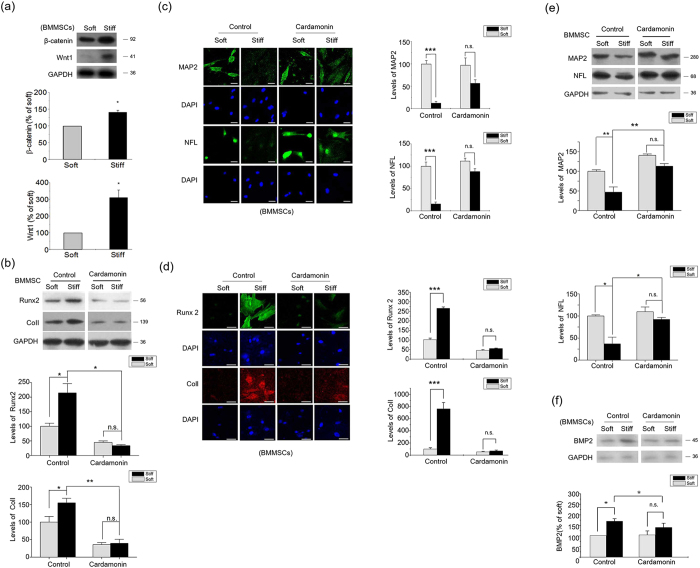
It is well established that extracellular matrix (ECM) stiffness plays a significant role in regulating the phenotypes and behaviors of many cell types. However, the mechanism underlying the sensing of mechanical cues and subsequent elasticity-triggered pathways remains largely unknown. We observed that stiff ECM significantly enhanced the expression level of several members of the Wnt/β-catenin pathway in both bone marrow mesenchymal stem cells and primary chondrocytes. The activation of β-catenin by stiff ECM is not dependent on Wnt signals but is elevated by the activation of integrin/ focal adhesion kinase (FAK) pathway. The accumulated β-catenin then bound to the wnt1 promoter region to up-regulate the gene transcription, thus constituting a positive feedback of the Wnt/β-catenin pathway. With the amplifying effect of positive feedback, this integrin-activated β-catenin/Wnt pathway plays significant roles in mediating the enhancement of Wnt signal on stiff ECM and contributes to the regulation of mesenchymal stem cell differentiation and primary chondrocyte phenotype maintenance. The present integrin-regulated Wnt1 expression and signaling contributes to the understanding of the molecular mechanisms underlying the regulation of cell behaviors by ECM elasticity.


Figures

Figure 1
Figure 1. Wnt/β-catenin pathway was activated by the stiff ECM.
Results from primary chondrocytes 48 hr after seeding on stiff (100 kPa) or soft (0.5–1 kPa) ECM. (a) Microarray profiling of Wnt/β-catenin pathway transcripts. Results are normalized by median scaling using Rosetta Resolver System software. (b) Wnt1 and Wnt3a levels were analyzed by western blotting. (c) Total and phosphorylated ERK1/2 levels were analyzed by western blotting. (d) Axin2, CD44, and (e) phosphorylated GSK3β levels were analyzed by western blotting. (f) Total and phosphorylated β−catenin levels were analyzed by western blotting. (g) β−catenin levels in nucleus and cytoplasm were analyzed by western blotting. (h) Total and (i) activated β-catenin levels and distribution in chondrocytes 2 hr after seeding on stiff or soft ECM were analyzed by in situ fluorescence staining. (j) β-catenin and wnt1 levels in chondrocytes 48 hr after seeding on the Matrigel-coated PAAM were analyzed by western blotting. (k) β-catenin and wnt1 levels in chondrocytes 48 hr after seeding on the ColII-coated PAAM were analyzed by western blotting. Western results were from 3 independent experiments for each individual protein, with blots exemplifying one experiment and the bar graphs showing the combined results of 3 experiments on stiff matrix expressed as percentages (mean ± SEM) of the corresponding results on the soft matrix. GAPDH was used to normalize for equal loading. *P < 0.05, **P < 0.01. n.s. stands for not statistically significant.
Figure 2
Figure 2. ECM stiffness regulated β-catenin accumulation independently with Wnt signals.
Results from primary chondrocytes 48 hr after seeding on stiff (100 kPa) or soft (0.5–1 kPa) ECM. (a) Wnt1 and (b) β-catenin levels in the presence of WIF-1 (1 μg/ml) or solvent were analyzed by western blotting. (c) Total β-catenin and wnt1 levels in the presence of sFRP1 (1 μg/ml) or solvent were analyzed by western blotting. (d) Total β-catenin and (e) phosphorylated GSK3β levels in the presence of Wnt1 (100 ng/ml) or solvent were analyzed by western blotting. (f) Phosphorylated GSK3β levels in the presence of sFRP1 (1 μg/ml) or solvent were analyzed by western blotting. (g) β-catenin and (h) Wnt1 levels in chondrocytes treated with 10 μM Cardamonin or DMSO were analyzed by western blotting. (i) β-catenin and Wnt1 levels in chondrocytes transfected by β−catenin siRNA or scrambled siRNA on normal plates and (j) on stiff or soft ECM. (k) Wnt1 mRNA levels in chondrocytes treated with NaCl or LiCl (20 mmol/L) were analyzed by Real-time PCR. (l)Wnt1 levels in chondrocytes treated with NaCl or LiCl (20 mmol/L) were analyzed by western blotting. Western results were from 3 independent experiments (except 5 in b and i, 6 in j), with blots exemplifying one experiment and the bar graphs showing the combined results of 5 experiments as percentages (mean ± SEM) of the corresponding results on soft matrix. GAPDH was used to normalize for equal loading in western blotting. *P < 0.05, **P < 0.01, n.s. stands for not statistically significant.
Figure 3
Figure 3. A novel feedback control mechanism of Wnt/β-catenin pathway.
(a) Upstream sequence of mouse wnt1 gene. Putative TRE is shaded. (b) Construct map of the luciferase reporter constructs used in luciferase activity assays. Constructs contain various portions of mouse wnt1 gene upstream sequence, as indicated. The putative TRE is denoted by a shaded box. (c) MC-3T3 cells were transfected with the reporter constructs pWNT, pWNTm and the control construct pGL3-Basic (pGL). The cells were then treated with either 20 mM LiCl or NaCl. Bar graph shows the results (mean ± SEM) on luciferase activities for transfection with control plasmid (pGL), pWNT or pWNTm, with 3 experiments in each group. (d) Primary chondrocytes were treated with 20 mM LiCl or NaCl for 24 hr, and then ChIP assays were performed. No template: PCR amplification without DNA sample; 1% input: samples representing total input chromatin (1%) for each experiment; negative IgG: immunoprecipitated with negative IgG instead of β-catenin antibody. (e) Primary chondrocytes cultured on the stiff or soft ECM for 24 hr were subjected to quantitative ChIP assays. ChIP results were from 3 independent experiments, and the bar graphs showing the combined results of 3 experiments on the stiff matrix as percentages (mean ± SEM) of the corresponding results on the soft matrix. *P < 0.05, **P < 0.01, n.s. stands for not statistically significant.
Figure 4
Figure 4. ECM regulated β-catenin pathway and Wnt expression by Integrins.
Results from primary chondrocytes 48 hr after seeding on stiff (100 kPa) or soft (0.5–1 kPa) ECM. (a) Phosphorylated GSK3β levels, (b) β-catenin and (c) Wnt1 levels in the presence of 20 μg/ml β1 integrin blocking antibody or control antibody were analyzed by western blotting. (d) Phosphorylated FAK levels in the presence of 20 μg/ml β1 integrin blocking antibody or control antibody were analyzed by western blotting. (e) β-catenin and (f) Wnt1 levels in the presence of integrin β1 siRNA or scramble were analyzed by western blotting. (g) β-catenin in the presence of integrin α1 siRNA or scramble were analyzed by western blotting. (h) β-catenin levels in chondrocytes 48 hr after seeding on stiff or soft ECM in the presence of integrin α10 siRNA or scramble were analyzed by western blotting. Western results were from 3 independent experiments (except 4 in b, 6 in c), with blots exemplifying one experiment and the bar graphs showing the combined results on stiff matrix expressed as percentages (mean ± SEM) of the corresponding results on soft matrix. GAPDH was used to normalize for equal loading in western blotting. *P < 0.05, **P < 0.01, n.s. stands for not statistically significant.
Figure 5
Figure 5. ECM stiffness regulated β-catenin accumulation via integrin/FAK/Akt pathway.
Results from primary chondrocytes 48 hr after seeding on stiff (100 kPa) or soft (0.5–1 kPa) ECM. (a) Phosphorylated FAK and (b) Phosphorylated Akt levels were analyzed by western blotting. (c) Phosphorylated Akt levels in the presence of 1 μM PF573228 or DMSO were analyzed by western blotting. (d) β-catenin and (e) Wnt1 levels in the presence of 1 μM PF573228 or DMSO were analyzed by western blotting. (f) β-catenin and (g) Wnt1 levels in the presence of FAK siRNA or scramble were analyzed by western blotting. (h) Total β-catenin and Wnt1 levels in the presence of BIO (10 μM) or DMSO were analyzed by western blotting. Western results were from 3 independent experiments (except 6 in f–h), with blots exemplifying one experiment and the bar graphs showing the combined results on stiff matrix expressed as percentages (means ± SEM) of the corresponding results on soft matrix. GAPDH was used to normalize for equal loading in western blotting. *P < 0.05, **P < 0.01, n.s. stands for not statistically significant.
Figure 6
Figure 6. Wnt/β-catenin pathway contributes to ECM stiffness regulating chondrocytes phenotype maintenance.
(a) Chondrocytes were cultured on stiff or soft ECM for seven days in the presence of 10 μM Cardamonin or DMSO, followed by determination of Sox9, Aggrecan and ColI expressions by immunocytochemical staining. Scale Bar: 30 μm. (b) represents the statistical results of (a). (c) Chondrocytes were cultured on stiff or soft ECM for seven days in the presence of 10 μM Cardamonin or DMSO, followed by determination of Aggrecan, ColII and ColI expressions by western blotting. (d) Chondrocytes were cultured on stiff or soft ECM for seven days in the presence of Wnt1 (100 ng/ml) or solvent, followed by determination of Aggrecan, ColII and ColI expressions by immunocytochemical staining. Scale Bar: 30 μm. (e) represents the statistical results of (d). Scale Bar: 30 μm. Results on fluorescence intensities from 6 independent experiments on stiff matrix are expressed as percentages (mean ± SEM) of the corresponding results on the soft matrix. Western results were from 3 independent experiments, with blots exemplifying one experiment and the bar graphs showing the combined results on stiff matrix expressed as percentages (means ± SEM) of the corresponding results on soft matrix. GAPDH was used to normalize for equal loading in western blotting. *P < 0.05, **P < 0.01, ***P < 0.001, n.s. stands for not statistically significant.
Figure 7
Figure 7. Wnt/β-catenin pathway contributes to the regulation of BMMSC Differentiation by ECM stiffness.
(a) β-catenin and Wnt1 levels in BMMSCs 48 hr after seeding on stiff or soft ECM were analyzed by western blotting. (b) BMMSCs were cultured on stiff or soft ECM for seven days in the presence of 10 μM Cardamonin or DMSO, followed by determination of Runx2, ColI expressions western blotting. (c,d) BMMSCs were cultured on stiff or soft ECM for seven days in the presence of 10 μM Cardamonin or DMSO, followed by determination of MAP2, NFL, Runx2 and ColI expressions by immunocytochemical staining. Scale Bar: 30 μm. (e) BMMSCs were cultured on stiff or soft ECM for seven days in the presence of 10 μM Cardamonin or DMSO, followed by determination of MAP2 and NFL expressions western blotting. (f) BMP2 levels in BMMSCs treated with 10 μM Cardamonin or DMSO for 24 hr were analyzed by western blotting. Results on fluorescence intensities from 6 independent experiments on stiff matrix are expressed as percentages (mean ± SEM) of the corresponding results on the soft matrix. Western results were from 3 independent experiments with blots exemplifying one experiment and the bar graphs showing the combined results of 3 experiments on stiff matrix expressed as percentages of the corresponding results on the soft matrix. GAPDH was used to normalize for equal loading. *P < 0.05, **P < 0.01, ***P < 0.001, n.s. stands for not statistically significant.

Similar articles

Cited by

References

    1. Discher D. E., Janmey P. & Wang Y. L. Tissue cells feel and respond to the stiffness of their substrate. Science. 310, 1139–1143 (2005). - PubMed
    1. Higuchi A., Ling Q.-D., Chang Y., Hsu S.-T. & Umezawa A. Physical Cues of Biomaterials Guide Stem Cell Differentiation Fate. Chem Rev. 113, 3297–328 (2013). - PubMed
    1. Seiler C. et al. Smooth Muscle Tension Induces Invasive Remodeling of the Zebrafish Intestine. 10, e1001386 (2012). - PMC - PubMed
    1. Butcher D. T., Alliston T.& Weaver V. M. A tense situation: forcing tumour progression. Nat Rev Cancer. 9, 108–122 (2009). - PMC - PubMed
    1. Klein E. A. et al. Cell-cycle control by physiological matrix elasticity and in vivo tissue stiffening. Current biology. 19, 1511–1518 (2009). - PMC - PubMed

Publication types

MeSH terms