Human milk miRNAs primarily originate from the mammary gland resulting in unique miRNA profiles of fractionated milk
- PMID: 26854194
- PMCID: PMC4745068
- DOI: 10.1038/srep20680
Human milk miRNAs primarily originate from the mammary gland resulting in unique miRNA profiles of fractionated milk
Abstract
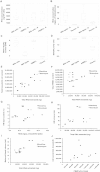
Human milk (HM) contains regulatory biomolecules including miRNAs, the origin and functional significance of which are still undetermined. We used TaqMan OpenArrays to profile 681 mature miRNAs in HM cells and fat, and compared them with maternal peripheral blood mononuclear cells (PBMCs) and plasma, and bovine and soy infant formulae. HM cells and PBMCs (292 and 345 miRNAs, respectively) had higher miRNA content than HM fat and plasma (242 and 219 miRNAs, respectively) (p < 0.05). A strong association in miRNA profiles was found between HM cells and fat, whilst PBMCs and plasma were distinctly different to HM, displaying marked inter-individual variation. Considering the dominance of epithelial cells in mature milk of healthy women, these results suggest that HM miRNAs primarily originate from the mammary epithelium, whilst the maternal circulation may have a smaller contribution. Our findings demonstrate that unlike infant formulae, which contained very few human miRNA, HM is a rich source of lactation-specific miRNA, which could be used as biomarkers of the performance and health status of the lactating mammary gland. Given the recently identified stability, uptake and functionality of food- and milk-derived miRNA in vivo, HM miRNA are likely to contribute to infant protection and development.
Figures


Similar articles
-
Human Milk Cells and Lipids Conserve Numerous Known and Novel miRNAs, Some of Which Are Differentially Expressed during Lactation.PLoS One. 2016 Apr 13;11(4):e0152610. doi: 10.1371/journal.pone.0152610. eCollection 2016. PLoS One. 2016. PMID: 27074017 Free PMC article.
-
Human Milk Cells Contain Numerous miRNAs that May Change with Milk Removal and Regulate Multiple Physiological Processes.Int J Mol Sci. 2016 Jun 17;17(6):956. doi: 10.3390/ijms17060956. Int J Mol Sci. 2016. PMID: 27322254 Free PMC article.
-
MicroRNAs synergistically regulate milk fat synthesis in mammary gland epithelial cells of dairy goats.Gene Expr. 2013;16(1):1-13. doi: 10.3727/105221613x13776146743262. Gene Expr. 2013. PMID: 24397207 Free PMC article.
-
MicroRNAs: Milk's epigenetic regulators.Best Pract Res Clin Endocrinol Metab. 2017 Aug;31(4):427-442. doi: 10.1016/j.beem.2017.10.003. Epub 2017 Oct 20. Best Pract Res Clin Endocrinol Metab. 2017. PMID: 29221571 Review.
-
Exosome-Derived MicroRNAs of Human Milk and Their Effects on Infant Health and Development.Biomolecules. 2021 Jun 7;11(6):851. doi: 10.3390/biom11060851. Biomolecules. 2021. PMID: 34200323 Free PMC article. Review.
Cited by
-
Milk Exosomes Prevent Intestinal Inflammation in a Genetic Mouse Model of Ulcerative Colitis: A Pilot Experiment.Inflamm Intest Dis. 2020 Aug;5(3):117-123. doi: 10.1159/000507626. Epub 2020 May 20. Inflamm Intest Dis. 2020. PMID: 32999884 Free PMC article.
-
Characterization of Holstein and Normande whole milk miRNomes highlights breed specificities.Sci Rep. 2019 Dec 30;9(1):20345. doi: 10.1038/s41598-019-56690-7. Sci Rep. 2019. PMID: 31889100 Free PMC article.
-
Milk exosomal miRNAs: potential drivers of AMPK-to-mTORC1 switching in β-cell de-differentiation of type 2 diabetes mellitus.Nutr Metab (Lond). 2019 Dec 6;16:85. doi: 10.1186/s12986-019-0412-1. eCollection 2019. Nutr Metab (Lond). 2019. PMID: 31827573 Free PMC article.
-
MicroRNAs of Milk in Cells, Plasma, and Lipid Fractions of Human Milk, and Abzymes Catalyzing Their Hydrolysis.Int J Mol Sci. 2022 Oct 11;23(20):12070. doi: 10.3390/ijms232012070. Int J Mol Sci. 2022. PMID: 36292926 Free PMC article.
-
Dietary Improvement during Lactation Normalizes miR-26a, miR-222 and miR-484 Levels in the Mammary Gland, but Not in Milk, of Diet-Induced Obese Rats.Biomedicines. 2022 May 31;10(6):1292. doi: 10.3390/biomedicines10061292. Biomedicines. 2022. PMID: 35740314 Free PMC article.
References
-
- Kramer M. S. “Breast is best”: The evidence. Early Hum Dev 86, 729–732 (2010). - PubMed
-
- Hassiotou F. & Geddes D. T. Programming of appetite control during breastfeeding as a preventative strategy against the obesity epidemic. J Hum Lact 30, 136–142 (2014). - PubMed
-
- Dewey K. G., Heinig M. J. & Nommsen-Rivers L. A. Differences in morbidity between breast-fed and formula-fed infants. J Pediatr 126, 696–702 (1995). - PubMed
-
- Newburg D. S. & Walker W. A. Protection of the neonate by the innate immune system of developing gut and of human milk. Pediatr Res 61, 2–8 (2007). - PubMed
Publication types
MeSH terms
Substances
LinkOut - more resources
Full Text Sources
Other Literature Sources

