. 2016 Apr;44(4):231-7.e4.
doi: 10.1016/j.exphem.2015.12.006. Epub 2016 Feb 5.

Expression of the MOZ-TIF2 oncoprotein in mice represses senescence

Affiliations

Expression of the MOZ-TIF2 oncoprotein in mice represses senescence

Anne Largeot et al. Exp Hematol. 2016 Apr.

Abstract

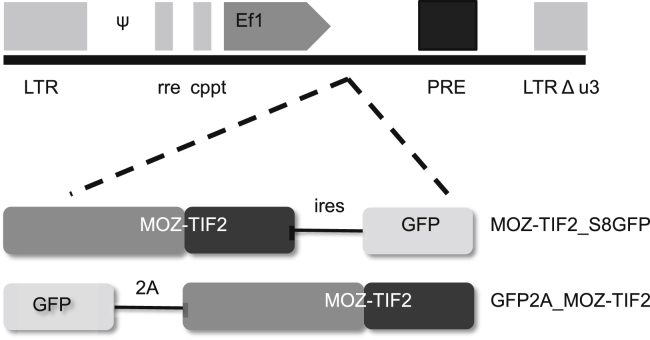
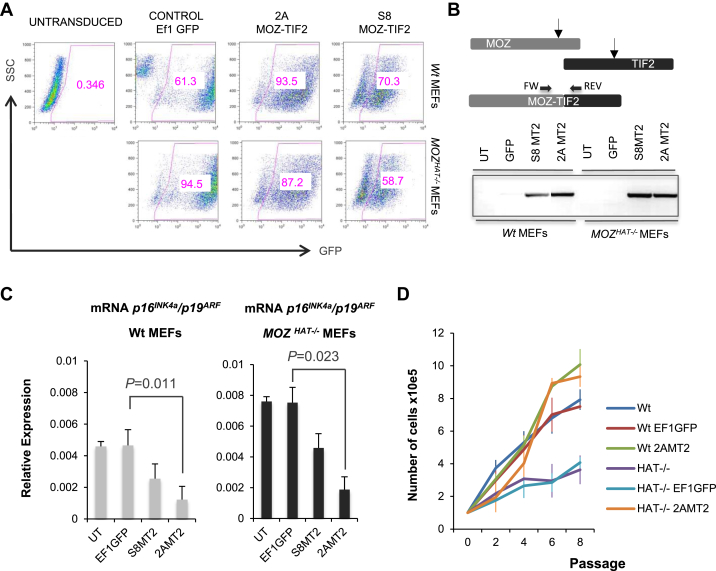
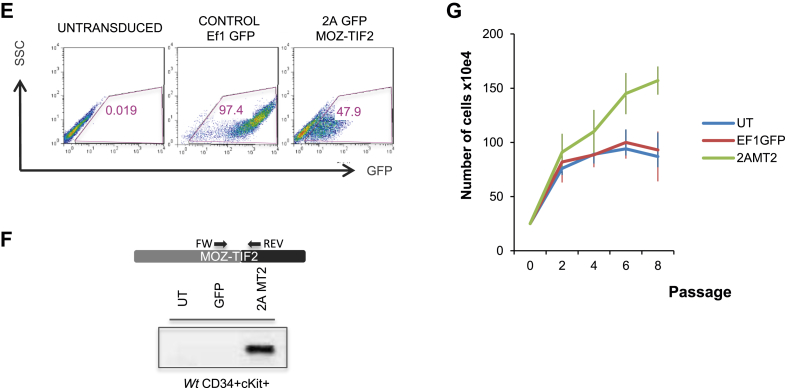
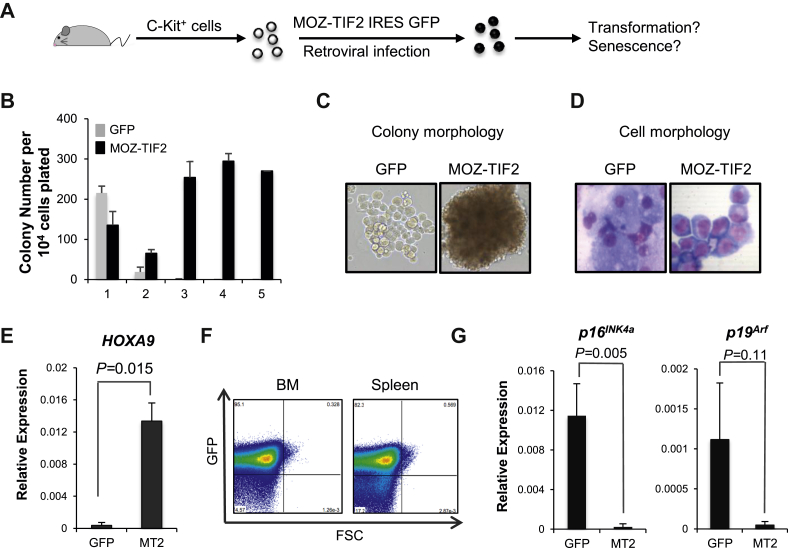
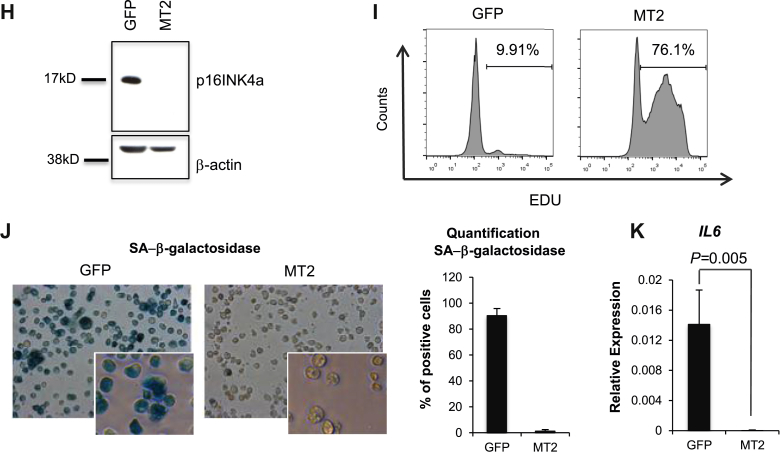
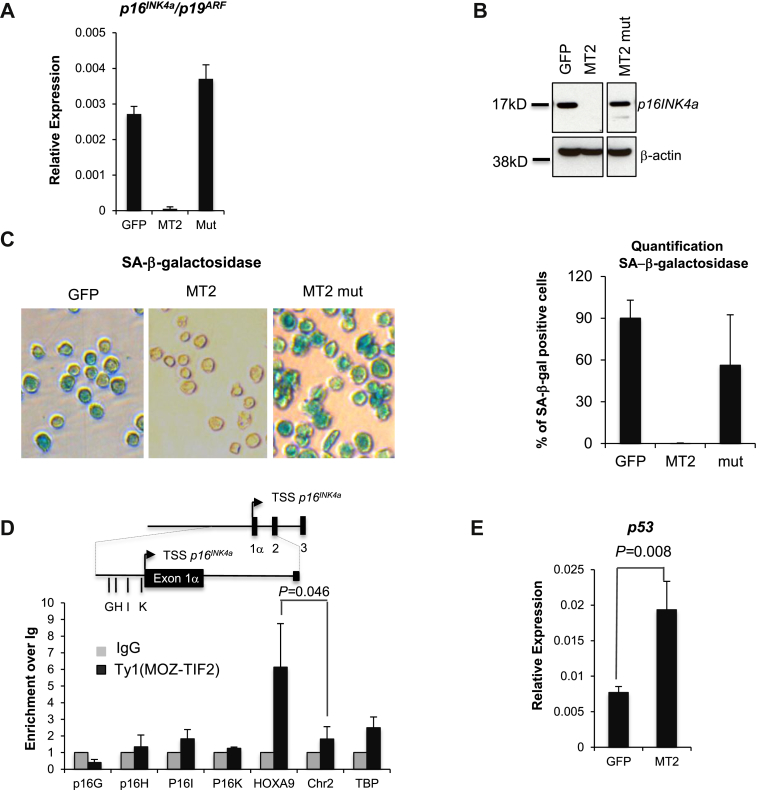
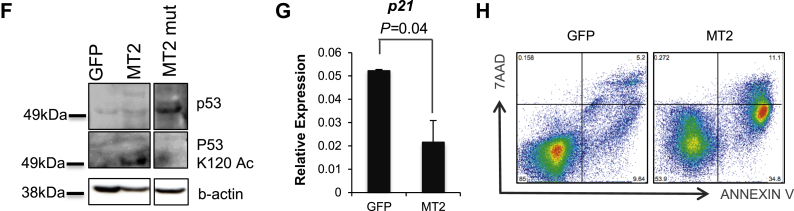
The MOZ-TIF2 translocation, which fuses monocytic leukemia zinc finger protein (MOZ) histone acetyltransferase (HAT) with the nuclear co-activator TIF2, is associated with the development of acute myeloid leukemia. We recently found that in the absence of MOZ HAT activity, p16(INK4a) transcriptional levels are significantly increased, triggering an early entrance into replicative senescence. Because oncogenic fusion proteins must bypass cellular safeguard mechanisms, such as senescence and apoptosis, to induce leukemia, we hypothesized that this repressive activity of MOZ over p16(INK4a) transcription could be preserved, or even reinforced, in MOZ leukemogenic fusion proteins, such as MOZ-TIF2. We describe here that, indeed, MOZ-TIF2 silences expression of the CDKN2A locus (p16(INK4a) and p19(ARF)), inhibits the triggering of senescence and enhances proliferation, providing conditions favorable to the development of leukemia. Furthermore, we describe that abolishing the MOZ HAT activity of the fusion protein leads to a significant increase in expression of the CDKN2A locus and the number of hematopoietic progenitors undergoing senescence. Finally, we report that inhibition of senescence by MOZ-TIF2 is associated with increased apoptosis, suggesting a role for the fusion protein in p53 apoptosis-versus-senescence balance. Our results underscore the importance of the HAT activity of MOZ, preserved in the fusion protein, for repression of the CDKN2A locus transcription and the subsequent block of senescence, a necessary step for the survival of leukemic cells.


Figures

Supplementary Figure E1
Schematic overview of the MOZ-TIF2-expressing lentiviral vectors used in this study. Ef1 = human elongation factor 1α promoter; LTR = long terminal repeat; ψ = viral packaging signal; rre = rev responsive elements; cppt = central polypurine tract; PRE = hepatitis B virus posttranscriptional regulatory element; GFP = enhanced green fluorescent protein; ires = internal ribosomal entry site, 8 repeats of the 9-nt IRES module from the Gtx 5′ UTR; 2a = foot-and-mouth disease virus self-cleaving 2a peptide sequence -F2A.
Figure 1
Figure 1
(A) Flow cytometry profile of untransduced MEFs (UT) and MEFs transduced with the different lentiviruses (EF1GFP, 2AGFP_MOZTIF2, and S8MOZ-TIF2) and therefore expressing GFP. Numbers represent the percentages of cells positive for GFP 48 hours after transduction in each case (n = 3 for each genotype). Multiplicity of infection (MOI) = 30. (B) PCR for the MOZ-TIF2 transcript on untransduced cells and MEFs transduced with the different lentiviruses. (C) Quantitative PCR revealing the relative expression levels of p16INK4a/p19ARF in WT and MozHAT–/– MEFs (passage 3) untransduced or transduced with the different lentiviruses. The transcript levels were normalized to β-actin for all reactions. Values reflect averages of triplicate samples. Bars represent standard errors of the mean values. (D) Growth curves of cultures of WT and MozHAT–/– MEFs transduced with the different lentiviruses. The graph represents the average values from three independent cultures. Passage numbers are indicated. Bars represent standard errors of the mean values. (E) Flow cytometry profile of untransduced (UT) CD34+cKit+ hematopoietic progenitors and the same cells transduced with either EF1GFP or 2AGFP_MOZTIF2 lentivirus. Numbers represent the percentages of cells positive for GFP 48 hours after transduction in each case. MOI = 50. (F) Specific PCR for the detection of MOZ-TIF2 transcripts in transduced CD34+cKit+ cells. (G) Growth curves of WT CD34+cKit+ cultures transduced with the different lentiviruses. The graph represents the average values from three independent cultures. Passage numbers are indicated. Bars indicate standard errors of the mean values.
Figure 1
Figure 1
(A) Flow cytometry profile of untransduced MEFs (UT) and MEFs transduced with the different lentiviruses (EF1GFP, 2AGFP_MOZTIF2, and S8MOZ-TIF2) and therefore expressing GFP. Numbers represent the percentages of cells positive for GFP 48 hours after transduction in each case (n = 3 for each genotype). Multiplicity of infection (MOI) = 30. (B) PCR for the MOZ-TIF2 transcript on untransduced cells and MEFs transduced with the different lentiviruses. (C) Quantitative PCR revealing the relative expression levels of p16INK4a/p19ARF in WT and MozHAT–/– MEFs (passage 3) untransduced or transduced with the different lentiviruses. The transcript levels were normalized to β-actin for all reactions. Values reflect averages of triplicate samples. Bars represent standard errors of the mean values. (D) Growth curves of cultures of WT and MozHAT–/– MEFs transduced with the different lentiviruses. The graph represents the average values from three independent cultures. Passage numbers are indicated. Bars represent standard errors of the mean values. (E) Flow cytometry profile of untransduced (UT) CD34+cKit+ hematopoietic progenitors and the same cells transduced with either EF1GFP or 2AGFP_MOZTIF2 lentivirus. Numbers represent the percentages of cells positive for GFP 48 hours after transduction in each case. MOI = 50. (F) Specific PCR for the detection of MOZ-TIF2 transcripts in transduced CD34+cKit+ cells. (G) Growth curves of WT CD34+cKit+ cultures transduced with the different lentiviruses. The graph represents the average values from three independent cultures. Passage numbers are indicated. Bars indicate standard errors of the mean values.
Figure 2
Figure 2
(A) Schematic representation of the experimental design. Bone marrow cKit+ cells infected with a retrovirus encoding MOZ-TIF2 were tested for their leukemic potential and senescence status. (B) Serial replating of MOZ-TIF2 (MT2)-expressing cells and GFP control cells (n = 3). (C) Photographs of the colonies after the second replating. Representative images from three independent experiments. (D) MGG staining of cytospin from the second replating. Representative images from three independent experiments. (E) Analysis of HOXA9 transcript levels in cKit+ expressing MOZ-TIF2 or the control virus (n = 3). (F) Flow cytometry detection of MOZ-TIF2-expressing cells (GFP+) in the bone marrow (BM) and the spleen of mice culled because of sickness. Representative FACS plots of five mice. (G) Analysis of p16INK4a/p19ARF transcript levels in cKit+ expressing MOZ-TIF2 or cells transduced with the control virus (n = 3). (H) Western blot analysis for p16INK4a protein levels in the MOZ-TIF2 and control cells. Results are representative of two independent experiments. (I) Flow cytometry analysis of cell cycle. (J) Photographs of MT2 and control cells after SA-β-Gal staining and quantification (n = 3). (K) Analysis of IL6 transcript levels in cKit+ expressing MOZ-TIF2 or in control cells (n = 3).
Figure 2
Figure 2
(A) Schematic representation of the experimental design. Bone marrow cKit+ cells infected with a retrovirus encoding MOZ-TIF2 were tested for their leukemic potential and senescence status. (B) Serial replating of MOZ-TIF2 (MT2)-expressing cells and GFP control cells (n = 3). (C) Photographs of the colonies after the second replating. Representative images from three independent experiments. (D) MGG staining of cytospin from the second replating. Representative images from three independent experiments. (E) Analysis of HOXA9 transcript levels in cKit+ expressing MOZ-TIF2 or the control virus (n = 3). (F) Flow cytometry detection of MOZ-TIF2-expressing cells (GFP+) in the bone marrow (BM) and the spleen of mice culled because of sickness. Representative FACS plots of five mice. (G) Analysis of p16INK4a/p19ARF transcript levels in cKit+ expressing MOZ-TIF2 or cells transduced with the control virus (n = 3). (H) Western blot analysis for p16INK4a protein levels in the MOZ-TIF2 and control cells. Results are representative of two independent experiments. (I) Flow cytometry analysis of cell cycle. (J) Photographs of MT2 and control cells after SA-β-Gal staining and quantification (n = 3). (K) Analysis of IL6 transcript levels in cKit+ expressing MOZ-TIF2 or in control cells (n = 3).
Figure 3
Figure 3
(A) Analysis of p16INK4a/p19ARF transcript levels in cKit+ cells expressing MOZ-TIF2, MOZ-TIF2 with the mutated HAT domain of MOZ, or the control virus (n = 2). (B) Western blot analysis of p16INK4a protein levels in the cells expressing the mutated form of MOZ-TIF2 compared with WT MOZ-TIF2 cells. (C) Photographs of cells expressing either the WT or the mutant MOZ-TIF2 fusion protein and control cells after SA-β-Gal staining (left) and quantification (right) (n = 3). (D) ChIP analysis of the recruitment of the Ty1-tagged MOZ-TIF2 using an anti-Ty1 antibody (n = 2). (E) Analysis of p53 transcript levels in cKit+ expressing MOZ-TIF2 or the control virus (n = 3). (F) Western blot analysis of p53 and p53 acetylated at lysine 120 (p53K120) protein levels in cells expressing MOZ-TIF2 or control cells. (G) Analysis of p21 transcript levels in cKit+ expressing MOZ-TIF2 or the control virus (n = 3). (H) Flow cytometry analysis of apoptosis using annexin V and 7ADD staining. Results are representative images from two independent experiments.
Figure 3
Figure 3
(A) Analysis of p16INK4a/p19ARF transcript levels in cKit+ cells expressing MOZ-TIF2, MOZ-TIF2 with the mutated HAT domain of MOZ, or the control virus (n = 2). (B) Western blot analysis of p16INK4a protein levels in the cells expressing the mutated form of MOZ-TIF2 compared with WT MOZ-TIF2 cells. (C) Photographs of cells expressing either the WT or the mutant MOZ-TIF2 fusion protein and control cells after SA-β-Gal staining (left) and quantification (right) (n = 3). (D) ChIP analysis of the recruitment of the Ty1-tagged MOZ-TIF2 using an anti-Ty1 antibody (n = 2). (E) Analysis of p53 transcript levels in cKit+ expressing MOZ-TIF2 or the control virus (n = 3). (F) Western blot analysis of p53 and p53 acetylated at lysine 120 (p53K120) protein levels in cells expressing MOZ-TIF2 or control cells. (G) Analysis of p21 transcript levels in cKit+ expressing MOZ-TIF2 or the control virus (n = 3). (H) Flow cytometry analysis of apoptosis using annexin V and 7ADD staining. Results are representative images from two independent experiments.

Similar articles

Cited by

References

    1. Avvakumov N., Côté J. Functions of myst family histone acetyltransferases and their link to disease. Subcell Biochem. 2007;41:295–317. - PubMed
    1. Borrow J., Stanton V.P., Jr., Andresen J.M. The translocation t(8;16)(p11;p13) of acute myeloid leukaemia fuses a putative acetyltransferase to the CREB-binding protein. Nat Genet. 1996;14:33–41. - PubMed
    1. Perez-Campo F.M., Costa G., Lie-A-Ling M., Kouskoff V., Lacaud G. The MYSTerious MOZ, a histone acetyltransferase with a key role in haematopoiesis. Immunology. 2013;139:161–165. - PMC - PubMed
    1. Katsumoto T., Aikawa Y., Iwama A. MOZ is essential for maintenance of hematopoietic stem cells. Genes Dev. 2006;20:1321–1330. - PMC - PubMed
    1. Thomas T., Corcoran L.M., Gugasyan R. Monocytic leukemia zinc finger protein is essential for the development of long-term reconstituting hematopoietic stem cells. Genes Dev. 2006;20:1175–1186. - PMC - PubMed

Publication types

MeSH terms

Substances