

New tissue priors for improved automated classification of subcortical brain structures on MRI
- PMID: 26854557
- PMCID: PMC4819722
- DOI: 10.1016/j.neuroimage.2016.01.062
New tissue priors for improved automated classification of subcortical brain structures on MRI
Abstract
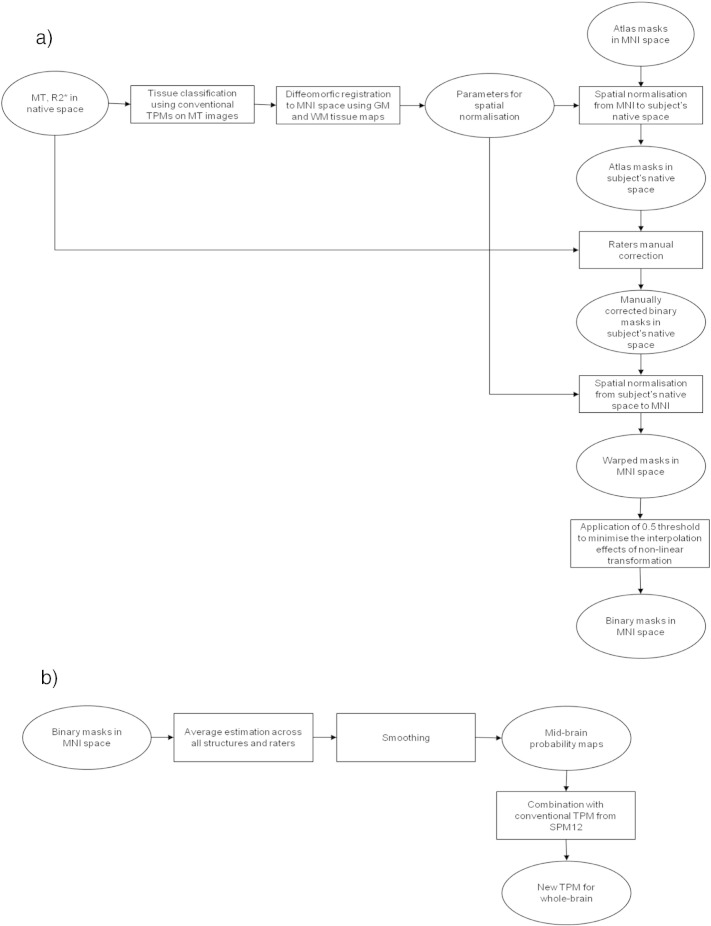
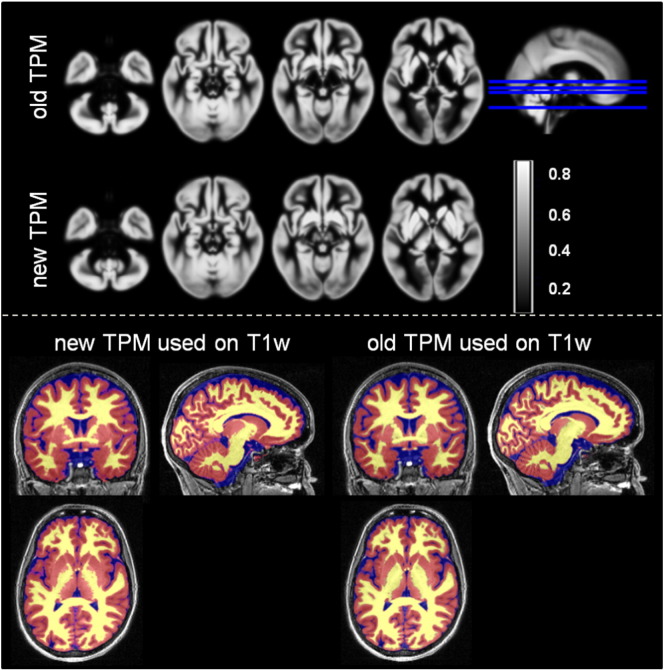
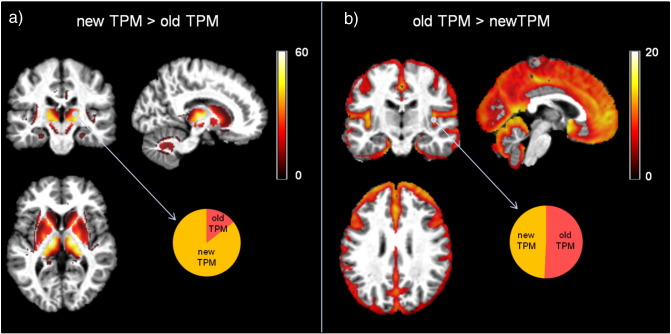
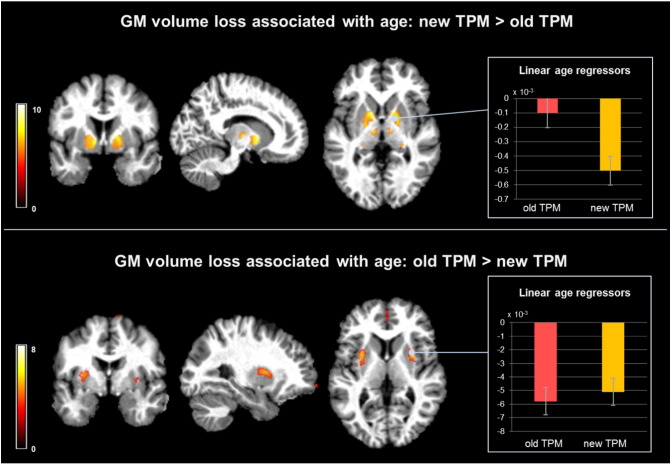
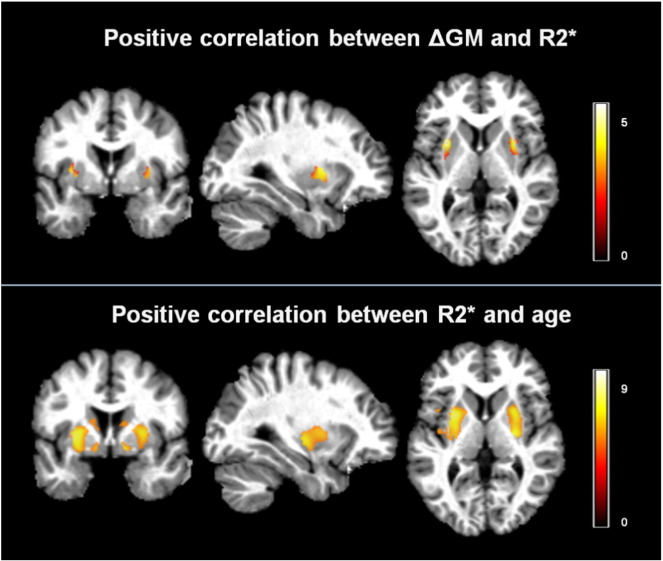
Despite the constant improvement of algorithms for automated brain tissue classification, the accurate delineation of subcortical structures using magnetic resonance images (MRI) data remains challenging. The main difficulties arise from the low gray-white matter contrast of iron rich areas in T1-weighted (T1w) MRI data and from the lack of adequate priors for basal ganglia and thalamus. The most recent attempts to obtain such priors were based on cohorts with limited size that included subjects in a narrow age range, failing to account for age-related gray-white matter contrast changes. Aiming to improve the anatomical plausibility of automated brain tissue classification from T1w data, we have created new tissue probability maps for subcortical gray matter regions. Supported by atlas-derived spatial information, raters manually labeled subcortical structures in a cohort of healthy subjects using magnetization transfer saturation and R2* MRI maps, which feature optimal gray-white matter contrast in these areas. After assessment of inter-rater variability, the new tissue priors were tested on T1w data within the framework of voxel-based morphometry. The automated detection of gray matter in subcortical areas with our new probability maps was more anatomically plausible compared to the one derived with currently available priors. We provide evidence that the improved delineation compensates age-related bias in the segmentation of iron rich subcortical regions. The new tissue priors, allowing robust detection of basal ganglia and thalamus, have the potential to enhance the sensitivity of voxel-based morphometry in both healthy and diseased brains.
Keywords: Basal ganglia; Effective transverse relaxation; Magnetization transfer saturation; Relaxometry; Tissue probability maps; Voxel-based morphometry; Voxel-based quantification.
Copyright © 2016 The Authors. Published by Elsevier Inc. All rights reserved.
Figures
Similar articles
-
Disentangling in vivo the effects of iron content and atrophy on the ageing human brain.Neuroimage. 2014 Dec;103:280-289. doi: 10.1016/j.neuroimage.2014.09.044. Epub 2014 Sep 28. Neuroimage. 2014. PMID: 25264230 Free PMC article.
-
Multi-atlas tool for automated segmentation of brain gray matter nuclei and quantification of their magnetic susceptibility.Neuroimage. 2019 May 1;191:337-349. doi: 10.1016/j.neuroimage.2019.02.016. Epub 2019 Feb 7. Neuroimage. 2019. PMID: 30738207 Free PMC article.
-
Human brain atlas for automated region of interest selection in quantitative susceptibility mapping: application to determine iron content in deep gray matter structures.Neuroimage. 2013 Nov 15;82:449-69. doi: 10.1016/j.neuroimage.2013.05.127. Epub 2013 Jun 12. Neuroimage. 2013. PMID: 23769915 Free PMC article.
-
Regional deficits in brain volume in schizophrenia: a meta-analysis of voxel-based morphometry studies.Am J Psychiatry. 2005 Dec;162(12):2233-45. doi: 10.1176/appi.ajp.162.12.2233. Am J Psychiatry. 2005. PMID: 16330585 Review.
-
Quantifying deep grey matter atrophy using automated segmentation approaches: A systematic review of structural MRI studies.Neuroimage. 2019 Nov 1;201:116018. doi: 10.1016/j.neuroimage.2019.116018. Epub 2019 Jul 15. Neuroimage. 2019. PMID: 31319182
Cited by
-
Improving Individual Brain Age Prediction Using an Ensemble Deep Learning Framework.Front Psychiatry. 2021 Mar 23;12:626677. doi: 10.3389/fpsyt.2021.626677. eCollection 2021. Front Psychiatry. 2021. PMID: 33833699 Free PMC article.
-
Motion-corrected and high-resolution anatomically assisted (MOCHA) reconstruction of arterial spin labeling MRI.Magn Reson Med. 2020 Sep;84(3):1306-1320. doi: 10.1002/mrm.28205. Epub 2020 Mar 3. Magn Reson Med. 2020. PMID: 32125015 Free PMC article.
-
Topography of associations between cardiovascular risk factors and myelin loss in the ageing human brain.Commun Biol. 2023 Apr 10;6(1):392. doi: 10.1038/s42003-023-04741-1. Commun Biol. 2023. PMID: 37037939 Free PMC article.
-
Acute nicotine abstinence amplifies subjective withdrawal symptoms and threat-evoked fear and anxiety, but not extended amygdala reactivity.PLoS One. 2023 Jul 20;18(7):e0288544. doi: 10.1371/journal.pone.0288544. eCollection 2023. PLoS One. 2023. PMID: 37471317 Free PMC article. Clinical Trial.
-
Blunted ventral striatal reactivity to social reward is associated with more severe motivation and pleasure deficits in psychosis.Res Sq [Preprint]. 2024 Jun 12:rs.3.rs-4468839. doi: 10.21203/rs.3.rs-4468839/v1. Res Sq. 2024. Update in: Schizophr Bull. 2025 Jan 09:sbae221. doi: 10.1093/schbul/sbae221. PMID: 38947025 Free PMC article. Updated. Preprint.
References
-
- Ahsan R.L., Allom R., Gousias I.S., Habib H., Turkheimer F.E., Free S., Lemieux L., Myers R., Duncan J.S., Brooks D.J., Koepp M.J., Hammers A. Volumes, spatial extents and a probabilistic atlas of the human basal ganglia and thalamus. NeuroImage. 2007;38:261–270. - PubMed
-
- Ashburner J. A fast diffeomorphic image registration algorithm. NeuroImage. 2007;38:95–113. - PubMed
-
- Ashburner J., Friston K.J. Voxel-based morphometry—the methods. NeuroImage. 2000;11:805–821. - PubMed
-
- Ashburner J., Friston K.J. Unified segmentation. NeuroImage. 2005;26:839–851. - PubMed
-
- Ashburner J., Csernansky J.G., Davatzikos C., Fox N.C., Frisoni G.B., Thompson P.M. Computer-assisted imaging to assess brain structure in healthy and diseased brains. Lancet Neurol. 2003;2:79–88. - PubMed
Publication types
MeSH terms
Grants and funding
LinkOut - more resources
Full Text Sources
Other Literature Sources
