. 2016 Mar;18(3):319-27.
doi: 10.1038/ncb3311. Epub 2016 Feb 8.

Secreted IGFBP5 mediates mTORC1-dependent feedback inhibition of IGF-1 signalling

Affiliations

Secreted IGFBP5 mediates mTORC1-dependent feedback inhibition of IGF-1 signalling

Ming Ding et al. Nat Cell Biol. 2016 Mar.

Abstract

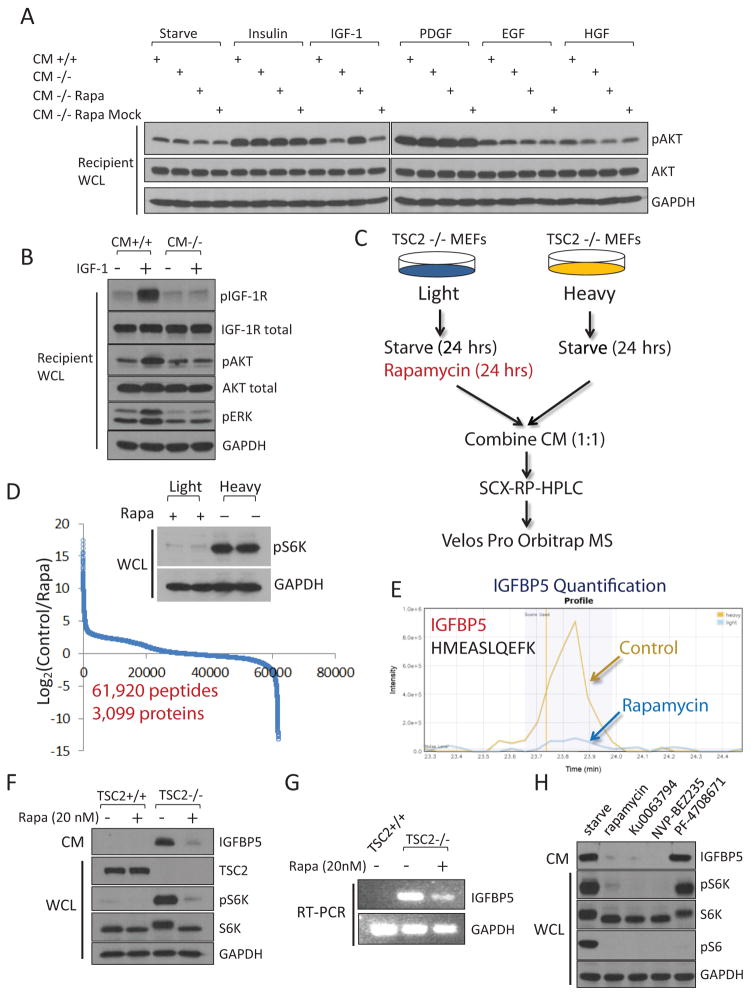
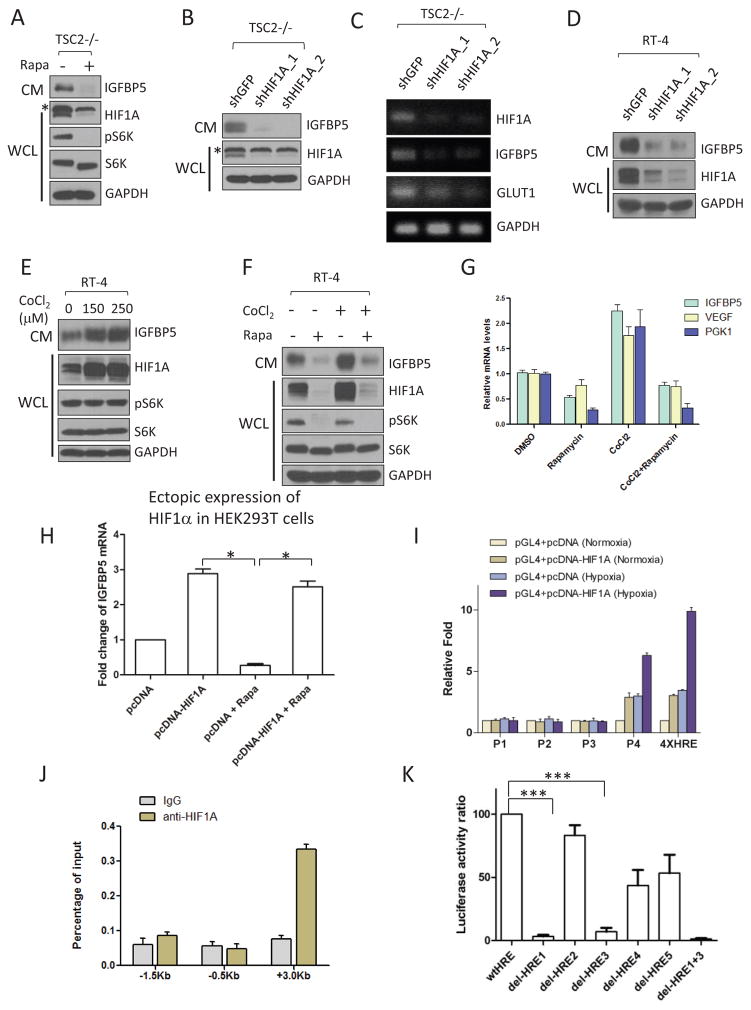
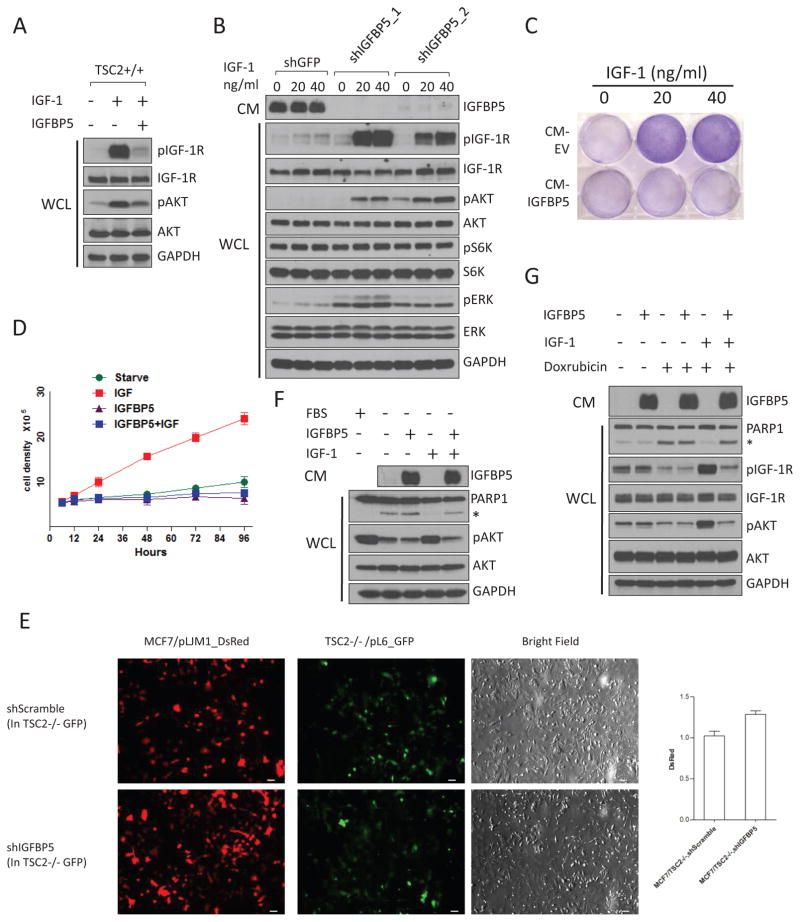
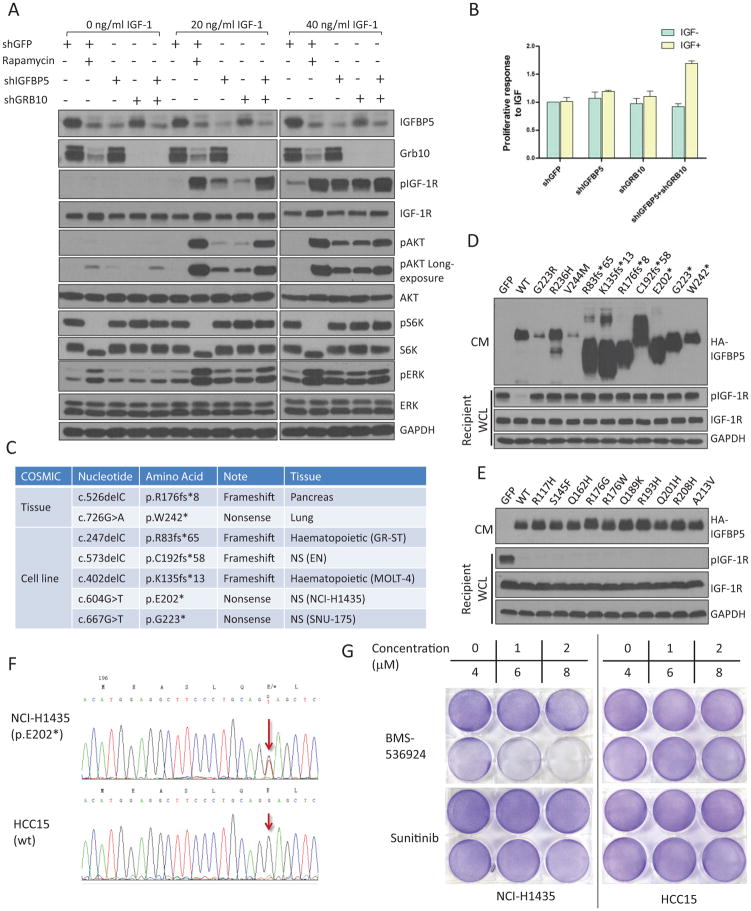
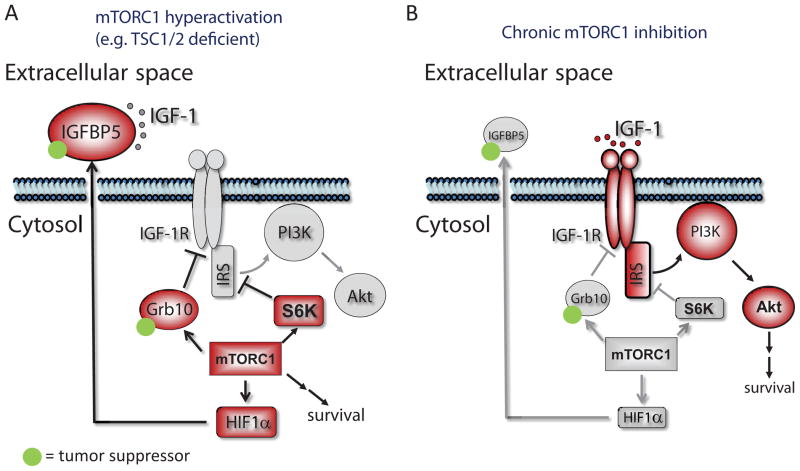
The PI(3)K-Akt-mTORC1 pathway is a highly dynamic network that is balanced and stabilized by a number of feedback inhibition loops. Specifically, activation of mTORC1 has been shown to lead to the inhibition of its upstream growth factor signalling. Activation of the growth factor receptors is triggered by the binding of their cognate ligands in the extracellular space. However, whether secreted proteins contribute to the mTORC1-dependent feedback loops remains unclear. We found that cells with hyperactive mTORC1 secrete a protein that potently inhibits the function of IGF-1. Using a large-scale, unbiased quantitative proteomic platform, we comprehensively characterized the rapamycin-sensitive secretome in TSC2(-/-) mouse embryonic fibroblasts, and identified IGFBP5 as a secreted, mTORC1 downstream effector protein. IGFBP5 is a direct transcriptional target of HIF1, which itself is a known mTORC1 target. IGFBP5 is a potent inhibitor of both the signalling and functional outputs of IGF-1. Once secreted, IGFBP5 cooperates with intracellular branches of the feedback mechanisms to block the activation of IGF-1 signalling. Finally, IGFBP5 is a potential tumour suppressor, and the proliferation of IGFBP5-mutated cancer cells is selectively blocked by IGF-1R inhibitors.


Figures

Figure 1
Figure 1
Cells with hyperactivated mTORC1 secrete a protein factor(s) that blocks IGF-1 signaling. (A) Conditioned media was collected from TSC2+/+ MEFs (CM+/+) or TSC2−/− MEFs (CM−/−), mixed with the indicated growth factor, and were then incubated with regular wt MEFs (designated as “recipient cells”) for 10 min. CM that was not mixed with any growth factors was indicated as “starve”. CM was also collected from TSC2−/− MEFs that had been treated with 20 nM rapamycin for 24 hrs (CM−/− Rapa). As a control experiment, CM from TSC2−/− cells were collected first, and then mixed with rapamycin (CM−/− Rapa Mock). For site-specific phosphorylation, pAkt(S473) levels were analyzed. Growth factor concentrations are Insulin, 100 nM; IGF-1, 40 ng/ml; PDGF, 50 ng/ml; EGF, 50 ng/ml and HGF, 50 ng/ml. (B) CM from TSC2−/− MEFs is able to block the activation of the IGF-1 signaling pathway. Experiments were performed as in (A). pIGF-1R(Y1135/1136), pAkt(S473), and pERK(T202/Y204) levels were analyzed. (C) A gerneral schematic of the quantitative secretomic platform. (D) Ratio distribution of the identified peptides (a total of 63,157 from 3,430 proteins). Ratio (control/rapamycin-treated) distribution of these peptides is shown on a Log2 scale. Light and heavy lysates were also subject to immunoblotting analysis for pS6K(T389) levels. (E) Extracted ion chromatogram of the light (rapamycin-treated, blue) and heavy (control, yellow) ions of an IGFBP5 peptide (HMEASLQEFK). (F) CM from TSC2−/− MEFs, but not TSC2+/+ MEFs, contains high levels of IGFBP5. Cells were starved for 24 hrs, after which CM was collected. When indicated, cells were also treated with rapamycin (20 nM for 24 hrs). CM and WCL of these cells were analyzed by using immunoblotting experiments for pS6K(T389) levels. (G) IGFBP5 expression is regulated by mTORC1 at the transcription level. Total RNA was extracted from TSC2+/+, TSC2−/− MEFs, or TSC2−/− MEFs that had been treated with 20 nM rapamycin for 24 hrs, and was analyzed. (H) Treatment of TSC2−/− MEFs by rapamycin (20 nM), Ku0063794 (1 μM) and NVP-BEZ235 (500 nM), but not an S6K inhibitor (PF-4708671, 10 μM), led to downregulation of IGFBP5 in CM. For site-specific phosphorylation, pS6K(T389) and pS6(S235/236) levels were analyzed.
Figure 2
Figure 2
Expression of IGFBP5 is transcriptionally regulated by HIF1α. (A) Rapamycin treatment (20 nM, 24hrs) of TSC2−/− MEFs led to a concurrent downregulation of HIFα (in WCL) and IGFBP5 (in CM). The asterisk indicates a non-specific band. For site-specific phosphorylation, pS6K(T389) levels were analyzed. (B) and (C) RNAi-mediated knockdown of HIFα in TSC2−/− MEFs led to downregulation of IGFBP5 at both protein (B) and mRNA (C) levels. Glut1 is a known transcriptional target of HIFα, and was used as a positive control. The asterisk indicates a non-specific band. (D) Knockdown of HIF1α in RT-4 cells led to a similar downregulation of IGFBP5 levels in CM. (E) Treating RT-4 cells with a hypoxic-mimetic, CoCl2 (24 hrs with the indicated concentrations), led to stabilization of HIF1α in WCL, and accumulation of IGFBP5 in CM. Concurrent treatment of RT-4 cells with CoCl2 (250 μM) and rapamycin (20 nM) abolished IGFBP5 expression at the protein (F) and mRNA (G) levels. P < 0.05 (two way ANOVA test). n=3 independent biological replicate experiments. Error bars represent s. d. (H) IGFBP5 expression is insensitive to mTORC1 inhibition (rapamycin at 20 nM, 24 hrs) in a HIF1α-ectopic expression system. HEK293T cells were transfected with either a pcDNA-HIF1α or a control vector. IGFBP5 mRNA levels were determined by quantitative RT-PCR. *P < 0.05 (two-tailed Student t-test). n = 3 independent biological replicate experiments; Error bars represent s.d. (I) Luciferase reporter assays indicate that the first intron (designed as P4, see Supplementary Figure 3) of the IGFBP5 gene contains functional HREs. Luciferase activities were normalized to Renella luciferase. Hypoxia was induced by growing the cells in a hypoxia chamber (1% O2). A luciferase reporter construct containing 4X HRE (from Promega) was used as the positive control. P <0.001 (two way ANOVA test). n=3 independent biological replicate experiments. Error bars represent s.d. (J) ChIP qRT-PCR confirmation of the binding between HIF1α and the potential HREs in the P4 region. P <0.001 (two way ANOVA test). n=3 independent biological replicate experiments. Error bars represent s.d. (K) Deletion of HRE1 and HRE3 (Supplementary Figure 3) in the P4 region of the IGFBP5 gene abolishes the binding of HIF1α in the luciferase assay. ***P < 0.001 (two-tailed Student t-test). n = 3 independent biological replicate experiments; Error bars represent s.d.
Figure 3
Figure 3
IGFBP5 is a potent inhibitor of IGF-1 signaling. (A) Addition of recombinant IGFBP5 (R&D systems) to culture media blocks IGF-1-induced activation (20 ng/ml, 5 mins) of IGF-1R (pIGF-1R(Y1135/1136)) and Akt (pAkt(S473)) in wt MEFs. (B) Knockdown of IGFBP5 in TSC2−/− MEFs led to strong activation of IGF-1R and its downstream kinases (Akt and ERK), in response to IGF stimulation. Cells were starved overnight, and were stimulated with IGF (20 ng/ml, 5 mins). For site-specific phosphorylation, pIGF-1R(Y1135/1136), pAkt(S473), pS6K(T389) and pERK(T202/Y204) levels were analyzed. (C) and (D) Addition of IGFBP5 to culture media blocked IGF-1-induced cell proliferation. MCF7 cells were starved, and were then treated with IGF-1 mixed with CM from HEK293T cells transfected with an empty vector, or an IGFBP5-expressing construct, respectively. Cells were stained by crystal violet (C) (after 48 hrs), or counted (D). P <0.001 (two-way ANOVA test). n=9 independent biological replicate experiments. Error bars represent s.d. (E) IGFBP5 secreted from TSC2−/− MEFs inhibits the growth of MCF7 cells in a co-culture system. MCF7 cells were labeled with red florescent protein (DsRed), and were growth with GFP-labeled TSC2−/− MEFs with either control-knock down, or IGFBP5-knock down. Cells were grown in DMEM supplemented with IGF-1 (40 ng/ml), with fluorescence signal intensities quantified for the green and red channels. P <0.05 (two-tailed student t-test). n =3 independent biological replicate experiments. Error bars represent s.d. Scale bars, 40 μm. (F) The presence of IGF (40 ng/ml) in culture media protected cells from starvation-induced apoptosis. This effect, however, is blocked by the addition of IGFBP5. The asterisk indicates cleaved PARP1. CM from HEK293T cells transfected with an IGFBP5-expressing construct was used as the source of IGFBP5. For site-specific phosphorylation, pAkt(S473) levels were analyzed. (G) The presence of IGF-1 in culture media protected cells from Doxorubicin-induced (1 μM, 6 hrs) apoptosis. This effect was blocked by the addition of IGFBP5. MCF7 cells were starved overnight, and were treated with doxorubicin in the presence of IGF (40 ng/ml) or IGF+IGFBP5. CM from HEK293T cells transfected with an IGFBP5-expressing construct was used as the source of IGFBP5. For site-specific phosphorylation, pIGF-1R(Y1135/1136) and pAkt(S473) levels were analyzed.
Figure 4
Figure 4
IGFBP5 is a major mediator of mTORC1-dependent feedback inhibition of IGF-1 signaling. (A) IGFBP5 and Grb10 together account for a major faction of the IGF-1-inhibitory activity of mTORC1. We generated TSC2−/− MEFs with single IGFBP5 or Grb10 knockdown, as well as IGFBP5+Grb10 double knockdown. Where indicated, cells were also treated with rapamycin (20 nM for 24 hrs). Cells were stimulated with IGF-1 (at indicated concentrations). For site-specific phosphorylation, pIGF-1R(Y1135/1136), pAkt(S473), pS6K(T389) and pERK(T202/Y204) levels were analyzed. (B) Grb10 and IGFBP5 double knock down cells show increased proliferative responses in IGF-1-supplemented media. P <0.001 (two-way ANOVA test). n=9 independent biological replicate experiments. Error bars represent s.d. (C) Cancer-associated frameshift and nonsense mutations that have been reported for IGFBP5 (data from COSMIC). A complete list of the somatic mutations is shown in Supplementary Table 8. (D) and (E) IGFBP5 expression constructs harboring cancer-associated mutations were transfected into HEK293T cells. Cells were starved, and the corresponding CM was collected, mixed with IGF-1 and was incubated with wild-type MEFs (recipient cells). WCL was analyzed by immunoblotting experiments using the indicated antibodies. Cancer-associated mutations of IGFBP5 are shown that either disrupt (D) or maintain (E) its IGF-1-inhibitory activity. For site-specific phosphorylation, pIGF-1R(Y1135/1136) levels were analyzed. (F) NCI-H1435 cells harbor heterozygous IGFBP5 mutation (E202*). Genomic fragment in the 3rd exon of IGFBP5 from NCI-H1435 and HCC15 cell lines were amplified with PCR and were sequenced. The red arrows indicate the mutation (G to T) in the NCI-H1435 cell line. HCC15 cells contain wt IGFBP5. (G) NCI-H1435 cell line is sensitive to IGF-1R inhibitor, BMS-536924. NCI-H1435 and HCC15 NSCLC cell lines were seeded overnight in 6 well plates at the same density. After 48 hours treatment with BMS-536924 or Sunitinib, 6 well plates were fixed with methanol and then were stained with crystal violet.
Figure 5
Figure 5
mTORC1 orchestrates feedback inhibition of IGF-1 signaling by promoting HIF1α-dependent expression of IGFBP5. IGFBP5 accumulates in the extracellular space, and sequesters IGF-1 from binding to its cognate receptor (IGF-1R). mTORC1 also inhibits IGF-1 signaling by upregulating the expression of Grb10, and downregulating the expression of IRS and IGF-1R. Both Grb10 and IGFBP5 are potential tumor suppressors. Conversely, IGF-1R and PI3K is activated in mTORC1-suppressed conditions (e.g. rapamycin-treated), due to the relief of mTORC1-mediated feedback inhibition loops. Red and gray indiate proteins that are in the activated and repressed states, respectively.

References

    1. Dibble CC, Manning BD. Signal integration by mTORC1 coordinates nutrient input with biosynthetic output. Nat Cell Biol. 2013;15:555–564. - PMC - PubMed
    1. Laplante M, Sabatini DM. mTOR signaling in growth control and disease. Cell. 2012;149:274–293. - PMC - PubMed
    1. Wouters BG, Koritzinsky M. Hypoxia signalling through mTOR and the unfolded protein response in cancer. Nat Rev Cancer. 2008;8:851–864. - PubMed
    1. Sancak Y, et al. The Rag GTPases bind raptor and mediate amino acid signaling to mTORC1. Science. 2008;320:1496–1501. - PMC - PubMed
    1. Ma XM, Blenis J. Molecular mechanisms of mTOR-mediated translational control. Nat Rev Mol Cell Biol. 2009;10:307–318. - PubMed

Publication types

MeSH terms