

Effects of alanine:glyoxylate aminotransferase variants and pyridoxine sensitivity on oxalate metabolism in a cell-based cytotoxicity assay
- PMID: 26854734
- PMCID: PMC5110007
- DOI: 10.1016/j.bbadis.2016.02.004
Effects of alanine:glyoxylate aminotransferase variants and pyridoxine sensitivity on oxalate metabolism in a cell-based cytotoxicity assay
Abstract
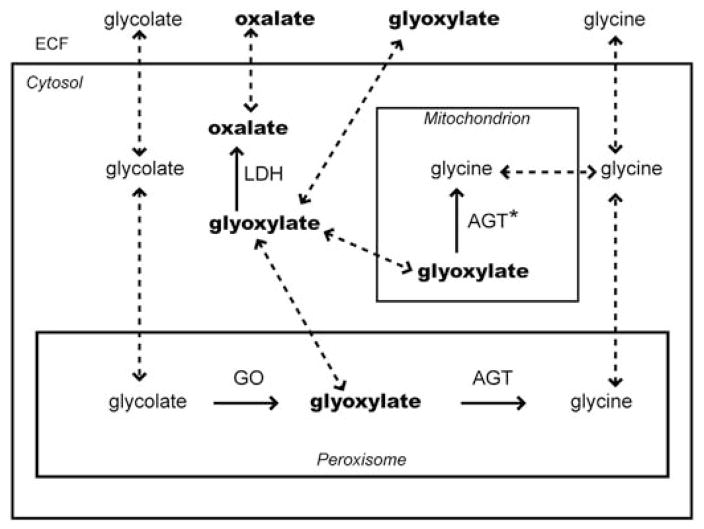
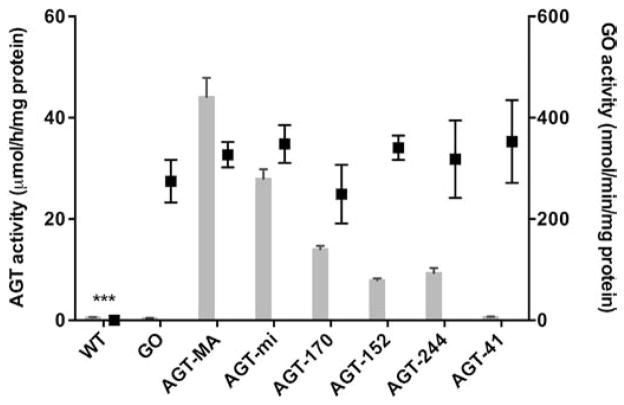
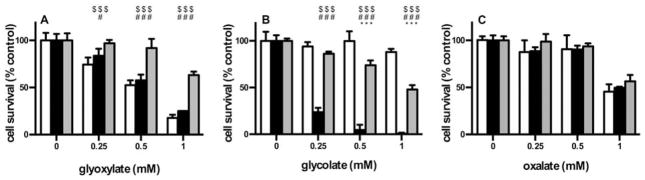
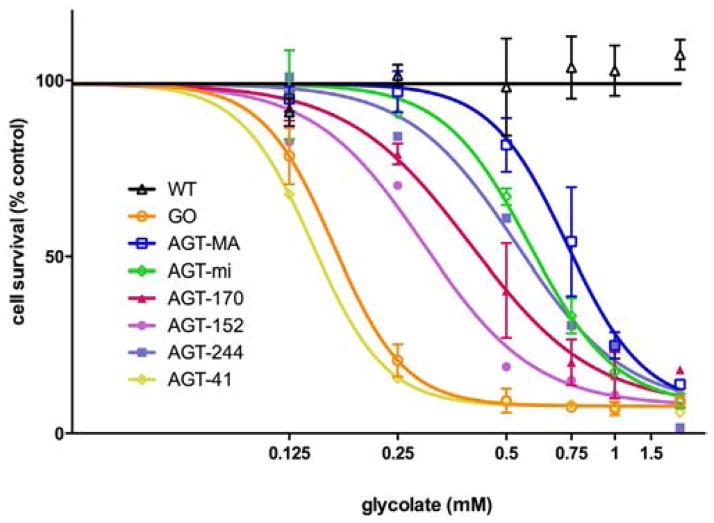
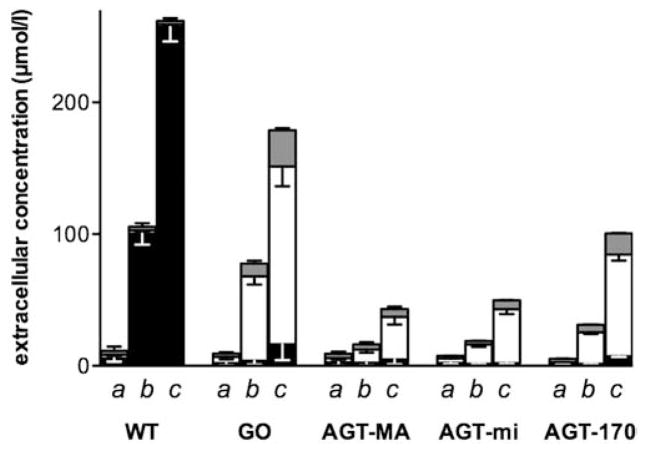
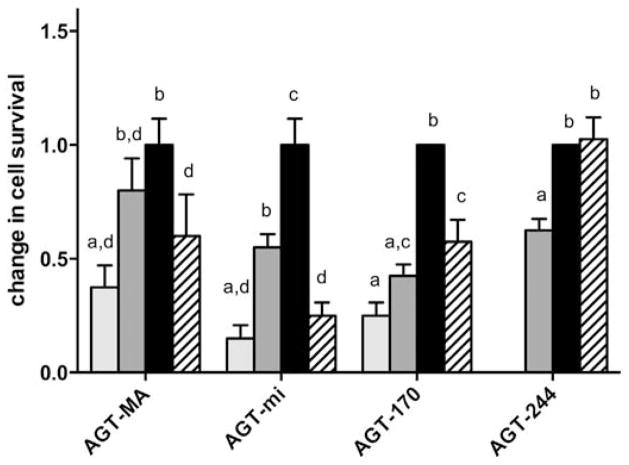
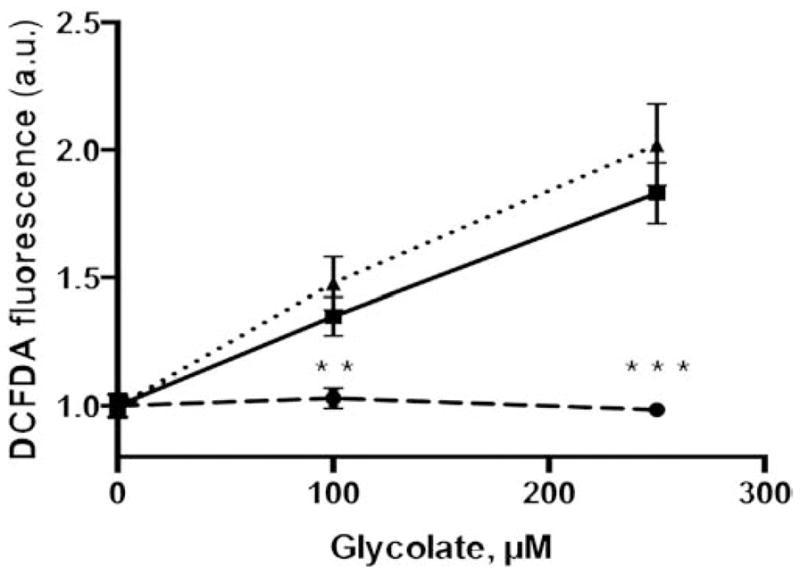
The hereditary kidney stone disease primary hyperoxaluria type 1 (PH1) is caused by a functional deficiency of the liver-specific, peroxisomal, pyridoxal-phosphate-dependent enzyme, alanine:glyoxylate aminotransferase (AGT). One third of PH1 patients, particularly those expressing the p.[(Pro11Leu; Gly170Arg; Ile340Met)] mutant allele, respond clinically to pharmacological doses of pyridoxine. To gain further insight into the metabolic effects of AGT dysfunction in PH1 and the effect of pyridoxine, we established an "indirect" glycolate cytotoxicity assay using CHO cells expressing glycolate oxidase (GO) and various normal and mutant forms of AGT. In cells expressing GO the great majority of glycolate was converted to oxalate and glyoxylate, with the latter causing the greater decrease in cell survival. Co-expression of normal AGTs and some, but not all, mutant AGT variants partially counteracted this cytotoxicity and led to decreased synthesis of oxalate and glyoxylate. Increasing the extracellular pyridoxine up to 0.3μM led to an increased metabolic effectiveness of normal AGTs and the AGT-Gly170Arg variant. The increased survival seen with AGT-Gly170Arg was paralleled by a 40% decrease in oxalate and glyoxylate levels. These data support the suggestion that the effectiveness of pharmacological doses of pyridoxine results from an improved metabolic effectiveness of AGT; that is the increased rate of transamination of glyoxylate to glycine. The indirect glycolate toxicity assay used in the present study has potential to be used in cell-based drug screening protocols to identify chemotherapeutics that might enhance or decrease the activity and metabolic effectiveness of AGT and GO, respectively, and be useful in the treatment of PH1.
Keywords: Alanine:glyoxylate aminotransferase; Glyoxylate; Kidney stones; Oxalate; Primary hyperoxaluria; Pyridoxine.
Copyright © 2016 Elsevier B.V. All rights reserved.
Conflict of interest statement
The authors declare that they have no conflict of interest with the content of this article.
Figures
Similar articles
-
Multiple mechanisms of action of pyridoxine in primary hyperoxaluria type 1.Biochim Biophys Acta. 2013 Oct;1832(10):1776-83. doi: 10.1016/j.bbadis.2013.04.010. Epub 2013 Apr 15. Biochim Biophys Acta. 2013. PMID: 23597595
-
Pyridoxamine and pyridoxal are more effective than pyridoxine in rescuing folding-defective variants of human alanine:glyoxylate aminotransferase causing primary hyperoxaluria type I.Hum Mol Genet. 2015 Oct 1;24(19):5500-11. doi: 10.1093/hmg/ddv276. Epub 2015 Jul 21. Hum Mol Genet. 2015. PMID: 26199318
-
Pharmacologic rescue of an enzyme-trafficking defect in primary hyperoxaluria 1.Proc Natl Acad Sci U S A. 2014 Oct 7;111(40):14406-11. doi: 10.1073/pnas.1408401111. Epub 2014 Sep 18. Proc Natl Acad Sci U S A. 2014. PMID: 25237136 Free PMC article.
-
[From gene to disease; primary hyperoxaluria type I caused by mutations in the AGXT gene].Ned Tijdschr Geneeskd. 2006 Jul 29;150(30):1669-72. Ned Tijdschr Geneeskd. 2006. PMID: 16922352 Review. Dutch.
-
Molecular aetiology of primary hyperoxaluria type 1.Nephron Exp Nephrol. 2004;98(2):e39-44. doi: 10.1159/000080254. Nephron Exp Nephrol. 2004. PMID: 15499210 Review.
Cited by
-
Reduction in urinary oxalate excretion in mouse models of Primary Hyperoxaluria by RNA interference inhibition of liver lactate dehydrogenase activity.Biochim Biophys Acta Mol Basis Dis. 2019 Sep 1;1865(9):2203-2209. doi: 10.1016/j.bbadis.2019.04.017. Epub 2019 May 2. Biochim Biophys Acta Mol Basis Dis. 2019. PMID: 31055082 Free PMC article.
-
4-hydroxy-2-oxoglutarate metabolism in a mouse model of Primary Hyperoxaluria Type 3.Biochem Biophys Rep. 2024 Jun 28;39:101765. doi: 10.1016/j.bbrep.2024.101765. eCollection 2024 Sep. Biochem Biophys Rep. 2024. PMID: 39040543 Free PMC article.
-
Generation of a GLO-2 deficient mouse reveals its effects on liver carbonyl and glutathione levels.Biochem Biophys Rep. 2021 Sep 20;28:101138. doi: 10.1016/j.bbrep.2021.101138. eCollection 2021 Dec. Biochem Biophys Rep. 2021. PMID: 34584990 Free PMC article.
-
Recovery From Dialysis in Patients With Primary Hyperoxaluria Type 1 Treated With Pyridoxine: A Report of 3 Cases.Am J Kidney Dis. 2021 May;77(5):816-819. doi: 10.1053/j.ajkd.2020.07.017. Epub 2020 Sep 4. Am J Kidney Dis. 2021. PMID: 32891627 Free PMC article.
-
Effect of alanine supplementation on oxalate synthesis.Biochim Biophys Acta Mol Basis Dis. 2021 Jan 1;1867(1):165981. doi: 10.1016/j.bbadis.2020.165981. Epub 2020 Sep 28. Biochim Biophys Acta Mol Basis Dis. 2021. PMID: 33002578 Free PMC article.
References
-
- Danpure CJ, Jennings PR. Peroxisomal alanine:glyoxylate aminotransferase deficiency in primary hyperoxaluria type I. FEBS Lett. 1986;201:20–24. - PubMed
-
- Williams EL, Acquaviva C, Amoroso A, Chevalier F, Coulter-Mackie M, Monico CG, Giachino D, Owen T, Robbiano A, Salido E, Waterham H, Rumsby G. Primary hyperoxaluria type 1: update and additional mutation analysis of the AGXT gene. Hum Mutat. 2009;30:910–917. - PubMed
-
- Hopp K, Cogal AG, Bergstralh EJ, Seide BM, Olson JB, Meek AM, Lieske JC, Milliner DS, Harris PC. Phenotype–genotype correlations and estimated carrier frequencies of primary hyperoxaluria. JASN. 2015 http://dx.doi.org/10.1681/ASN.2014070698. - DOI - PMC - PubMed
-
- Oppici E, Montioli R, Cellini B. Liver peroxisomal alanine:glyoxylate aminotransferase and the effects of mutations associated with primary hyperoxaluria type I: an overview. Biochim Biophys Acta. 2015 http://dx.doi.org/10.1016/j.bbapap.2014.12.029. - DOI - PubMed
-
- Gibbs DA, Watts RW. The action of pyridoxine in primary hyperoxaluria. Clin Sci. 1970;38:277–286. - PubMed
Publication types
MeSH terms
Substances
Supplementary concepts
Grants and funding
LinkOut - more resources
Full Text Sources
Other Literature Sources
Miscellaneous
