. 2016 Mar;48(3):245-52.
doi: 10.1038/ng.3506. Epub 2016 Feb 8.

Integrative approaches for large-scale transcriptome-wide association studies

Affiliations

Integrative approaches for large-scale transcriptome-wide association studies

Alexander Gusev et al. Nat Genet. 2016 Mar.

Abstract

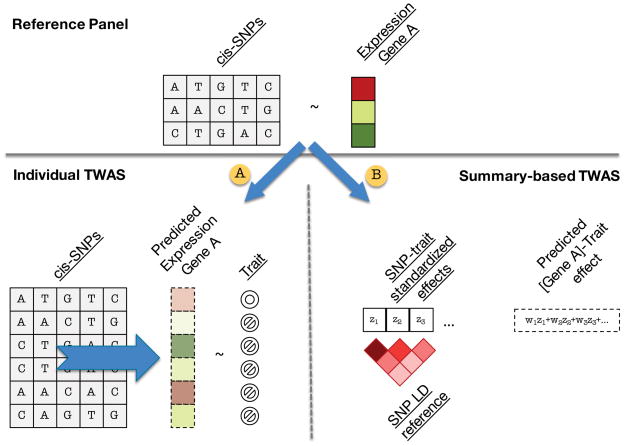
Many genetic variants influence complex traits by modulating gene expression, thus altering the abundance of one or multiple proteins. Here we introduce a powerful strategy that integrates gene expression measurements with summary association statistics from large-scale genome-wide association studies (GWAS) to identify genes whose cis-regulated expression is associated with complex traits. We leverage expression imputation from genetic data to perform a transcriptome-wide association study (TWAS) to identify significant expression-trait associations. We applied our approaches to expression data from blood and adipose tissue measured in ∼ 3,000 individuals overall. We imputed gene expression into GWAS data from over 900,000 phenotype measurements to identify 69 new genes significantly associated with obesity-related traits (BMI, lipids and height). Many of these genes are associated with relevant phenotypes in the Hybrid Mouse Diversity Panel. Our results showcase the power of integrating genotype, gene expression and phenotype to gain insights into the genetic basis of complex traits.


Conflict of interest statement

The authors declare no competing financial interests.

Figures

Figure 1
Figure 1. Overview of methods
Cartoon representation of TWAS approach. In the reference panel (top) estimate gene expression effect-sizes: directly (i.e. eQTL); modeling LD (BLUP); or modeling LD and effect-sizes (BSLMM). A: Predict expression directly into genotyped samples using effect-sizes from the reference panel and measure association between predicted expression and trait. B: Indirectly estimate association between predicted expression and trait as weighted linear combination of SNP-trait standardized effect sizes while accounting for LD among SNPs.
Figure 2
Figure 2. Modes of expression causality
Diagrams are shown for the possible modes of causality for the relationship between genetic markers (SNP, blue), gene expression (GE, green), and trait (red). A–D describes scenarios that would be considered null by the TWAS model; E–G describes scenarios that could be identified as significant.
Figure 3
Figure 3. Number of genes with significant cis-heritability observed at varying sample sizes
The number of genes with significant cis-heritability was estimated by down-sampling each cohort (YFS, METSIM, and NTR/Wright et al.) into quintiles.
Figure 4
Figure 4. Accuracy of direct expression imputation algorithms
Adjusted accuracy was estimated using cross-validation R^2 between prediction and true expression, and normalized by corresponding cis-h2g. Bars show mean estimate across three cohorts and three methods: eQTL – single best cis-eQTL in the locus; BLUP using all SNPs in the locus; BSLMM using all SNPs in the locus and non-infinitesimal priors.
Figure 5
Figure 5. Power of summary-based expression imputation algorithms
Realistic disease architectures were simulated and power to detect a genome-wide significant association evaluated across three methods (accounting for 15,000 eGWAS/TWAS tests, and 1,000,000 GWAS tests). Colors correspond number of causal variants simulated and methods used: GWAS where every SNP in the locus is tested; eGWAS where only the best cis-eQTL is tested; and TWAS computed using summary-statistics. Expression reference panel was fixed at 1,000 out-of-sample individuals and simulated GWAS sample size designated by x-axis. Power was computed as the fraction of 500 simulations where significant association was identified.

Comment in

References

    1. Visscher PM, Brown MA, McCarthy MI, Yang J. Five years of GWAS discovery. Am J Hum Genet. 2012;90:7–24. - PMC - PubMed
    1. Yang J, et al. Conditional and joint multiple-SNP analysis of GWAS summary statistics identifies additional variants influencing complex traits. Nat Genet. 2012;44:369–75. S1–3. - PMC - PubMed
    1. Lee D, Bigdeli TB, Riley BP, Fanous AH, Bacanu SA. DIST: direct imputation of summary statistics for unmeasured SNPs. Bioinformatics. 2013;29:2925–7. - PMC - PubMed
    1. Pasaniuc B, et al. Fast and accurate imputation of summary statistics enhances evidence of functional enrichment. Bioinformatics. 2014;30:2906–14. - PMC - PubMed
    1. Global Lipids Genetics C et al. Discovery and refinement of loci associated with lipid levels. Nat Genet. 2013;45:1274–83. - PMC - PubMed

Publication types