. 2016 May:279:40-56.
doi: 10.1016/j.expneurol.2016.02.005. Epub 2016 Feb 24.

Longitudinal measures of cognition in the Ts65Dn mouse: Refining windows and defining modalities for therapeutic intervention in Down syndrome

Affiliations

Longitudinal measures of cognition in the Ts65Dn mouse: Refining windows and defining modalities for therapeutic intervention in Down syndrome

J Luis Olmos-Serrano et al. Exp Neurol. 2016 May.

Abstract

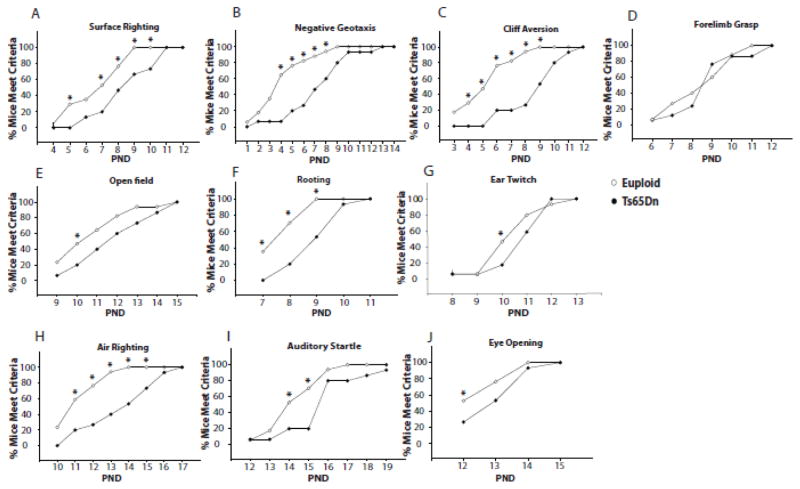
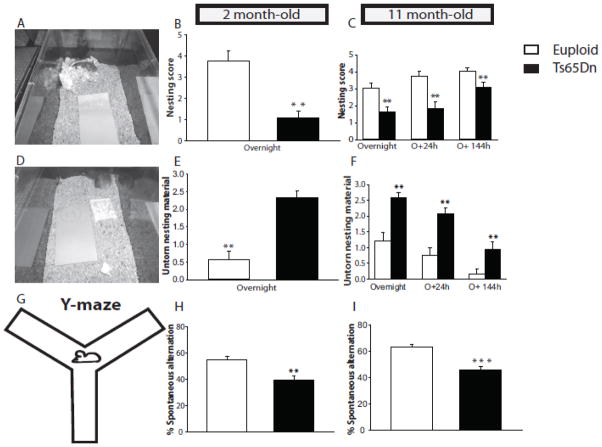
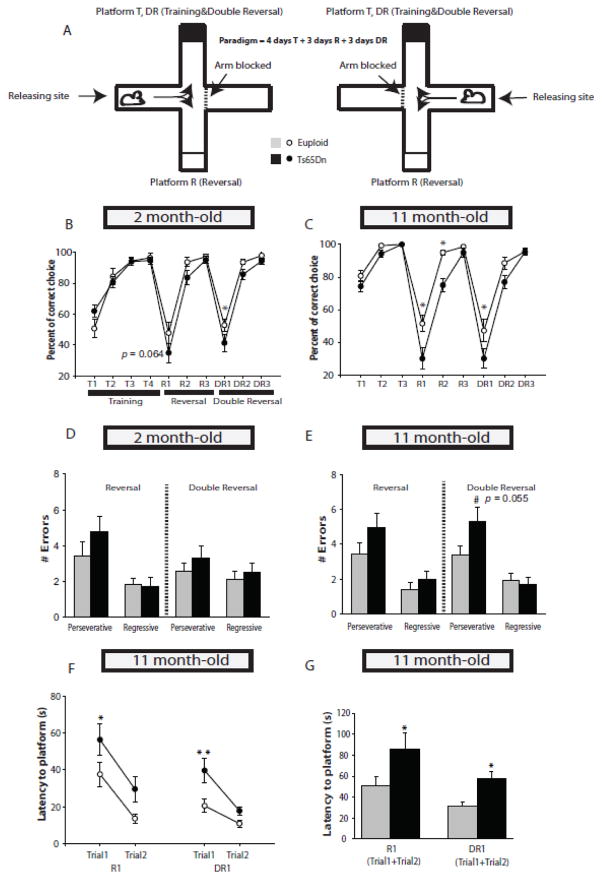
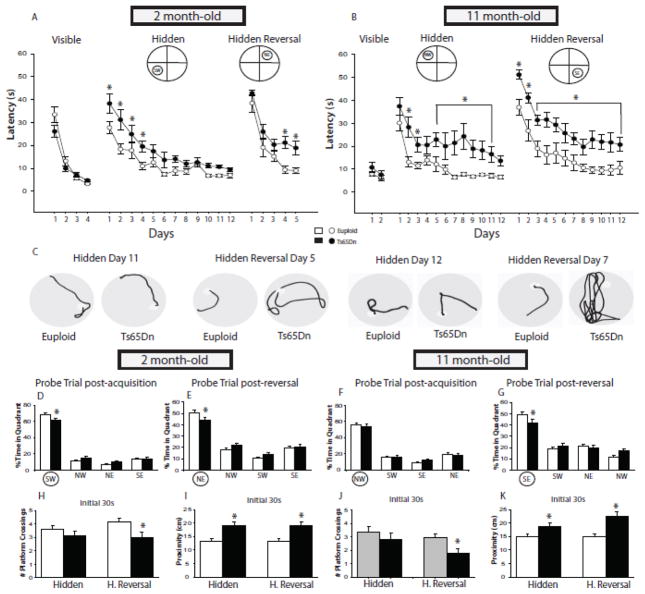
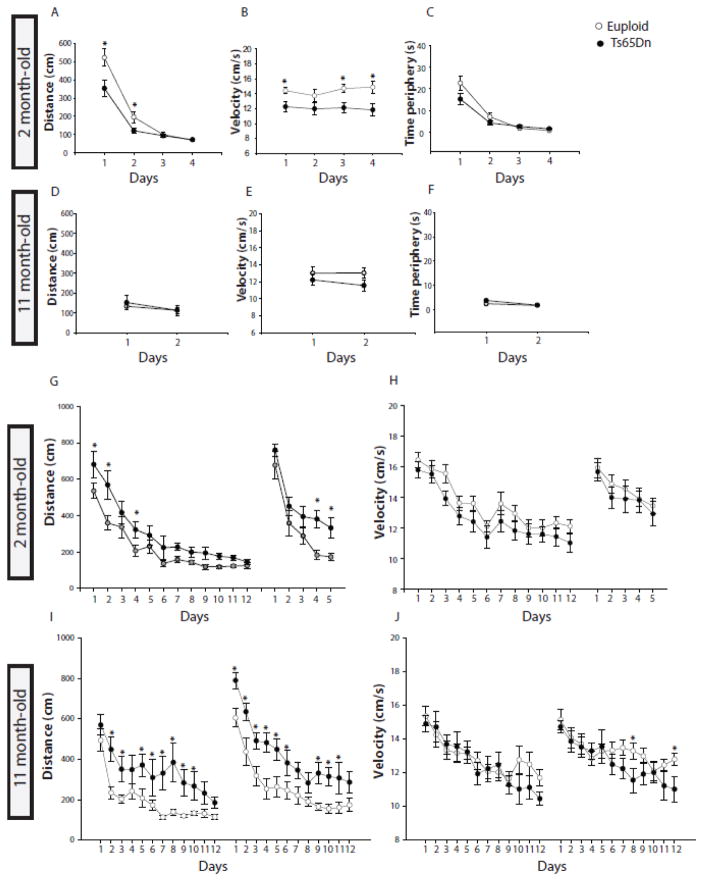
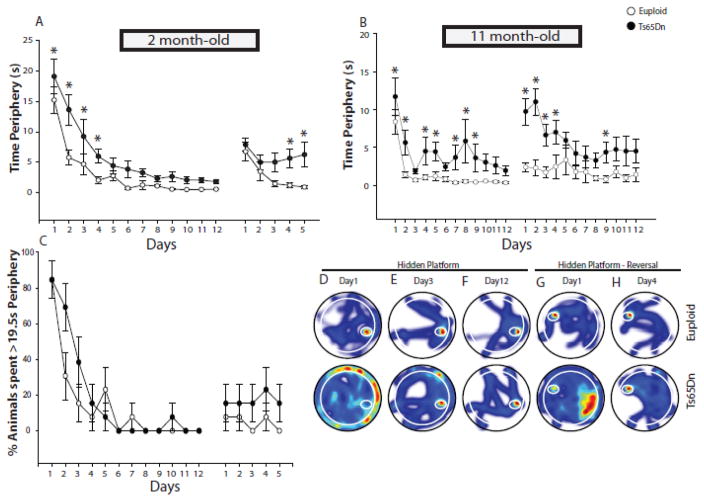
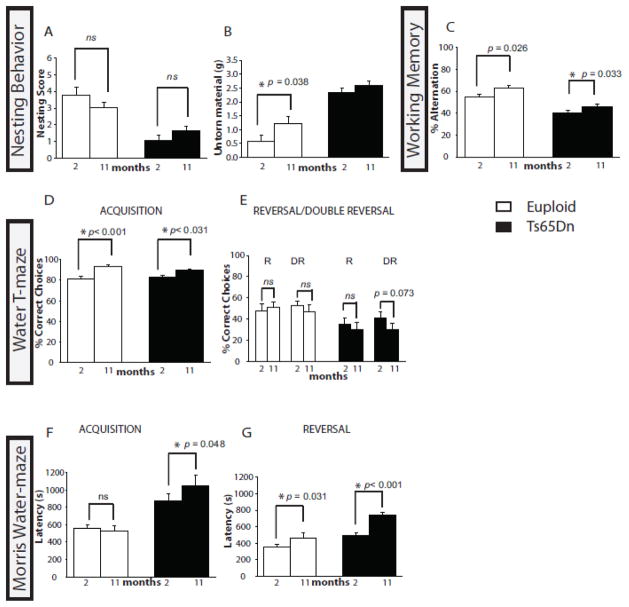
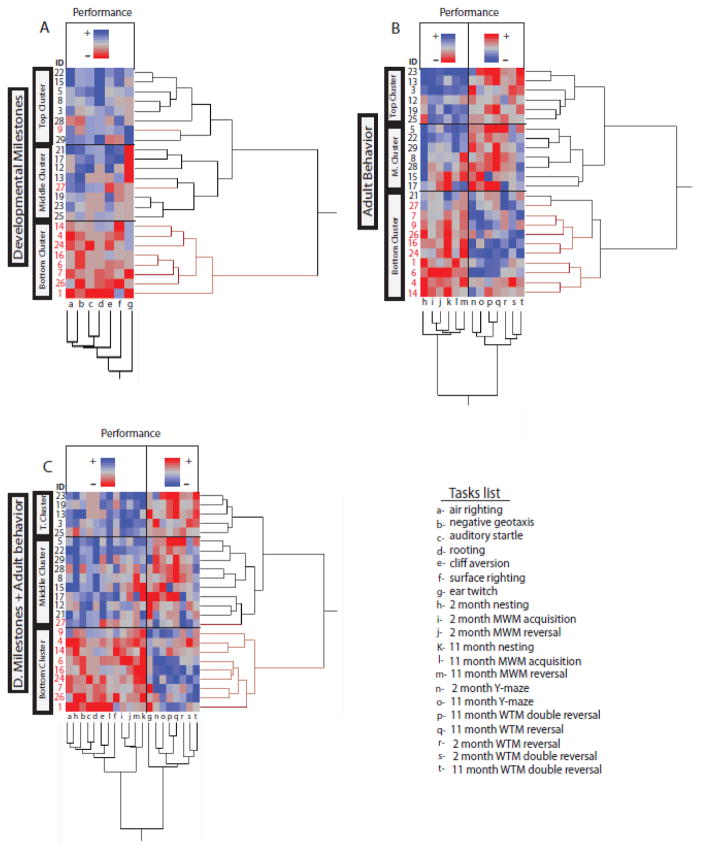
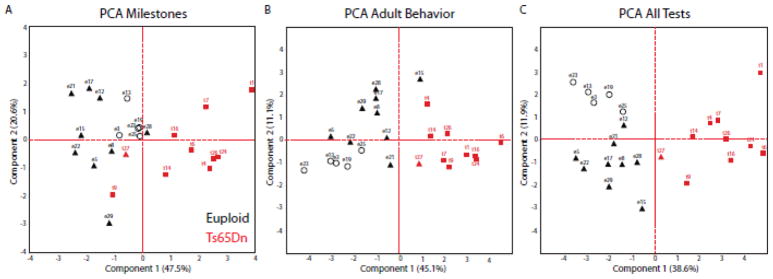
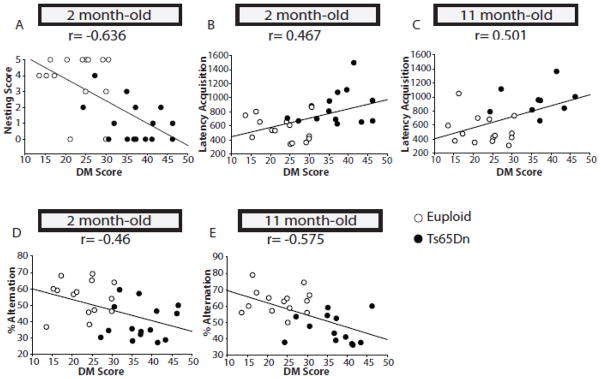
Mouse models have provided insights into adult changes in learning and memory in Down syndrome, but an in-depth assessment of how these abnormalities develop over time has never been conducted. To address this shortcoming, we conducted a longitudinal behavioral study from birth until late adulthood in the Ts65Dn mouse model to measure the emergence and continuity of learning and memory deficits in individuals with a broad array of tests. Our results demonstrate for the first time that the pace at which neonatal and perinatal milestones are acquired is correlated with later cognitive performance as an adult. In addition, we find that life-long behavioral indexing stratifies mice within each genotype. Our expanded assessment reveals that diminished cognitive flexibility, as measured by reversal learning, is the most robust learning and memory impairment in both young and old Ts65Dn mice. Moreover, we find that reversal learning degrades with age and is therefore a useful biomarker for studying age-related decline in cognitive ability. Altogether, our results indicate that preclinical studies aiming to restore cognitive function in Ts65Dn should target both neonatal milestones and reversal learning in adulthood. Here we provide the quantitative framework for this type of approach.

Keywords: Aging; Alzheimer Disease; Cognition; Developmental disorder; Developmental milestones; Down syndrome; Mouse behavior; Mouse model; Reversal learning; Ts65Dn.


Figures

Figure 1
Figure 1. Developmental milestones of Ts65Dn versus euploid mice
A–J, Early and late-acquisition developmental milestones of surface righting (A), negative geotaxis (B), cliff aversion (C), forelimb grasp (D), open field (E), rooting (F), ear twitch (G), air righting (H), auditory startle (I) and eye opening (J). Each task was assessed at specific time-window during postnatal development and each dot represents the percentage of animals that acquired the developmental milestone on a specific postnatal day. Fischer Exact test was used to examine statistically significant differences between genotypes at each postnatal day (Euploid, n = 17, Ts65Dn, n = 15). PND, postnatal day. *p< 0.05.
Figure 2
Figure 2. Innate behaviors of Ts65Dn versus euploid mice
A, D, Representatives images of nesting abilities within 15 h (overnight) upon providing nesting material into the cage. A well-built nest in a euploid cage is illustrated in A, while a largely intact nestlet is illustrated in the Ts65Dn cage in D. B, C, Nesting abilities of 2 month and 11 month-old Ts65Dn and control mice. E, F, Represents the ability of tear nesting material in a novel cage by measuring the weight of the untorn material overnight at 2 months of age and up to 6 days at 11 months of age. G, Cartoon depicting the Y-maze employed to assess spontaneous alternation. H, I, The percentage of spontaneous alternation is reduced in ts65Dn animals at 2 months of age (H) and at 11 months of age (I). In each graph, the bars represent the mean± SEM. Statistical analyses were performed using non-parametric Mann-Whitney Rank Sum test for nesting scale score and two-tailed Student’s t test analysis for untorn nesting material and spontaneous alternation. Euploid2month, n = 14, Ts65Dn2month, n = 15. Euploid11month, n = 14, Ts65Dn11month, n = 13. *p< 0.05.
Figure 3
Figure 3. Water T-maze spatial learning and memory performance of Ts65Dn versus euploid mice
A, Cartoons depicting the cross-maze and the experimental design employed for the water T-maze paradigm. Each mouse performed 10 trials per day and on each trial the platform was in one of two possible locations. The correct choice per trial was score as 1 and, wrong choice was scored as 0. Percentage of correct choices was calculated for each day for each mouse. B, C, The percentage of correct choices over time are shown for the training phase (days T1–T4), the reversal phase (days R1–R3) and the double reversal phase (DR1–DR3) at both 2 and 11 months of age. Note that one Ts65Dn mouse was discarded as an outlier for the reversal and double reversal phase. D, E, The number and type of perseverative errors (errors made before finding the platform) and regressive errors (errors made after finding the platform) were measured at 2 and 11 months of age. F, G, The latency to find the new location of the platform during trial 1 and 2 of the reversal and double reversal on day 1 of testing was significantly longer in Ts65Dn animals. Euploid2month, n = 14, Ts65Dn2monthtraining, n = 15, Ts65Dn2monthreversal&doublereversal, n = 14, Euploid11month, n = 14, Ts65Dn11monthtraining&reversal, n = 14, Ts65Dn11monthdoublereversal, n = 13. *p< 0.05.
Figure 4
Figure 4. MWM spatial learning and memory performance of Ts65Dn versus euploid mice
A, B, Escape latencies were measured over a number protracted of days at 2 (A) and 11 months of age (B). All animals progressed through visible, hidden platform and hidden platform reversal components. Platform locations are denoted. C, Representative traces of swimming-paths from euploid and Ts65Dn mice during hidden and hidden reversal learning. D–G, The graphs show percentages of time spent in each quadrant during the probe test after hidden and hidden reversal at 2 and 11 months of age. H, K, Proximity defined as mean average distance to the platform is plotted at 2 and 11 months of age. I, J, The number of virtual platform crossings is plotted at 2 and 11 months of age. These parameters were assessed in the initial thirty seconds and in the entire sixty seconds of the test. Each dot represents the mean± SEM. In each graph, the bars represent the mean± SEM. Euploid2month, n = 14, Ts65Dn2monthcued&probetrial, n = 15, Ts65Dn2monthhidden&hiddenreversal, n = 14; Euploid11month, n = 14, Ts65Dn11monthcued, n = 12, Ts65Dn11monthhidden&hiddenreversal&probetrial, n = 10. *p< 0.05; **p< 0.01.
Figure 5
Figure 5. MWM swimming velocity and distance in Ts65Dn versus euploid mice
AF, Swimming distance (A, D), swimming velocity (B, E) and time spent in the periphery (C,F) over a number of days at 2 months (A–C) and 11 months of age (D–F) during cued training. G–J, Swimming distance (G, I) and swimming velocity (H, J) over a number of days at 2 months (G, H) and 11 months of age (I, J) during the hidden platform period. Each dot represents the mean± SEM. In each graph, the bars represent the mean± SEM. Euploid2month, n = 14, Ts65Dn2monthcued&probetrial, n = 15, Ts65Dn2monthhidden&hiddenreversal, n = 14; Euploid11month, n = 14, Ts65Dn11monthcued, n = 12, Ts65Dn11monthhidden&hiddenreversal&probetrial, n = 10. *p< 0.05.
Figure 6
Figure 6. Analysis of thigmotaxis in MWM spatial learning and memory performance
A, B, Total time spent in the periphery of the tank on each day over a number of days at 2 months (A) and 11 months of age (B) during hidden and hidden reversal platform periods. C, The percentage of animals that spent more than 19.5 sec to find the platform during hidden platform at 2 months of age. D–H, Heatmaps plotted as a range of location frequency averaging the four trials per day. Euploid and Ts65D swimming paths are depicted for day 1, 3 and 12 during hidden platform period (D–F) and on days 1 and 4 during hidden reversal period (G, H). *p< 0.05.
Figure 7
Figure 7. Age comparisons between euploid and Ts65Dn mice
A, B, Comparison of nesting score and the ability to tear nesting material at 2 and 11 months of age between euploids and Ts65Dn. C, Comparison of spontaneous alternation at 2 and 11 eleven months of age between euploids and Ts65Dn. D, E, Comparison of the percentage of correct choices during acquisition (D), reversal and double reversal (E) at 2 and 11 months of age between euploids and Ts65Dn. F, G, Comparisons of total escape latencies during acquisition and reversal at 2 and 11 months of age (F and G, respectively). In each graph, the bars represent the mean± SEM. *p< 0.05. **p< 0.01. Euploid2&11monthnesting, n = 14; Ts65Dn2monthnesting, n = 15, Ts65Dn11monthnesting, n = 13; Euploid2&11monthspontaneousalternation, n = 14, Ts65Dn2monthspotaneousalternation, n = 15, Ts65Dn11monthspontaneousalternation, n = 13; for WTM, Euploid2&11month, n = 14, Ts65Dn2monthtraining, n = 15, Ts65Dn2monthreversal&doublereversal, n = 14, Ts65Dn11monthtraining&reversal, n = 14, Ts65Dn11monthdoublereversal, n = 13; for MWM, Euploid2&11month, n =14, Ts65Dn2monthcued&probetrial, n = 15, Ts65Dn2monthhidden&hiddenreversal, n = 14, Ts65Dn11monthcued, n = 12, Ts65Dn11monthhidden&hiddenreversal&probetrial, n = 10.
Figure 8
Figure 8. Hierarchical cluster analysis of behavioral performance in euploids and Ts65Dn
A–C, Dendograms and heatmaps from the two-way hierarchical cluster analysis of performance in the battery of developmental milestones (A), adult behavior (B) and developmental milestones plus adult behavior combined (C) tasks. Tasks lists are listed along the x-axis of the heat map. The 3-clusters are emphasized by the boxes at the left of the figure. Euploid, n = 14, Ts65Dn, n = 10.
Figure 9
Figure 9. Principal Component Analysis of behavioral performance in euploids and Ts65Dn
A–C, Comparisons between genotypes with respect to the PCA Milestones (A), PCA Adult Behavior (B) and PCA All tests (C). Black = Euploid, Red = Ts65Dn. Triangles and circles represent subsets of clusters within euploids. Euploids = 14, Ts65Dn = 10.
Figure 10
Figure 10. Correlations between developmental milestones and adult behaviors
A, Graph representing a negative correlation between developmental milestones achievement and nesting behavior at 2 month of age. B, E, Graphs representing a positive correlation between developmental milestones achievement and total latency during acquisition period at 2 (B) and 11 (E) months of age. C, D, Graphs representing a negative correlation between developmental milestones achievement and percentage of spontaneous alternation at 2 (C) and 11 (D) months of age. Euploid = 14. Ts65Dn = 15 in A,D; Ts65Dn = 14 in B; Ts65Dn = 9 in C; Ts65Dn = 13 in E.

Similar articles

Cited by

References

    1. Albert MS. Cognitive and neurobiologic markers of early Alzheimer disease. Proc Natl Acad Sci U S A. 1996;93:13547–13551. - PMC - PubMed
    1. Altafaj X, Martin ED, Ortiz-Abalia J, Valderrama A, Lao-Peregrin C, Dierssen M, Fillat C. Normalization of Dyrk1A expression by AAV2/1-shDyrk1A attenuates hippocampal-dependent defects in the Ts65Dn mouse model of Down syndrome. Neurobiol Dis. 2013;52:117–127. - PubMed
    1. Alvarez JA, Emory E. Executive function and the frontal lobes: a meta-analytic review. Neuropsychology review. 2006;16:17–42. - PubMed
    1. Branchi I, Curley JP, D’Andrea I, Cirulli F, Champagne FA, Alleva E. Early interactions with mother and peers independently build adult social skills and shape BDNF and oxytocin receptor brain levels. Psychoneuroendocrinology. 2013;38:522–532. - PMC - PubMed
    1. Breslin J, Spano G, Bootzin R, Anand P, Nadel L, Edgin J. Obstructive sleep apnea syndrome and cognition in Down syndrome. Developmental medicine and child neurology. 2014;56:657–664. - PubMed

Publication types

MeSH terms