

Metabolite Profiling and Stable Isotope Tracing in Sorted Subpopulations of Mammalian Cells
- PMID: 26855138
- PMCID: PMC8253378
- DOI: 10.1021/acs.analchem.5b04071
Metabolite Profiling and Stable Isotope Tracing in Sorted Subpopulations of Mammalian Cells
Abstract
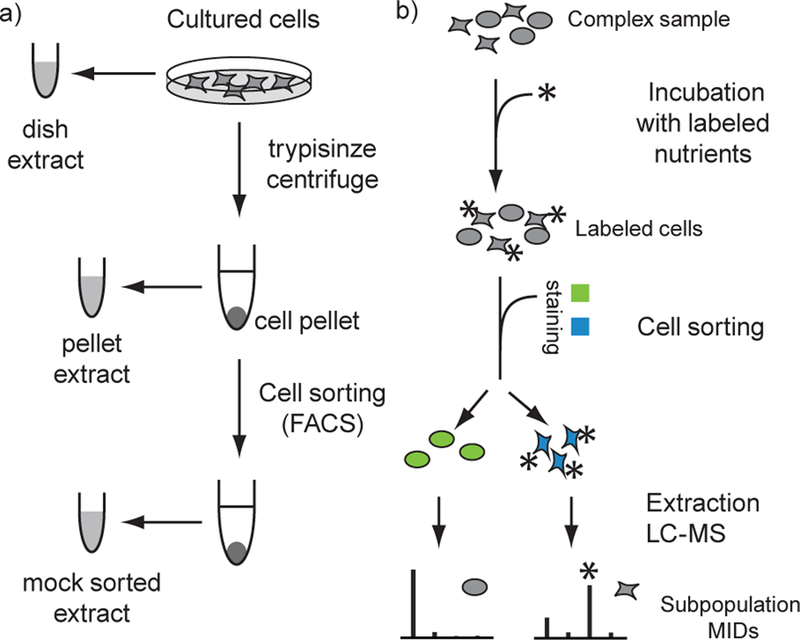
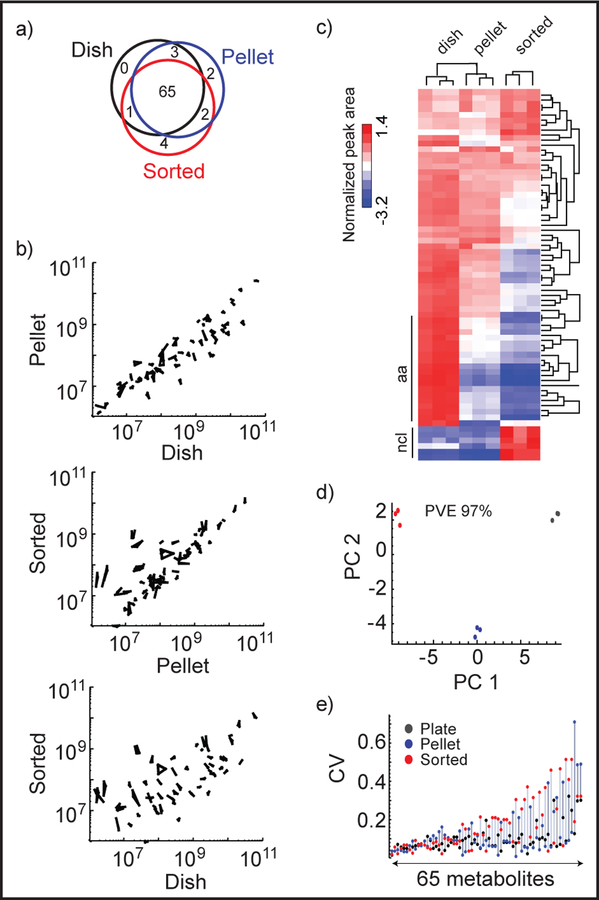
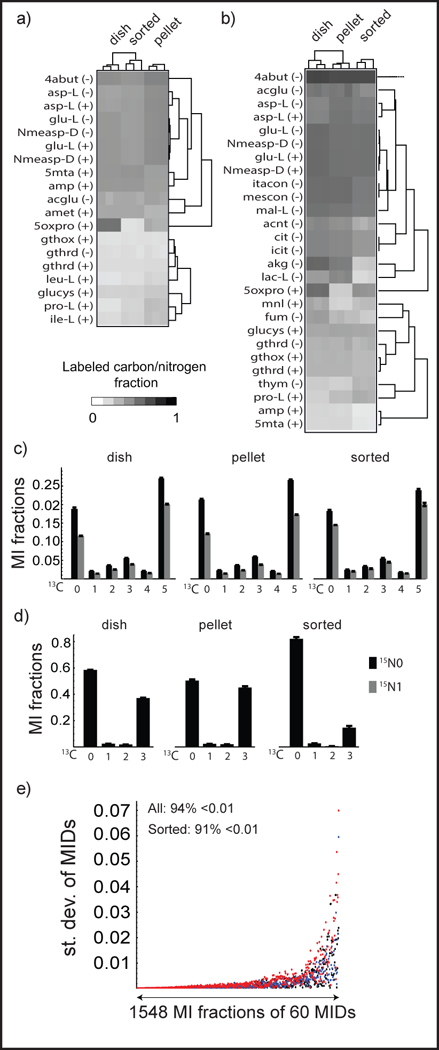
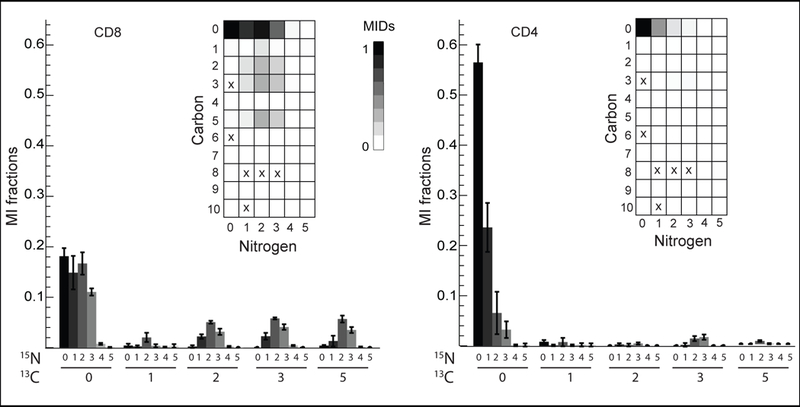
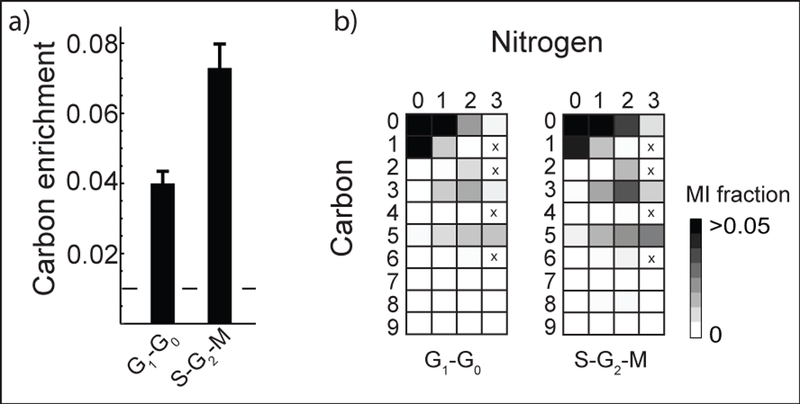
Biological samples such as tissues, blood, or tumors are often complex and harbor heterogeneous populations of cells. Separating out specific cell types or subpopulations from such complex mixtures to study their metabolic phenotypes is challenging because experimental procedures for separation may disturb the metabolic state of cells. To address this issue, we developed a method for analysis of cell subpopulations using stable isotope tracing and fluorescence-activated cell sorting followed by liquid chromatography-high-resolution mass spectrometry. To ensure a faithful representation of cellular metabolism after cell sorting, we benchmarked sorted extraction against direct extraction. While peak areas differed markedly with lower signal for amino acids but higher signal for nucleotides, mass isotopomer distributions from sorted cells were generally in good agreement with those obtained from direct extractions, indicating that they reflect the true metabolic state of cells prior to sorting. In proof-of-principle studies, our method revealed metabolic phenotypes specific to T cell subtypes, and also metabolic features of cells in the committed phase of the cell division cycle. Our approach enables studies of a wide range of adherent and suspension cell subpopulations, which we anticipate will be of broad importance in cell biology and biomedicine.
Figures
Similar articles
-
A Method for Measuring Metabolism in Sorted Subpopulations of Complex Cell Communities Using Stable Isotope Tracing.J Vis Exp. 2017 Feb 4;(120):55011. doi: 10.3791/55011. J Vis Exp. 2017. PMID: 28190056 Free PMC article.
-
Chloroformate derivatization for tracing the fate of Amino acids in cells and tissues by multiple stable isotope resolved metabolomics (mSIRM).Anal Chim Acta. 2017 Jul 11;976:63-73. doi: 10.1016/j.aca.2017.04.014. Epub 2017 Apr 10. Anal Chim Acta. 2017. PMID: 28576319 Free PMC article.
-
Simultaneous tracing of carbon and nitrogen isotopes in human cells.Mol Biosyst. 2016 May 24;12(6):1929-37. doi: 10.1039/c6mb00009f. Mol Biosyst. 2016. PMID: 27098229 Free PMC article.
-
Applications of NMR spectroscopy to systems biochemistry.Prog Nucl Magn Reson Spectrosc. 2016 Feb;92-93:18-53. doi: 10.1016/j.pnmrs.2016.01.005. Epub 2016 Feb 6. Prog Nucl Magn Reson Spectrosc. 2016. PMID: 26952191 Free PMC article. Review.
-
Current state-of-the-art of nontargeted metabolomics based on liquid chromatography-mass spectrometry with special emphasis in clinical applications.J Chromatogr A. 2014 Dec 29;1374:1-13. doi: 10.1016/j.chroma.2014.11.050. Epub 2014 Nov 23. J Chromatogr A. 2014. PMID: 25444251 Review.
Cited by
-
Acidity suppresses CD8 + T-cell function by perturbing IL-2, mTORC1, and c-Myc signaling.EMBO J. 2024 Nov;43(21):4922-4953. doi: 10.1038/s44318-024-00235-w. Epub 2024 Sep 16. EMBO J. 2024. PMID: 39284912 Free PMC article.
-
Adenylosuccinate lyase is oncogenic in colorectal cancer by causing mitochondrial dysfunction and independent activation of NRF2 and mTOR-MYC-axis.Theranostics. 2021 Feb 15;11(9):4011-4029. doi: 10.7150/thno.50051. eCollection 2021. Theranostics. 2021. PMID: 33754045 Free PMC article.
-
A Method for Measuring Metabolism in Sorted Subpopulations of Complex Cell Communities Using Stable Isotope Tracing.J Vis Exp. 2017 Feb 4;(120):55011. doi: 10.3791/55011. J Vis Exp. 2017. PMID: 28190056 Free PMC article.
-
PERK is a critical metabolic hub for immunosuppressive function in macrophages.Nat Immunol. 2022 Mar;23(3):431-445. doi: 10.1038/s41590-022-01145-x. Epub 2022 Feb 28. Nat Immunol. 2022. PMID: 35228694 Free PMC article.
-
Noninvasive rapid detection of metabolic adaptation in activated human T lymphocytes by hyperpolarized 13C magnetic resonance.Sci Rep. 2020 Jan 13;10(1):200. doi: 10.1038/s41598-019-57026-1. Sci Rep. 2020. PMID: 31932697 Free PMC article.
References
Publication types
MeSH terms
Substances
Grants and funding
LinkOut - more resources
Full Text Sources
Other Literature Sources
