. 2016 Mar;22(3):278-87.
doi: 10.1038/nm.4038. Epub 2016 Feb 8.

CYP3A5 mediates basal and acquired therapy resistance in different subtypes of pancreatic ductal adenocarcinoma

Affiliations

CYP3A5 mediates basal and acquired therapy resistance in different subtypes of pancreatic ductal adenocarcinoma

Elisa M Noll et al. Nat Med. 2016 Mar.

Abstract

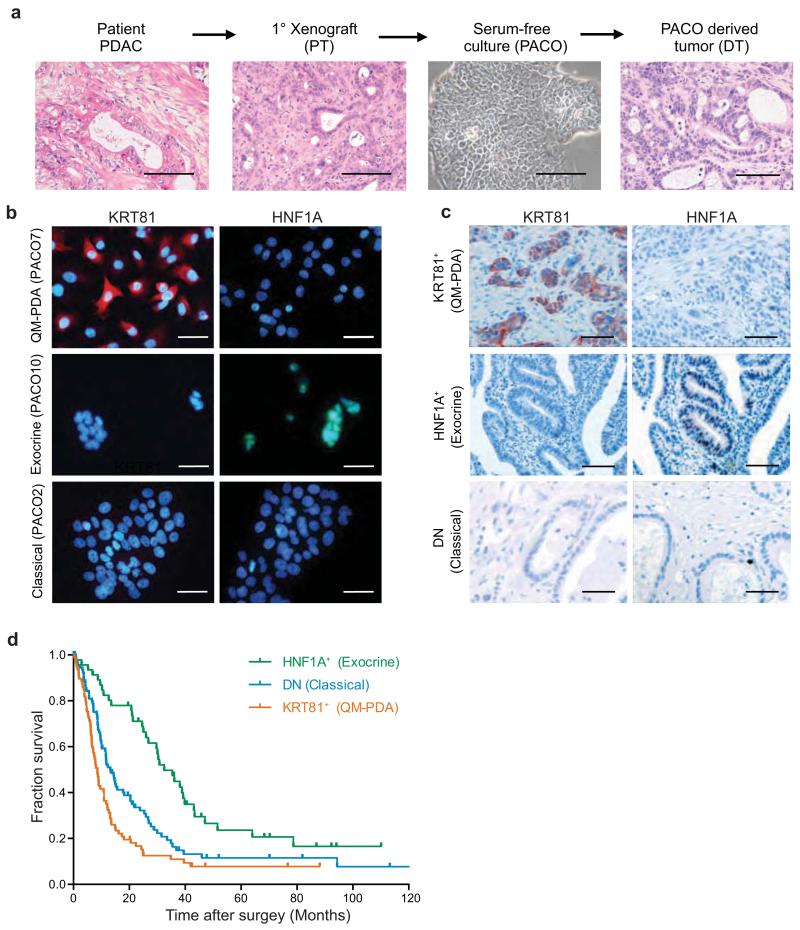
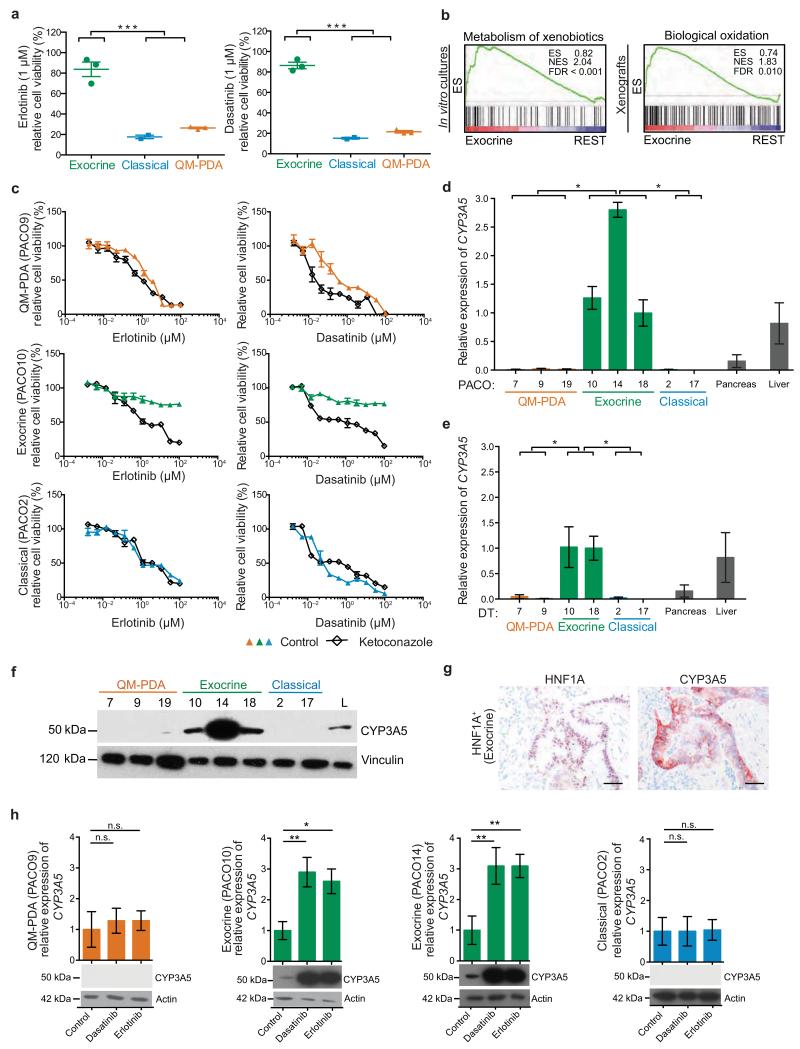
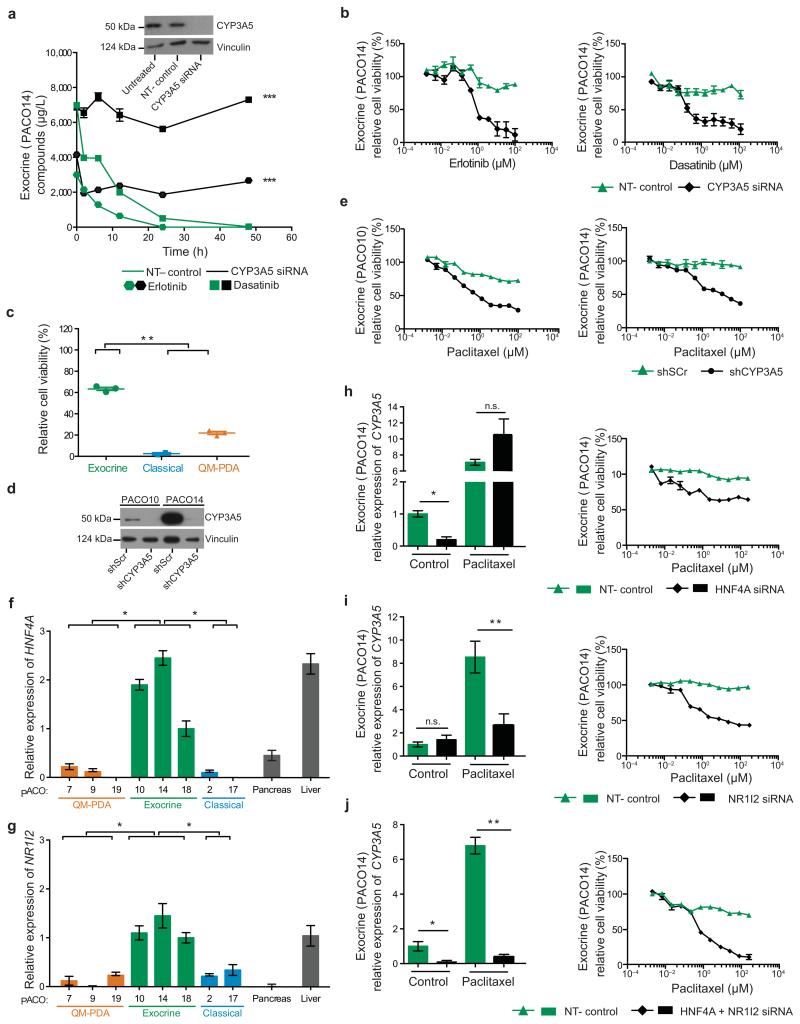
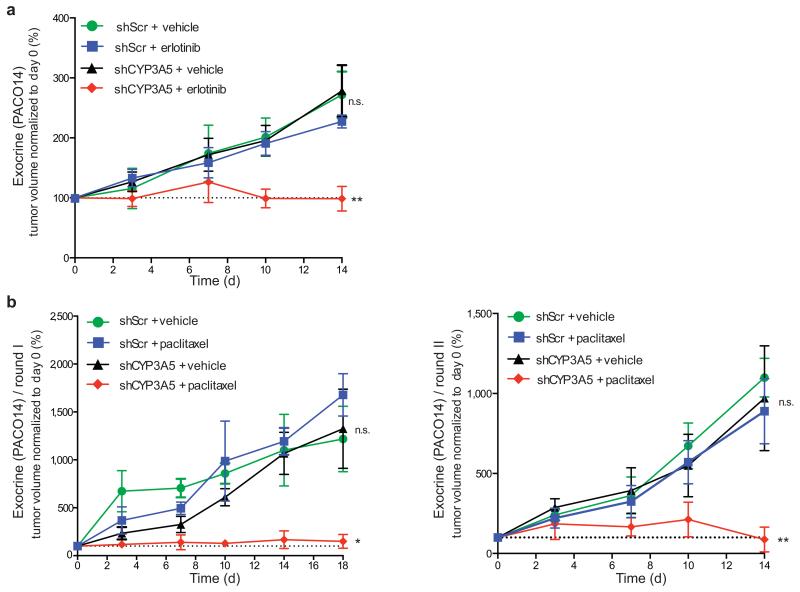
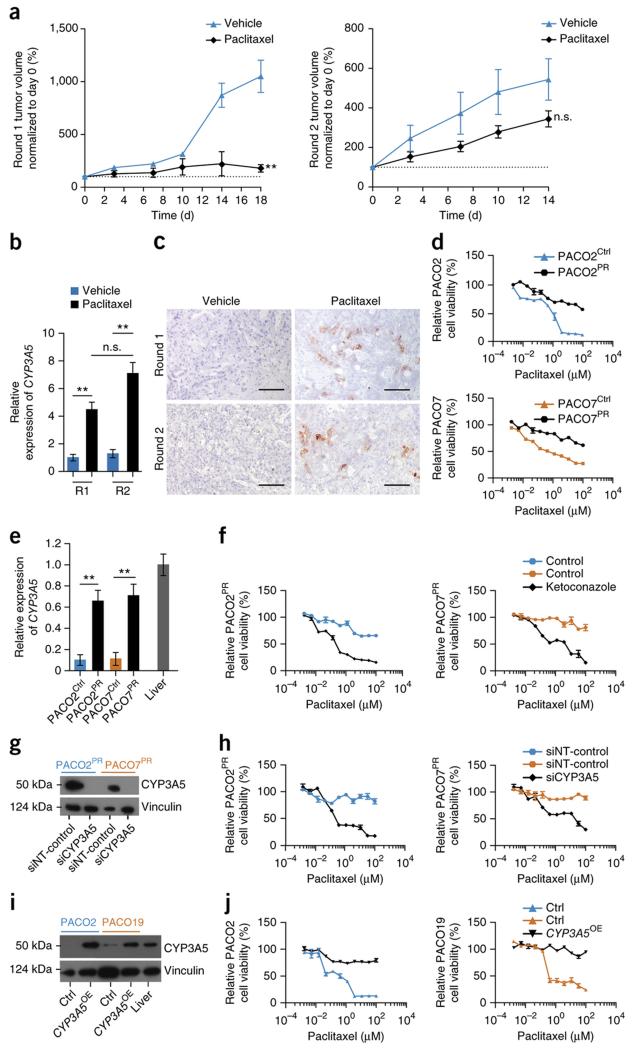
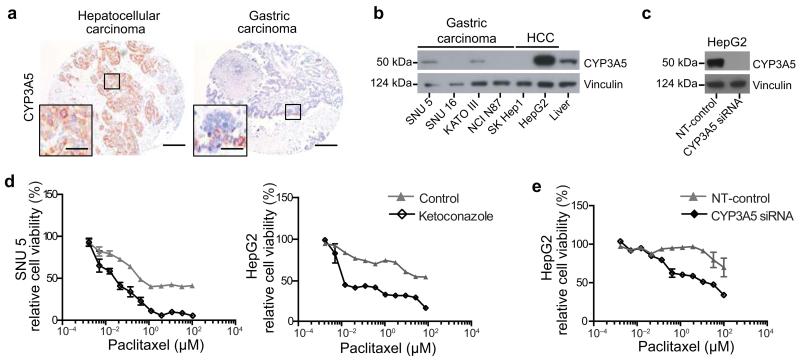
Although subtypes of pancreatic ductal adenocarcinoma (PDAC) have been described, this malignancy is clinically still treated as a single disease. Here we present patient-derived models representing the full spectrum of previously identified quasi-mesenchymal (QM-PDA), classical and exocrine-like PDAC subtypes, and identify two markers--HNF1A and KRT81--that enable stratification of tumors into different subtypes by using immunohistochemistry. Individuals with tumors of these subtypes showed substantial differences in overall survival, and their tumors differed in drug sensitivity, with the exocrine-like subtype being resistant to tyrosine kinase inhibitors and paclitaxel. Cytochrome P450 3A5 (CYP3A5) metabolizes these compounds in tumors of the exocrine-like subtype, and pharmacological or short hairpin RNA (shRNA)-mediated CYP3A5 inhibition sensitizes tumor cells to these drugs. Whereas hepatocyte nuclear factor 4, alpha (HNF4A) controls basal expression of CYP3A5, drug-induced CYP3A5 upregulation is mediated by the nuclear receptor NR1I2. CYP3A5 also contributes to acquired drug resistance in QM-PDA and classical PDAC, and it is highly expressed in several additional malignancies. These findings designate CYP3A5 as a predictor of therapy response and as a tumor cell-autonomous detoxification mechanism that must be overcome to prevent drug resistance.


Figures

Figure 1
Figure 1
Subtype stratification of PDAC models and patients by two markers. (a) Schematic overview of the experimental workflow used to generate orthotopic xenografts and PACO cells. H&E staining of a human PDAC tumor, the corresponding first passage xenograft (PT), phase contrast image of the derived cell line (PACO10) and the respective derived xenograft (DT). Scale bar, 100 μM. (b) KRT81 and HNF1A immunofluorescence staining on PACO lines from the three different subtypes (n = 3). Scale bar, 50 μM. (c) KRT81 and HNF1A immunostaining on sections from a TMA of individuals with PDAC (n = 241). Scale bar, 100 μM. (d) Kaplan-Meier analysis of overall survival of subjects with PDAC (n = 217). Tumor sections on the TMA were retrospectively subtyped into three groups based on KRT81 and HNF1A expression as determined by immunostaining (HNF1A+: n = 46; DN: n = 92; KRT81+: n = 79). P value was determined by log-rank test.
Figure 2
Figure 2
Exocrine-like PDAC, which express CYP3A5, are resistant to TKIs (a) PACO line specific drug sensitivities to 1 μM erlotinib or dasatinib after 48 h. Bars depict mean ± SD (n = 2; ***P < 0.001; grouped one-way ANOVA). (b) Gene set enrichment analysis (GSEA) of the exocrine-like subtype compared to the classical and QM-PDA subtype (REST), using the indicated gene signatures. Left panel: PACO cell lines. Right panel: PT + DT xenografts. Statistical significance was assessed using 10,000 permutations. ES, enrichment score; NES, normalized enrichment score; FDR, false discovery rate. (c) PACO lines treated with erlotinib or dasatinib for 48 h post ketoconazole (100 nM) or vehicle pre-treatment for 2 h (n = 3). (d, e) CYP3A5 expression, as measured by qRT-PCR, in PACO lines (d) and PACO derived xenografts (e) compared to pancreas and liver mRNA. Values are relative to PACO18 mRNA expression and depict mean ± SEM (n = 3; *P < 0.05; grouped one-way ANOVA). (f) Anti-CYP3A5 immunoblot of PACO cell lines. Vinculin was used as loading control. L = liver protein lysate. (g) CYP3A5 and HNF1A immunostainings on PDAC sections from HNF1A+ individuals (n = 217). Scale bar, 100 μM. (h) CYP3A5 expression analysis by qRT-PCR and immunoblot at basal level and in response to 10 μM dasatinib or erlotinib of QM-PDA, exocrine-like and classical PACO lines. Values are relative to untreated controls and depict mean ± SEM (n = 3; *P < 0.05; **P < 0.01; n.s. = not significant, Student’s T-test). Actin was used as loading control for immunoblots.
Figure 3
Figure 3
CYP3A5 mediates drug resistance and is regulated by HNF4A and NR1I2 in exocrine-like cells in vitro (a) Anti-CYP3A5 immunoblot of untreated, non-targeting (NT–control) and CYP3A5 siRNA transfected exocrine-like cells. Vinculin was used as loading control. Compound concentrations in the supernatant of exocrine-like cells transfected with CYP3A5 or NT–control siRNA, followed by treatment with erlotinib or dasatinib (10 μM). Concentrations were determined by LC-MS/MS (n = 6; ***P < 0.001; two-way ANOVA). (b) Exocrine-like cells treated with erlotinib or dasatinib for 48 h, post CYP3A5 or NT–control siRNA transfection (n = 3). (c) PACO line specific sensitivities to 1 μM paclitaxel after 48 h. Bars depict mean ± SD (n = 2; **P < 0.01; grouped one-way ANOVA). (d) Anti-CYP3A5 immunoblot comparing shCYP3A5 with shScr exocrine-like cells. Vinculin was used as loading control. (e) CYP3A5 knockdown or control exocrine-like cells treated with paclitaxel for 48 h (n = 3). (f, g) HNF4A (f) and NR1I2 (g) expression, as measured by qRT-PCR, in PACO lines compared to pancreas and liver mRNA. Values are relative to PACO18 mRNA expression and depict mean ± SEM (n = 3; *P < 0.05; grouped one-way ANOVA). (h-j) CYP3A5 expression in response to 10 μM paclitaxel or DMSO (control) after 48 h of HNF4A- (h), NR1I2- (i) and HNF4A-/NR1I2- double knockdown (j) exocrine-like cells. Values are relative to untreated, NT–control mRNA expression and depict mean ± SEM (n = 3; *P < 0.05; **P < 0.01; n.s. = not significant; Student’s T-test). Exocrine-like cells treated with paclitaxel for 48 h post of HNF4A- (h), NR1I2- (i) and HNF4A-/NR1I2- double knockdown (j) (n = 3).
Figure 4
Figure 4
CYP3A5 mediates drug resistance in exocrine-like PDAC cells in vivo (a) Growth curves of PDAC xenografts from exocrine-like shScr and shCYP3A5 cells, treated for two cycles of 5 days with erlotinib (100 mg/kg) and 2 days recovery. (b) Growth curves of PDAC xenografts from exocrine-like shScr and shCYP3A5 cells treated with two cycles of 5 days paclitaxel (2 mg/kg) and 2 days recovery followed by 4 days of paclitaxel (left panel, round I). Cells from one xenograft per treatment group were re-injected and treated for two cycles of 5 days paclitaxel and 2 days recovery (right panel, round II). Tumor volume was measured with a digital caliper. Shown are tumor volumes normalized to baseline (day 0) and depict mean ± SEM. P values were determined at the end point using one-sided Mann-Whitney U test. (n = 6 mice per treatment group; *P < 0.05; **P < 0.01; n.s. = not significant).
Figure 5
Figure 5
CYP3A5 contributes to acquired resistance in QM-PDA and classical PDAC cells (a) Growth curves of PDAC xenografts derived from classical cells treated as described for (Fig. 4b) round I (left panel, round I). Cells from one xenograft per group were re-injected and treated as described for (Fig. 4b), round II (right panel, round II). (n=6 mice per treatment group; **P < 0.01; n.s. = not significant). (b) CYP3A5 expression, as measured by qRT-PCR, in tumors after paclitaxel or vehicle treatment after the first (RI) and after the second (RII) treatment round. Values are relative to RI vehicle control and depict mean ± SEM (n = 3; **P < 0.01; Student’s T-test). (c) CYP3A5 immunostainings on PACO17 xenograft sections post paclitaxel or vehicle treatment after the first (Round I) and the second (Round II) treatment round (n = 3). Scale bar, 100μM. (d) Parental (PACO2Ctrl, PACO7Ctrl) and paclitaxel-resistant (PACO2PR, PACO7PR) classical and QM-PDA cell lines treated with paclitaxel for 48 h (n = 3). (e) CYP3A5 expression in PACO2Ctrl and PACO7Ctrl cells compared to PACO2PR and PACO7PR cells. Values are relative to liver mRNA and depict mean ± SEM (n = 3; **P < 0.01; Student’s T-test). (f) PACO2PR and PACO7PR cells treated with paclitaxel for 48 h post ketoconazole (100 nM) or vehicle pre-treatment for 2 h (n = 3). (g) Anti-CYP3A5 immunoblot of NT–control or CYP3A5 siRNA transfected PACO2PR and PACO7PR cells. Vinculin was used as loading control. (h) PACO2PR and PACO7PR cells treated with paclitaxel for 48 h post transfection with CYP3A5 or non-targeting (NT-control) siRNA (n = 3). (i) Anti-CYP3A5 immunoblot of classical and QM-PDA cell lines transduced with CYP3A5_OX or Ctrl vectors. Vinculin was used as loading control. (j) CYP3A5_OX- or Ctrl- transduced classical and QM-PDA cell lines treated with paclitaxel for 48 h (n = 3).
Figure 6
Figure 6
CYP3A5 contributes to drug resistance in other malignancies (a) CYP3A5 immunostainings of human hepatocellular and gastric carcinoma paraffin sections from a tissue microarray containing various tumor entities (n = 16). Scale bar, 100 μM; Scale bar, 5 μM. (b) Anti-CYP3A5 immunoblot of four gastric and two hepatocellular (HCC) carcinoma cell lines, compared to total normal liver lysate. Vinculin was used as loading control. (c) Anti-CYP3A5 immunoblot of CYP3A5 NT-control siRNA transfected HepG2 cells. Vinculin was used as loading control. (d) SNU 5 and HepG2 cells treated with paclitaxel for 48 h, post ketoconazole (100 nM) or vehicle pre-treatment for 2 h. (e) HepG2 cells treated with paclitaxel for 48 h, post CYP3A5 or NT-control siRNA transfection (n = 3).

Comment in

References

    1. Hidalgo M. Pancreatic cancer. The New England journal of medicine. 2010;362:1605–1617. - PubMed
    1. Malvezzi M, Bertuccio P, Levi F, La Vecchia C, Negri E. European cancer mortality predictions for the year 2014. Annals of oncology : official journal of the European Society for Medical Oncology / ESMO. 2014 - PubMed
    1. Siegel RL, Miller KD, Jemal A. Cancer statistics, 2015. CA: a cancer journal for clinicians. 2015;65:5–29. - PubMed
    1. Burris HA, 3rd, et al. Improvements in survival and clinical benefit with gemcitabine as first-line therapy for patients with advanced pancreas cancer: a randomized trial. Journal of clinical oncology : official journal of the American Society of Clinical Oncology. 1997;15:2403–2413. - PubMed
    1. Conroy T, et al. FOLFIRINOX versus gemcitabine for metastatic pancreatic cancer. The New England journal of medicine. 2011;364:1817–1825. - PubMed

Methods-only references

    1. Vermeulen L, et al. Single-cell cloning of colon cancer stem cells reveals a multi-lineage differentiation capacity. Proceedings of the National Academy of Sciences of the United States of America. 2008;105:13427–13432. - PMC - PubMed
    1. Subramanian A, et al. Gene set enrichment analysis: a knowledge-based approach for interpreting genome-wide expression profiles. Proceedings of the National Academy of Sciences of the United States of America. 2005;102:15545–15550. - PMC - PubMed
    1. Leek JT, Johnson WE, Parker HS, Jaffe AE, Storey JD. The sva package for removing batch effects and other unwanted variation in high-throughput experiments. Bioinformatics. 2012;28:882–883. - PMC - PubMed
    1. Parker HS, Corrada Bravo H, Leek JT. Removing batch effects for prediction problems with frozen surrogate variable analysis. PeerJ. 2014;2:e561. - PMC - PubMed
    1. Huber W, von Heydebreck A, Sultmann H, Poustka A, Vingron M. Variance stabilization applied to microarray data calibration and to the quantification of differential expression. Bioinformatics. 2002;18(Suppl 1):S96–104. - PubMed

Publication types

MeSH terms