. 2016 Apr;43(8):1044-61.
doi: 10.1111/ejn.13208. Epub 2016 Mar 6.

Complementary subicular pathways to the anterior thalamic nuclei and mammillary bodies in the rat and macaque monkey brain

Affiliations

Complementary subicular pathways to the anterior thalamic nuclei and mammillary bodies in the rat and macaque monkey brain

Kat Christiansen et al. Eur J Neurosci. 2016 Apr.

Abstract

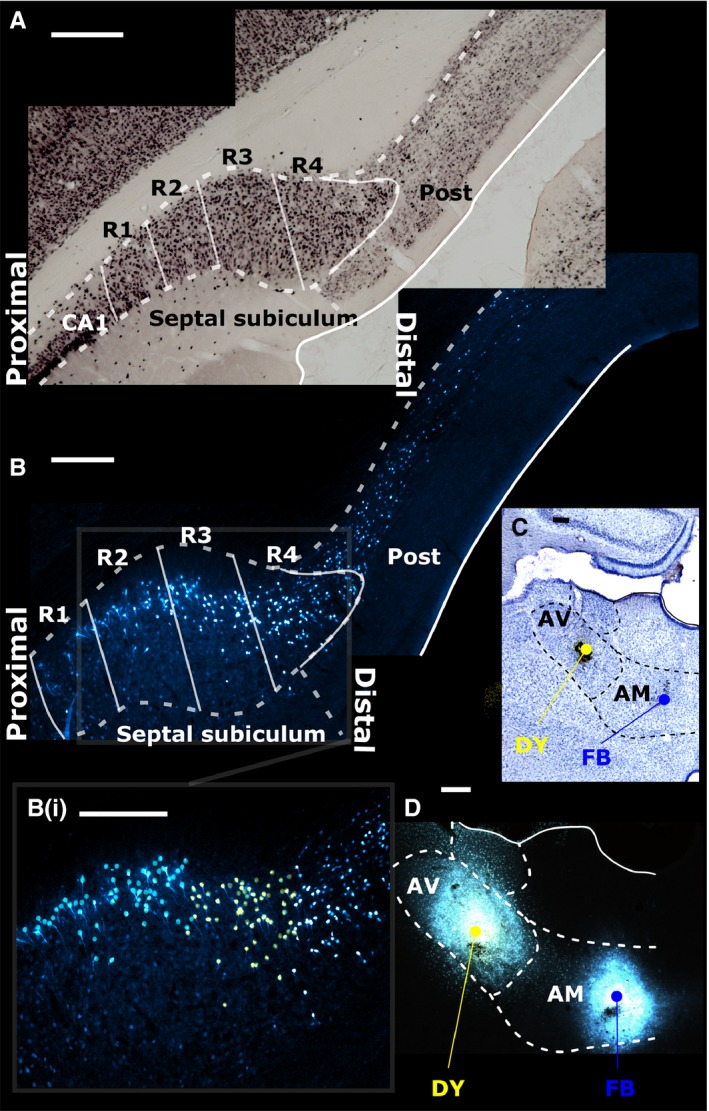
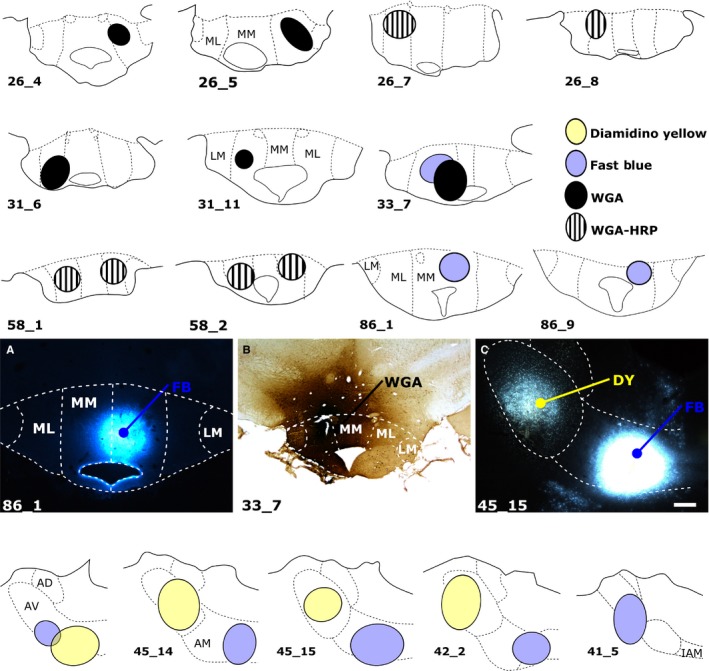
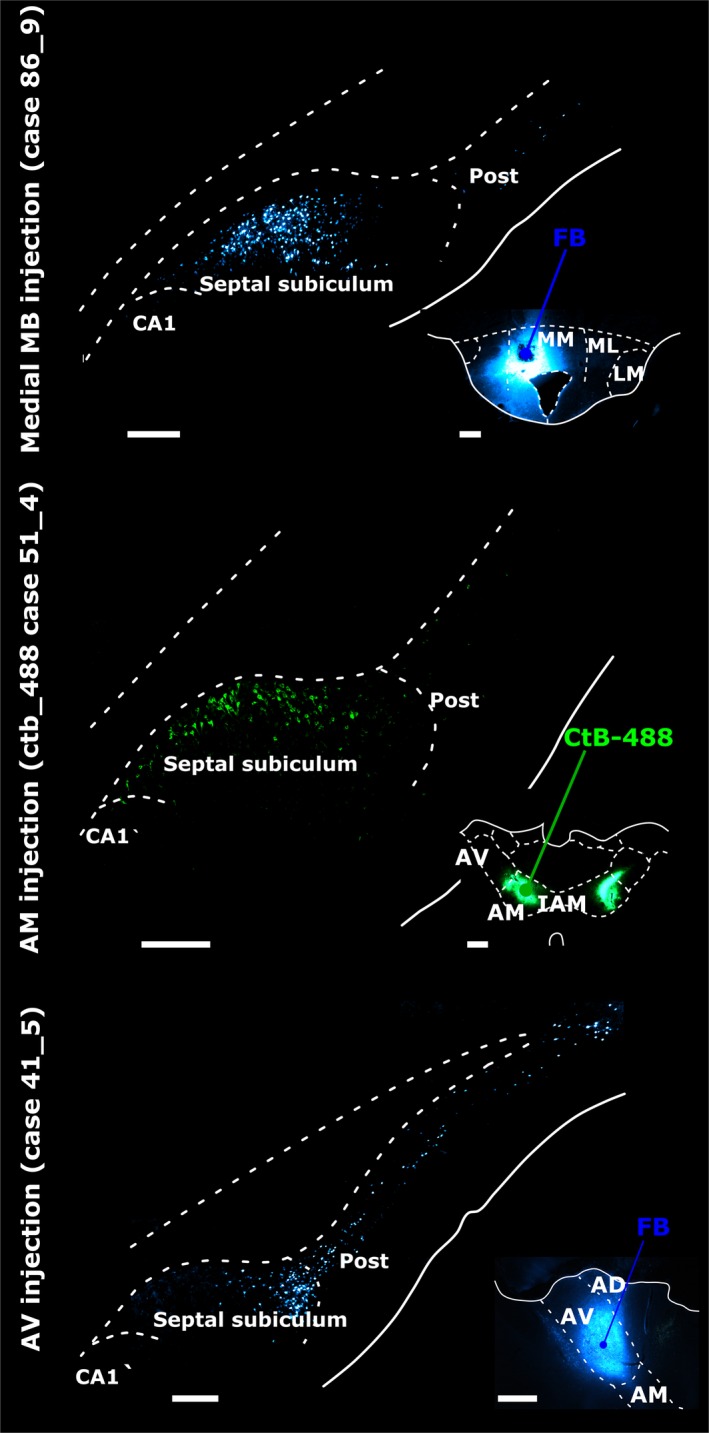
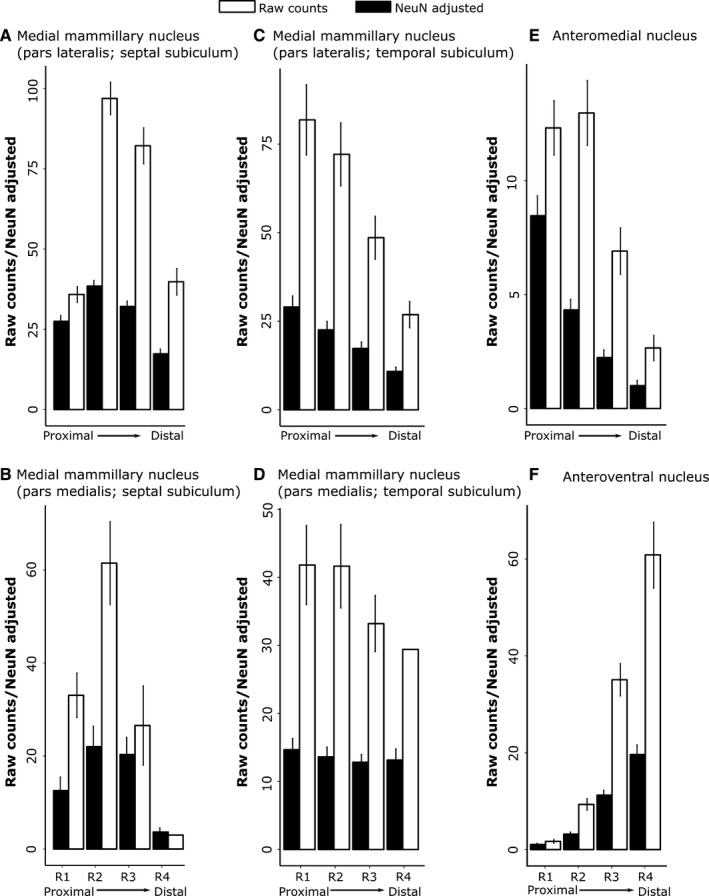
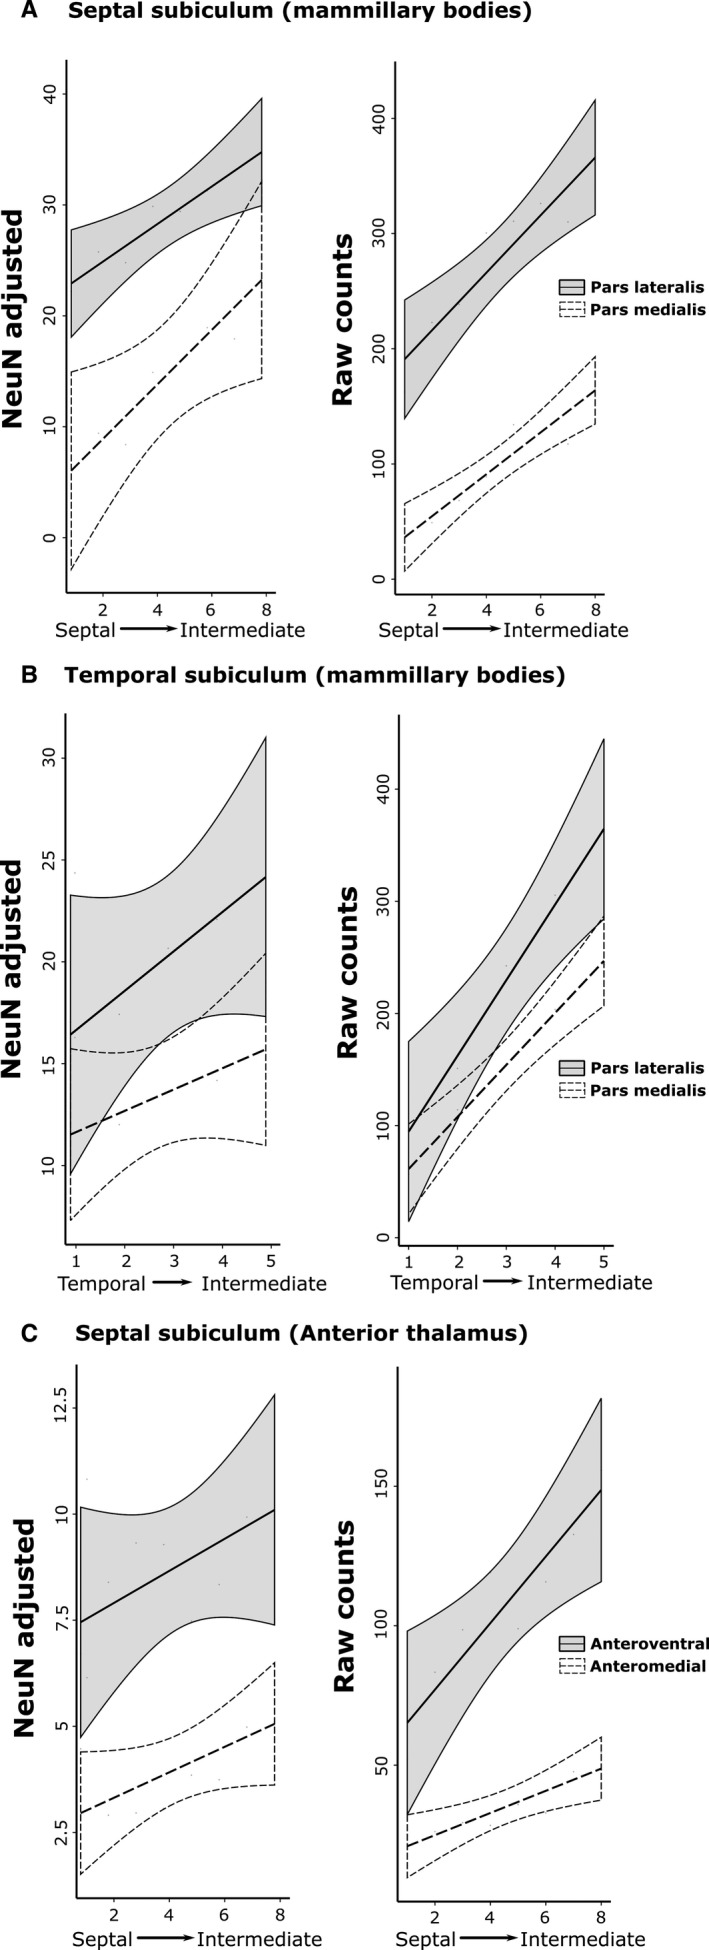
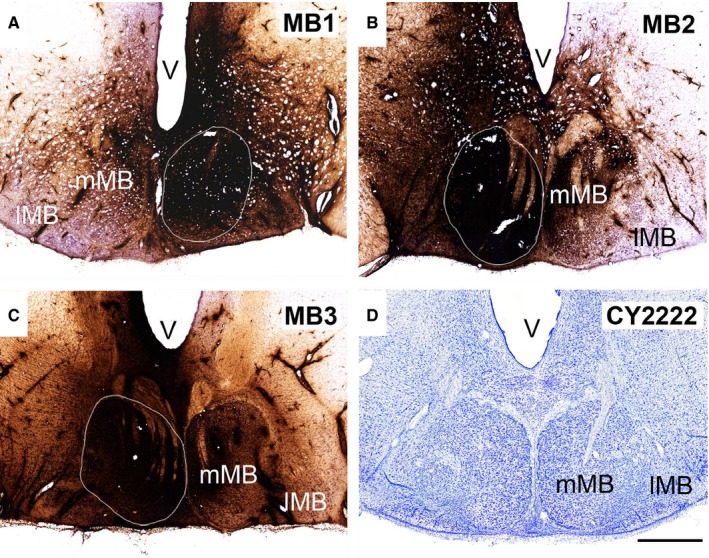
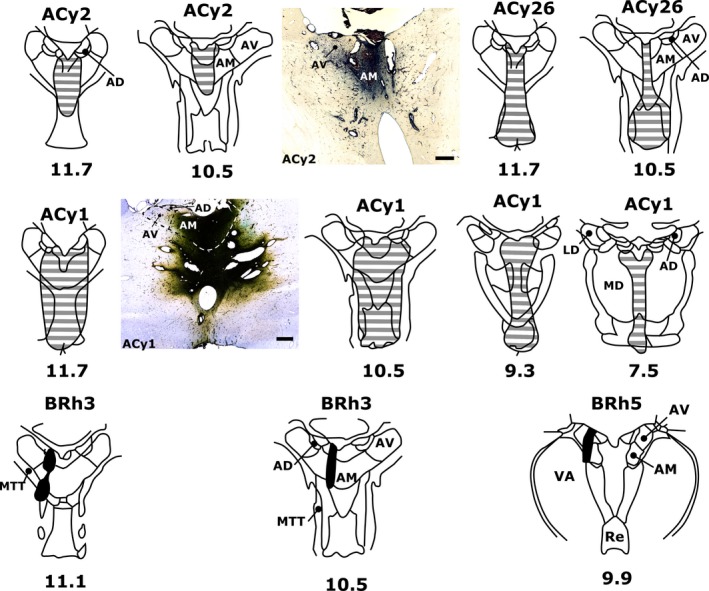
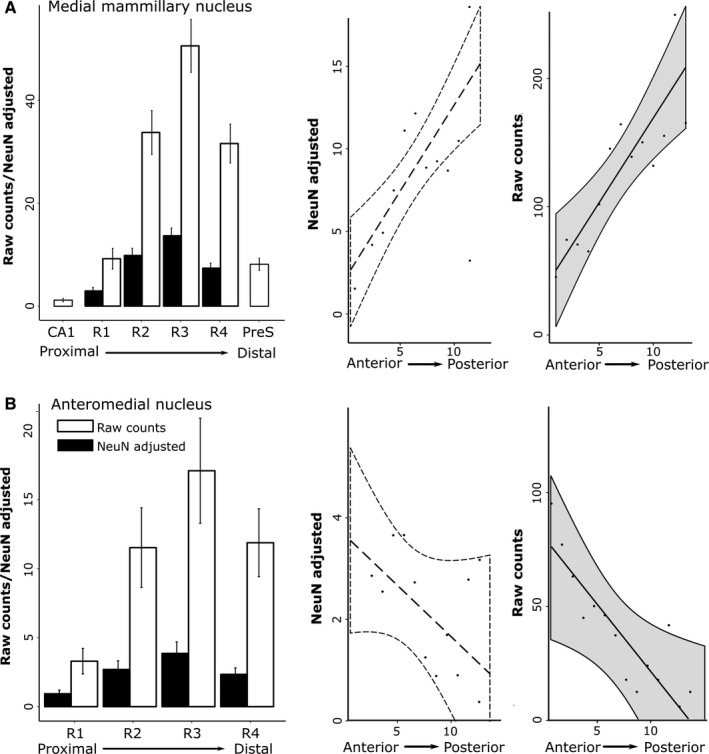
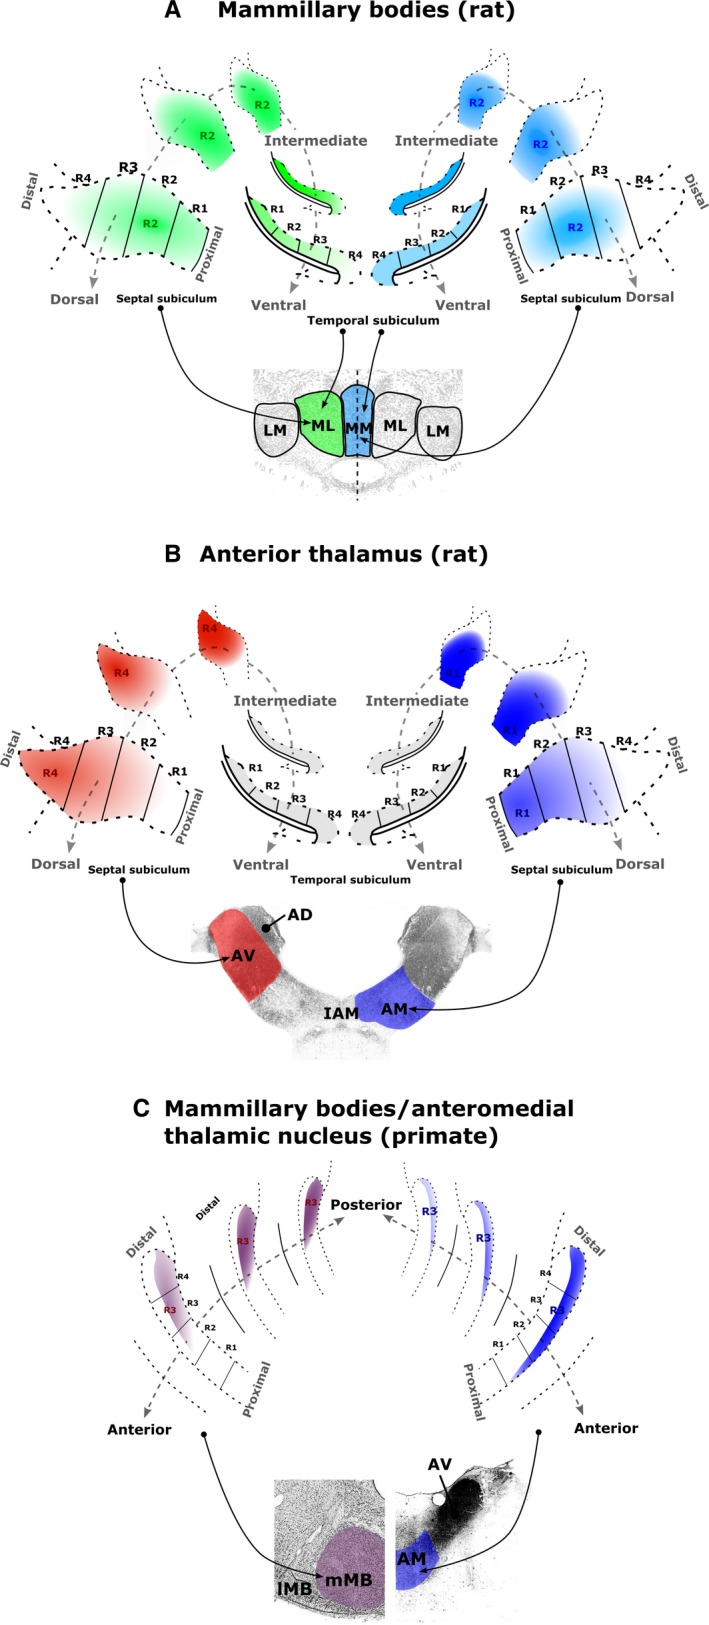
The origins of the hippocampal (subicular) projections to the anterior thalamic nuclei and mammillary bodies were compared in rats and macaque monkeys using retrograde tracers. These projections form core components of the Papez circuit, which is vital for normal memory. The study revealed a complex pattern of subicular efferents, consistent with the presence of different, parallel information streams, whose segregation appears more marked in the rat brain. In both species, the cells projecting to the mammillary bodies and anterior thalamic nuclei showed laminar separation but also differed along other hippocampal axes. In the rat, these diencephalic inputs showed complementary topographies in the proximal-distal (columnar) plane, consistent with differential involvement in object-based (proximal subiculum) and context-based (distal subiculum) information. The medial mammillary inputs, which arose along the anterior-posterior extent of the rat subiculum, favoured the central subiculum (septal hippocampus) and the more proximal subiculum (temporal hippocampus). In contrast, anterior thalamic inputs were largely confined to the dorsal (i.e. septal and intermediate) subiculum, where projections to the anteromedial nucleus favoured the proximal subiculum while those to the anteroventral nucleus predominantly arose in the distal subiculum. In the macaque, the corresponding diencephalic inputs were again distinguished by anterior-posterior topographies, as subicular inputs to the medial mammillary bodies predominantly arose from the posterior hippocampus while subicular inputs to the anteromedial thalamic nucleus predominantly arose from the anterior hippocampus. Unlike the rat, there was no clear evidence of proximal-distal separation as all of these medial diencephalic projections preferentially arose from the more distal subiculum.

Keywords: anatomy; fornix; hippocampus; memory; subiculum.


Figures

Figure 1
Figure 1
(A) The rat septal (dorsal) subiculum was divided into four regions of interest (R1–4) with R1 most proximal to the CA1 subfield of the hippocampus and R4 most distal. The top photomicrograph (A) is a coronal section from the left hemisphere (NeuN immunostaining). (C and D) Following neuronal tracer injections into the AV of DY and into the AM of FB, labelled cells in each subicular region were visualised (case 45_14). (B) The AV injection labelled relatively more neurons in the distal subiculum, extending into the postsubiculum (Post; marked in yellow in inset B(i)). Conversely, the AM injection labelled more proximally situated neurons (marked blue in inset B(i)). Scale bars, 250 μm.
Figure 2
Figure 2
(Upper three rows and photomicrographs A and B) Coronal sections depicting the centre of each tracer injection in the rat MBs and (bottom row and photomicrograph C) in the rat anterior thalamic nuclei. Of the 11 cases with MB injections, some received unilateral injections of WGA (n = 4), WGA conjugated to HRP (WGAHRP, n = 2), or FB (FB, n = 2). The two FB injections (86_1 and 86_9) specifically targeted pars medialis (MM) of the medial mammillary nucleus (A), while the remaining cases were centred in pars lateralis (ML) of the medial mammillary nucleus (e.g. B). Of the three remaining cases, two received bilateral injections of WGAHRP into pars lateralis, while case 33_7 received injections of WGA and FB in pars lateralis of the same hemisphere. In the four anterior thalamic cases depicted (bottom row and C), the two tracers (DY and FB) were injected into either the AV or the AM. AD, anterodorsal thalamic nucleus; IAM, interanteromedial nucleus; LM, lateral mammillary nucleus. Scale bars, 250 μm.
Figure 3
Figure 3
Retrograde neuronal label in the septal (dorsal) subiculum, postsubiculum (Post) and CA1 in the left hemisphere following tracer injections into (top panel) pars medialis of the medial mammillary nucleus (medial MB), (middle panel) the AM and (bottom panel) the AV. In each case, insets show injection site locations and tracer spread. Injections into the medial mammillary nucleus resulted in most labelled cells in mid‐subiculum regions R2 and R3 (top panel). Subiculum label density was greater proximal to CA1 following AM injections (middle panel), while tracer injections into AV resulted in most retrogradely label distal to CA1 (bottom panel). AD, anterodorsal nucleus; CA1, CA1 hippocampal subfield; CtB‐488, non‐toxic B‐subunit of cholera toxin, Alexa‐Fluor 488 conjugate; IAM, interanteromedial nucleus; LM, lateral MB nucleus; ML, pars lateralis of the medial mammillary nucleus; MM, pars medialis of the medial mammillary nucleus. Scale bars, 500 μm (injection sites), 250 μm (subiculum).
Figure 4
Figure 4
Rat subiculum: distribution of both the raw counts of retrogradely labelled cells (white) and the percentage of labelled cells from the total number (raw count) of NeuN cells within the same subicular region (‘NeuN adjusted’, black) along the proximal–distal axis. (A) Septal (dorsal) subiculum after injections into medial mammillary nucleus, pars lateralis; (B) septal (dorsal) subiculum after injections into medial mammillary nucleus, pars medialis; (C) temporal (ventral) subiculum after injections into medial mammillary nucleus, pars lateralis; (D) temporal (ventral) subiculum after injections into medial mammillary nucleus, pars medialis; (E) septal (dorsal) subiculum after injections into AM of the thalamus; and (F) septal (dorsal) subiculum after injections into the AV of the thalamus. Note that trends in raw cell count distributions are mirrored by those from adjusted cell counts. (The rat septal hippocampus is homologous to posterior primate hippocampus). The graphs show the mean scores ± 95% confidence intervals. (Note that the x‐axes have different scales, reflecting the different numbers of labelled cells.)
Figure 5
Figure 5
Rat subiculum: distribution of NeuN‐adjusted (left column) and raw (right column) cell counts in the AP plane. The graphs show the mean scores ± 95% confidence intervals. The x‐axis depicts successive slides in (A and C) the septal→intermediate hippocampal direction and (B) the temporal→intermediate hippocampal direction. (A) Results for the septal (dorsal) subiculum following tracer injections into the medial mammillary nucleus, pars lateralis and pars medialis. (B) Results for the temporal (ventral) subiculum following injections into the medial mammillary nucleus, pars lateralis and pars medialis. (C) Results for the septal (dorsal) subiculum following injections into the AV and AM. The NeuN‐adjusted scores are the percentage of labelled cells from the total number of NeuN cells in the corresponding region of interest. (Note that the x‐axes have different scales, reflecting the different numbers of labelled cells.)
Figure 6
Figure 6
Neuronal tracer injection sites in the macaque MBs. (A–C) In three cases (MB1, MB2 and MB3, respectively), unilateral injections of HRP were made into the medial MB nucleus. (D) Cresyl Violet‐stained coronal section through the MBs of a cynomolgus monkey. lMB, lateral MB nucleus; mMB, medial MB nucleus; V, ventricle. Scale bar, 1 mm.
Figure 7
Figure 7
Neuronal tracer injection sites in the anterior thalamus of macaque monkeys. In four cases, injections of either HRP (cases ACy1, ACy2 and ACy26) or FB (case BRh3) were centred in the AM. In one additional case an injection of FB was centred in the caudal AV (case BRh5). Photomicrograph insets show tracer spread in coronal sections of the anterior thalamus for HRP cases ACy2 (centre) and ACy1 (mid left). Numbers below each schematic diagram represent AP levels, relative to bregma, according to Olszewski (1952). AD, anterodorsal nucleus; LD, laterodorsal nucleus; MD, mediodorsal nucleus; MTT, mammillothalamic tract; Re, nucleus reuniens; VA, ventral anterior nucleus. Scale bar, 500 μm.
Figure 8
Figure 8
Retrograde label in the cynomolgus monkey subicular cortices following injections of HRP into either (C–F) the left medial mammillary nucleus (cases MB2 and MB3) or (G–H) the AM. (A and B) Low (A) and higher (B) magnification photomicrographs of a NeuN‐stained coronal section through the rhesus monkey hippocampus. Dashed lines indicate the boundaries of the subiculum while solid lines depict the boundaries of the four subiculum regions of interest (R1–4). R1 corresponds to the prosubiculum (ProS; most proximal to CA1) while R4 is most distal to CA1, i.e. next to the presubiculum (PreS). Following injections into the medial mammillary nucleus (MB2, MB3), retrograde label was concentrated in the more superficial pyramidal cells of R3 and R4 (distal subiculum), tapering off into deeper pyramidal cells when going more proximal (C–F). Inset D(i) shows retrograde label in more superficial R4 at higher magnification. G–H, low (G) and high (H) magnification photomicrographs showing retrograde label in the deep layer of the subiculum following an injection of HRP into AM (case ACy1). In ACy1 the label is in deep polymorphic cells (black arrows) and pyramidal‐like cells (purple arrows) nearer the upper border of this deep layer. (Note, sections G and H have been left–right reversed to aid comparison with the other cases.) The black rectangle and inset in G shows the region of high magnification shown in H. DG, dentate gyrus. Scale bars, 500 μm (A–G), 100 μm (H).
Figure 9
Figure 9
Distribution of retrogradely labelled cells in the macaque subiculum. (Left column) Distribution of the raw number of retrogradely labelled cells (white) and the percentage of these cells from the total number of NeuN cells (‘NeuN‐adjusted’; black) along the proximal–distal axis (R1–4). (Right column) Distribution of NeuN‐adjusted cell counts and raw cell counts (grey) along the AP hippocampal axis (x‐axis, sections 1–14). Cell distribution following HRP injections into (A) the MBs and (B) the AM. The graphs show the mean scores ± 95% confidence intervals. CA1, hippocampal field CA1; PreS, presubiculum.
Figure 10
Figure 10
Schematic summaries of the topographic sources of the subicular inputs to (A) the rat medial MBs, (B) the rat anterior thalamic nuclei and (C) the macaque medial MBs (left) and AM (right). Denser sources of subicular label correspond to denser colours. (A) Subicular inputs to the rat medial mammillary pars lateralis (green) and pars medialis (blue) arise predominantly from regions R1–3. For both mammillary sub‐nuclei, the proportion of subiculum‐projecting cells increases approaching the intermediate hippocampus. (B) Inputs to the rat AV (red) arise predominantly from distal regions (R3–4) of the septal–intermediate subiculum, while the corresponding inputs to the rat AM (blue) mainly arise from the proximal regions (R1–2) of the septal–intermediate subiculum. (C) Subicular cells that project to the macaque medial MBs (left) are more numerous in the posterior hippocampus while subicular cells that project to the AM are more numerous in the anterior hippocampus. The two sets of inputs predominantly arise from the distal subiculum (especially R3) but from different laminae. AD, anterodorsal thalamic nucleus; LM, lateral mammillary nucleus; ML, medial mammillary nucleus, pars lateralis; MM, medial mammillary nucleus, pars medialis.

Similar articles

Cited by

References

    1. Aggleton, J.P. (1985) X‐ray localization of limbic structures in the cynomolgus monkey (Macaca fascicularis). J. Neurosci. Meth., 14, 101–108. - PubMed
    1. Aggleton, J.P. (1986) A description of the amygdalo‐hippocampal interconnections in the macaque monkey. Exp. Brain Res., 64, 515–526. - PubMed
    1. Aggleton, J.P. (2012) Multiple anatomical systems embedded within the primate medial temporal lobe: implications for hippocampal function. Neurosci. Biobehav. R., 36, 1579–1596. - PubMed
    1. Aggleton, J.P. & Brown, M.W. (1999) Episodic memory, amnesia, and the hippocampal‐anterior thalamic axis. Behav. Brain Sci., 22, 425–444. - PubMed
    1. Aggleton, J.P. & Christiansen, K. (2015) The subiculum: the heart of the extended hippocampal system. Prog. Brain Res., 219, 65–82. - PubMed

LinkOut - more resources