

The circadian gene Rev-erbα improves cellular bioenergetics and provides preconditioning for protection against oxidative stress
- PMID: 26855417
- PMCID: PMC4905744
- DOI: 10.1016/j.freeradbiomed.2016.02.004
The circadian gene Rev-erbα improves cellular bioenergetics and provides preconditioning for protection against oxidative stress
Abstract
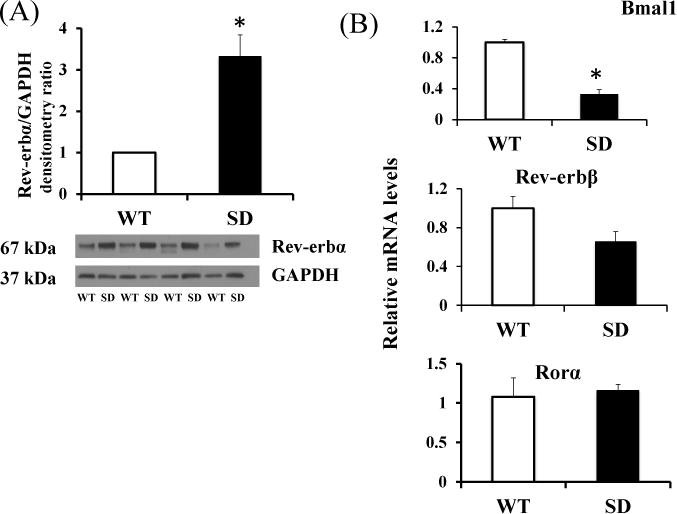
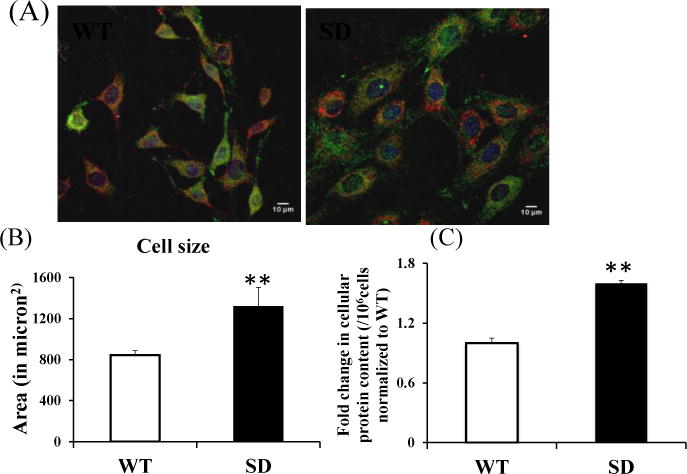
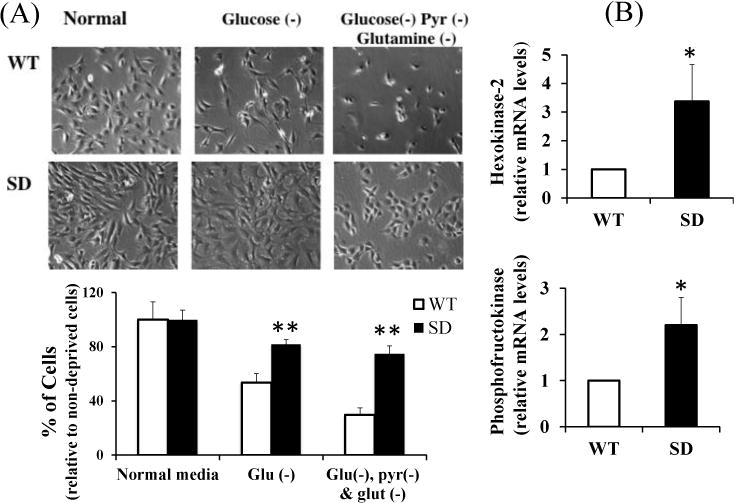
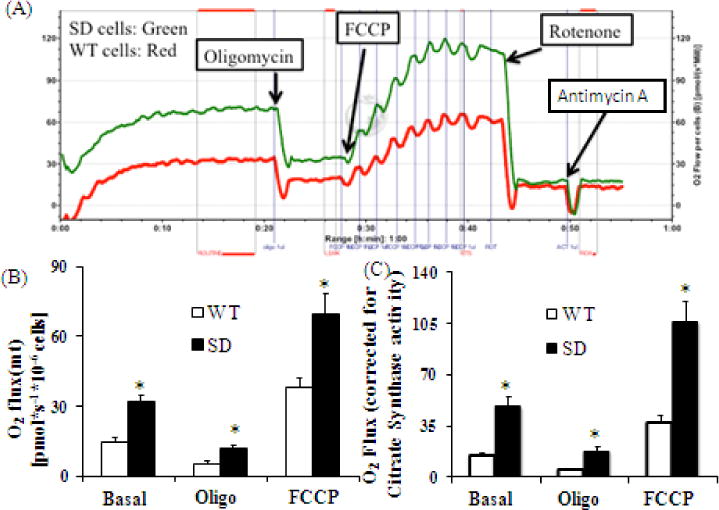
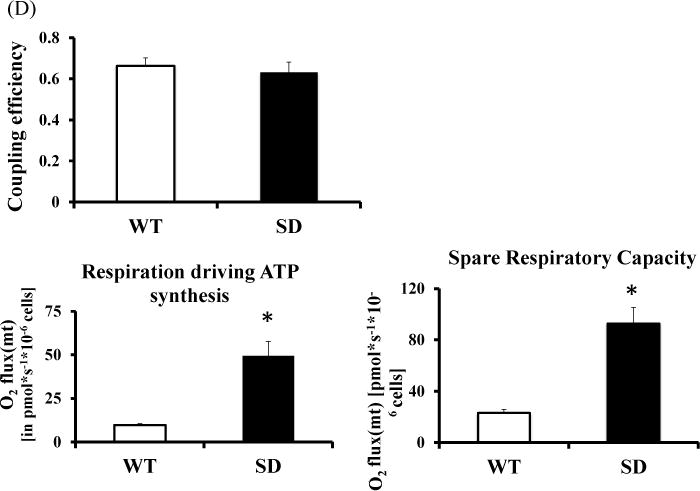
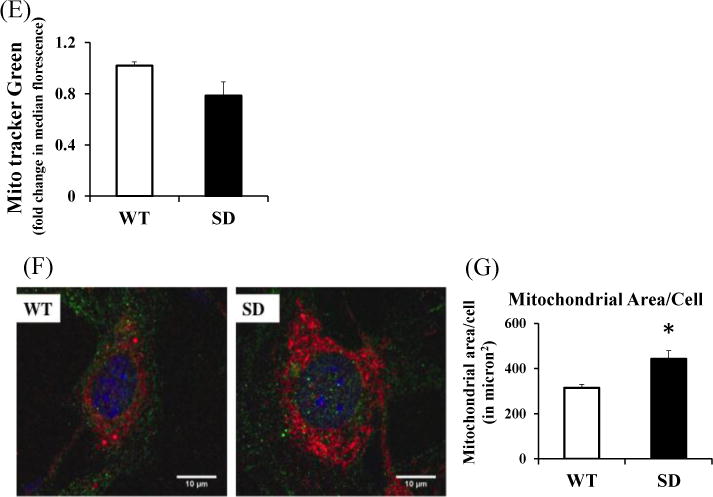
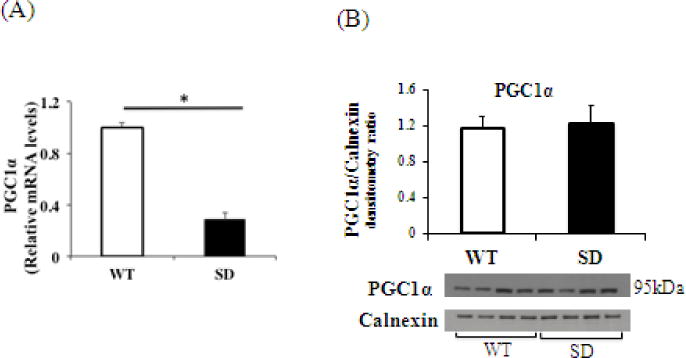
Diurnal oscillations in the expression of antioxidant genes imply that protection against oxidative stress is circadian-gated. We hypothesized that stabilization of the core circadian gene Rev-erbα (Nr1d1) improves cellular bioenergetics and protects against nutrient deprivation and oxidative stress. Compared to WT, mouse lung fibroblasts (MLG) stably transfected with a degradation resistant Rev-erbα (Ser(55/59) to Asp; hence referred to as SD) had 40% higher protein content, 1.5-fold higher mitochondrial area (confocal microscopy), doubled oxidative phosphorylation by high-resolution respirometry (Oroboros) and were resistant to glucose deprivation for 24h. This resulted from a 4-fold reduction in mitophagy (L3CB co-localized with MitoTracker Red) versus WT. Although PGC1α protein expression was comparable between SD and WT MLG cells, the role of mitochondrial biogenesis in explaining increased mitochondrial mass in SD cells was less clear. Embryonic fibroblasts (MEF) from C57Bl/6-SD transgenic mice, had a 9-fold induction of FoxO1 mRNA and increased mRNA of downstream antioxidant targets heme oxygenase-1 (HO-1), Mn superoxide dismutase and catalase (1.5, 2 fold and 2 fold respectively) versus WT. This allowed the SD cells to survive 1h incubation with 500 µM H2O2 as well as 24h of exposure to 95% O2 and remain attached whereas most WT cells did not. These observations establish a mechanistic link between the metabolic functions of Rev-erbα with mitochondrial homeostasis and protection against oxidative stress.
Keywords: Bioenergetics; Circadian; Energy metabolism; Mitochondria; NR1D1; Oxidative stress; Peroxisome proliferator‐activated receptor gamma coactivator 1‐alpha (PGC‐1α)(PPARGC1A); Preconditioning.
Copyright © 2016 Elsevier Inc. All rights reserved.
Figures
Similar articles
-
Integration of the nuclear receptor REV-ERBα linked with circadian oscillators in the expressions of Alas1, Ppargc1a, and Il6 genes in rat granulosa cells.Chronobiol Int. 2015;32(6):739-49. doi: 10.3109/07420528.2015.1042582. Epub 2015 Jun 23. Chronobiol Int. 2015. PMID: 26102301
-
Oxidative stress and inflammation modulate Rev-erbα signaling in the neonatal lung and affect circadian rhythmicity.Antioxid Redox Signal. 2014 Jul 1;21(1):17-32. doi: 10.1089/ars.2013.5539. Epub 2014 Mar 14. Antioxid Redox Signal. 2014. PMID: 24252172 Free PMC article.
-
Transcriptional coactivator PGC-1alpha integrates the mammalian clock and energy metabolism.Nature. 2007 May 24;447(7143):477-81. doi: 10.1038/nature05767. Epub 2007 May 2. Nature. 2007. PMID: 17476214
-
Dissecting the Rev-erbα Cistrome and the Mechanisms Controlling Circadian Transcription in Liver.Cold Spring Harb Symp Quant Biol. 2015;80:233-8. doi: 10.1101/sqb.2015.80.027508. Epub 2015 Sep 14. Cold Spring Harb Symp Quant Biol. 2015. PMID: 26370410 Review.
-
Targeting NR1D1 in organ injury: challenges and prospects.Mil Med Res. 2023 Dec 11;10(1):62. doi: 10.1186/s40779-023-00495-3. Mil Med Res. 2023. PMID: 38072952 Free PMC article. Review.
Cited by
-
NADPH and Mitochondrial Quality Control as Targets for a Circadian-Based Fasting and Exercise Therapy for the Treatment of Parkinson's Disease.Cells. 2022 Aug 4;11(15):2416. doi: 10.3390/cells11152416. Cells. 2022. PMID: 35954260 Free PMC article. Review.
-
Exploring the Genetic Conception of Obesity via the Dual Role of FoxO.Int J Mol Sci. 2021 Mar 20;22(6):3179. doi: 10.3390/ijms22063179. Int J Mol Sci. 2021. PMID: 33804729 Free PMC article. Review.
-
Mitochondrial Dynamics in Pulmonary Hypertension.Biomedicines. 2023 Dec 25;12(1):53. doi: 10.3390/biomedicines12010053. Biomedicines. 2023. PMID: 38255160 Free PMC article. Review.
-
Only time will tell: the interplay between circadian clock and metabolism.Chronobiol Int. 2021 Feb;38(2):149-167. doi: 10.1080/07420528.2020.1842436. Epub 2020 Dec 20. Chronobiol Int. 2021. PMID: 33345624 Free PMC article. Review.
-
Loss of the transcriptional repressor Rev-erbα upregulates metabolism and proliferation in cultured mouse embryonic fibroblasts.Sci Rep. 2021 Jun 11;11(1):12356. doi: 10.1038/s41598-021-91516-5. Sci Rep. 2021. PMID: 34117285 Free PMC article.
References
-
- Panda S, Hogenesch JB, Kay SA. Circadian rhythms from flies to human. Nature. 2002;417(6886):329–35. - PubMed
-
- Schernhammer ES, Laden F, Speizer FE, Willett WC, Hunter DJ, Kawachi I, et al. Rotating night shifts and risk of breast cancer in women participating in the nurses’ health study. J Natl Cancer Inst. 2001;93(20):1563–8. - PubMed
-
- Schernhammer ES, Laden F, Speizer FE, Willett WC, Hunter DJ, Kawachi I, et al. Night-shift work and risk of colorectal cancer in the nurses’ health study. J Natl Cancer Inst. 2003;95(11):825–8. - PubMed
Publication types
MeSH terms
Substances
Grants and funding
- K12 DK094723/DK/NIDDK NIH HHS/United States
- R21-HL111907/HL/NHLBI NIH HHS/United States
- T32 GM008076/GM/NIGMS NIH HHS/United States
- T32 HD060556/HD/NICHD NIH HHS/United States
- F31 NS086255/NS/NINDS NIH HHS/United States
- R01 NS029868/NS/NINDS NIH HHS/United States
- R01NS077773/NS/NINDS NIH HHS/United States
- K23 DK102659/DK/NIDDK NIH HHS/United States
- R01 NS077773/NS/NINDS NIH HHS/United States
- K12 HD043245/HD/NICHD NIH HHS/United States
- U54 HD086984/HD/NICHD NIH HHS/United States
- T32HD60556-4/HD/NICHD NIH HHS/United States
- T32GM008076/GM/NIGMS NIH HHS/United States
- R01 HD060132/HD/NICHD NIH HHS/United States
- R01 HL058752/HL/NHLBI NIH HHS/United States
- R01HL058752/HL/NHLBI NIH HHS/United States
- R21 HL111907/HL/NHLBI NIH HHS/United States
LinkOut - more resources
Full Text Sources
Other Literature Sources
Medical
Research Materials
Miscellaneous
