. 2016 Jan 20:11:357-71.
doi: 10.2147/IJN.S93409. eCollection 2016.

Quantitative [Fe]MRI of PSMA-targeted SPIONs specifically discriminates among prostate tumor cell types based on their PSMA expression levels

Affiliations

Quantitative [Fe]MRI of PSMA-targeted SPIONs specifically discriminates among prostate tumor cell types based on their PSMA expression levels

Laurel O Sillerud. Int J Nanomedicine. .

Abstract

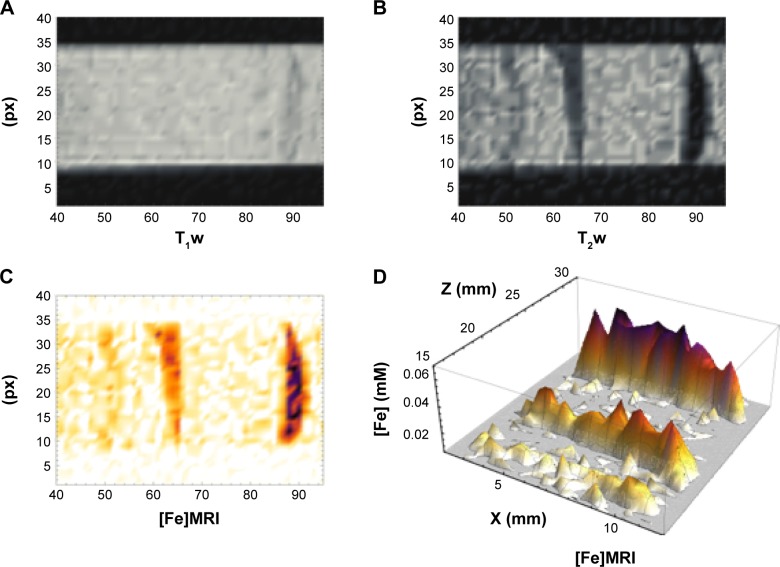
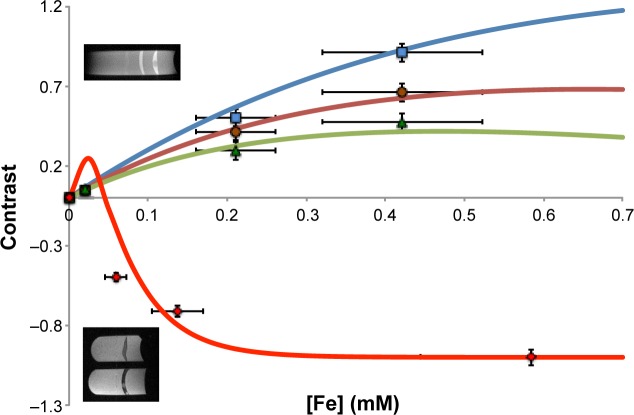
We report the development, experimental verification, and application of a general theory called [Fe]MRI (pronounced fem-ree) for the non-invasive, quantitative molecular magnetic resonance imaging (MRI) of added magnetic nanoparticles or other magnetic contrast agents in biological tissues and other sites. [Fe]MRI can easily be implemented on any MRI instrument, requiring only measurements of the background nuclear magnetic relaxation times (T1, T2) of the tissue of interest, injection of the magnetic particles, and the subsequent acquisition of a pair of T1-weighted and T2-weighted images. These images, converted into contrast images, are subtracted to yield a contrast difference image proportional to the absolute nanoparticle, iron concentration, ([Fe]) image. [Fe]MRI was validated with the samples of superparamagnetic iron oxide nanoparticles (SPIONs) both in agarose gels and bound to human prostate tumor cells. The [Fe]MRI measurement of the binding of anti-prostate specific membrane antigen (PSMA) conjugated SPIONs to PSMA-positive LNCaP and PSMA-negative DU145 cells in vitro allowed a facile discrimination among prostate tumor cell types based on their PSMA expression level. The low [Fe] detection limit of ~2 μM for SPIONs allows sensitive MRI of added iron at concentrations considerably below the US Food and Drug Administration's human iron dosage guidelines (<90 μM, 5 mg/kg).

Keywords: RT-PCR; contrast difference; flow cytometry.


Figures

Figure 1
Figure 1
The relationship between the measured iron concentration and the longitudinal (r1) (A) and transverse (r2) (B) water relaxation rate enhancements at 1.0 T in 1% agarose gels (filled circles) containing μMACS beads, and (open squares) anti-PSMA-conjugated μMACS beads bound to LNCaP cells in 1% agarose. Notes: The error bars reflect the standard error from the fits to the relaxation time measurements. The slopes give relaxivities of r1 =38.3±1.1 Hz/mM, and r2 =800.4±15.9 Hz/mM. Note that we observed no differences between the relaxivities of the SPIONs when free or bound to cells. Abbreviations: PSMA, prostate specific membrane antigen; SPIONs, superparamagnetic iron oxide nanoparticles.
Figure 2
Figure 2
The theoretical and experimental relationship between MRI contrast and [Fe]. Notes: (A) Theoretical dependence of the tissue contrast on measured and set tumor MRI parameters as a function of the iron concentration. Measured parameters at 1.0 T: the r1 relaxivity of the SPIONs was: 38.3 Hz/mM. The r2 relaxivity of the SPIONs was: 800.4 Hz/mM. The tumor native T1 was: 0.72 seconds. The tumor native T2 was: 0.108 seconds. Set parameters: the echo time for the T1-weighted image was: TE1 =0.004 seconds. The echo time for the T2-weighted image was: TE2 =0.0235 seconds. The recycle time for the T1-weighted image was: TR1 =0.5 seconds. The recycle time for the T2-weighted image was: TR2 =1.0 seconds. The blue curve is for a T1-weighted image, the red curve is for a T2-weighted image, and the green curve is the contrast difference. (B) Inversion of the contrast difference relationship from (A) to give the empirical function (Equation 12) needed to convert contrast difference images into [Fe] images: [Fe] =0.0005051+0.03961 ΔC +0.009258 (ΔC) +0.008857 (ΔC), for the acquisition parameters in (A). Even though this function is non-linear, it is monotonic and well-defined. (C) Validation of the theoretical dependence of contrast on [Fe]. Suspensions (n=3) of varying concentrations of μMACS SPIONs were prepared in 1% agarose gels and imaged with TR =0.5 and 5 seconds, TE =7 and 20 ms at 4.7 T. The relaxivities of the SPIONs at this field strength was r1 =1.668 Hz/mM, and r2 =21.35 Hz/mM. The least squares line fitted to the data has a slope of 1.024 and an intercept of +0.5 μM. The background T1 and T2 of the agarose were 1.55 seconds and 0.108 seconds, respectively. The computed [Fe] was calculated from the images using the [Fe]MRI theory given in the text. Abbreviations: MRI, magnetic resonance imaging; SPIONs, superparamagnetic iron oxide nanoparticles; TR, repetition times; TE, echo times.
Figure 3
Figure 3
Determination of the limit of detection for iron using [Fe]MRI at 1.0 T. A Dynabead stock solution was diluted 1:6,250, 1:1,250, and 1:250 into 1% agarose and placed into 10 mm plastic tubes as bands surrounded by agarose. Notes: (A) A T1-weighted MR image at TR =1 seconds, TE =5 ms. (B) A T2-weighted MR image at TR =1 seconds, TE =115 ms. (C and D) The resulting [Fe]MR images showing detectable bands for [Fe] =9.7 and 48 μM, with a barely detectable band at [Fe] =1.97 μM. Abbreviations: MRI, magnetic resonance imaging; TR, repetition times; TE, echo times.
Figure 4
Figure 4
Specific binding of anti-PSMA antibody-conjugated SPIONs to prostate cancer cells, in vitro. Notes: Fully humanized monoclonal antibody (J591) against PSMA was conjugated to Dynabeads (2.8 μm, [A, D]; 1.0 μm, [B, E]) and to μMACS (~50 nm, [C, F]) and then incubated with either PSMA-positive LNCaP (A, B, C) or PSMA-negative DU145 (D, E, F) cells at 4°C (to prevent uptake into the cytoplasm), washed and examined under the microscope. The SPIONs bound to each cell we either counted directly for n=100 cells, or in the case of the μMACS, Perl’s stain for iron was applied to reveal the presence or absence of iron. Note that only the PSMA-positive LNCaP cells bound the SPIONs or stained blue indicating the presence of μMACS SPIONs. *P<0.001. Abbreviations: PSMA, prostate specific membrane antigen; SPIONs, superparamagnetic iron oxide nanoparticles.
Figure 5
Figure 5
MRI contrast as a function of [Fe] for T1-weighted (T1w) (blue, brown, and green) and T2-weighted (T2w) (red) MR images of suspensions of LNCaP cells with anti-PSMA-conjugated Dynabeads (top image and curves) and anti-PSMA-conjugated μMACS SPIONs (bottom image and curve). Notes: Note that the T1w contrast was positive, while the T2w contrast was negative, in agreement with Equations 7 and 8. The smooth lines are the theoretical predictions for the contrast given the measured relaxation and set acquisition parameters for each image: blue (TR =0.5 seconds, TE =0.009 seconds); brown (TR =1.0 seconds, TE =0.009 seconds); green (TR =1.5 seconds, TE =0.009 seconds); red (TR =1.0 seconds, TE =0.023 seconds). The insets show representative images from each set used to derive the contrast data. The LNCaP cells bound (15.3±3.7)×104 μMACS SPIONs per cell and the cell densities ranged from 0 to 1.27×10⁵ per μL. These cells also bound ~80 Dynabeads per cell. The measured agarose relaxation times at 1.0 T gave T1 =2.0 seconds, T2 =0.108 seconds. Abbreviations: MRI, magnetic resonance imaging; PSMA, prostate specific membrane antigen; SPIONs, superparamagnetic iron oxide nanoparticles; TR, repetition times; TE, echo times.
Figure 6
Figure 6
[Fe]MRI of anti-PSMA antibody-conjugated SPIONs to LNCaP prostate cancer cells, in vitro. Fully humanized anti-PSMA antibody J591 was conjugated to μMACS SPIONs which were then bound to LNCaP cells and aliquots of cells containing 2×10⁶, 1×10⁶, and 1×10⁵ cells were layered in 1% agarose gels. Notes: (AC) The bands containing 2 and 1 million cells were easily detectable, but the band containing only 100,000 cells barely reached the limit of detection. (D) The [Fe] in each band is plotted against the number of cells to yield the contribution per cell. From the band volume we calculate that there were ~3,200 μMACS SPIONs per cell. Abbreviations: MRI, magnetic resonance imaging; PSMA, prostate specific membrane antigen; SPIONs, superparamagnetic iron oxide nanoparticles.
Figure 7
Figure 7
[Fe]MRI of LNCaP cells that have internalized anti-PSMA antibody-conjugated μMACS SPIONs. Notes: The cells were incubated with the SPIONs at 4°C, washed and then incubated for 60 minutes at 37°C so that the cells could take up the SPIONs. (A) T1w (TR =0.5 seconds; TE =9 ms) and (B) T2w (TR =1.5 seconds; TE =23.5 ms) images at 1.0 T. (C) [Fe]MRI map. (D) Three-dimensional plot of the [Fe]MRI map in (C). The bands in AD contained 1 and 2 million cells, respectively, with [Fe] of 359±34 and 658±41 μM. Abbreviations: MRI, magnetic resonance imaging; PSMA, prostate specific membrane antigen; SPIONs, superparamagnetic iron oxide nanoparticles; TR, repetition times; TE, echo times; T1w, T1-weighted; T2w, T2-weighted.
Figure 8
Figure 8
[Fe]MRI with anti-PSMA antibody-conjugated μMACS SPIONs can discriminate PSMA-positive LNCaP from PSMA-negative DU145 cells. Notes: The cells were incubated with the SPIONs for 30 minutes, washed and then mixed with 1% agarose and layered into a tube containing 1% agarose. (A) T1-weighted MR image. The DU145 cells were inserted first and appear as a weak band near the bottom of the tube, while the LNCaP cells were inserted second and appear as a strong band near the top of the tube (B) T2-weighted MR image. (C) [Fe] image. (D) Three-dimensional plot of the [Fe] image in (C). The [Fe] =(78±29) μM for the LNCaP cells and only (9±4) μM for the DU145 cells indicating a >8.7-fold difference in iron binding by the two cell lines. Abbreviations: MRI, magnetic resonance imaging; PSMA, prostate specific membrane antigen; SPIONs, superparamagnetic iron oxide nanoparticles; T1w, T1-weighted; T2w, T2-weighted; px, pixels.

Similar articles

Cited by

References

    1. Shin TH, Choi Y, Kim S, Cheon J. Recent advances in magnetic nanoparticle-based multi-modal imaging. Chem Soc Rev. 2015;44(14):4501–4516. - PubMed
    1. Taylor RM, Sillerud LO. Paclitaxel-loaded iron platinum stealth immunomicelles are potent MRI imaging agents that prevent prostate cancer growth in a PSMA-dependent manner. Int J Nanomedicine. 2012;7:4341–4352. - PMC - PubMed
    1. Lo YL, Chou HL, Liao ZX, et al. Chondroitin sulfate-polyethylenimine copolymer-coated superparamagnetic iron oxide nanoparticles as an efficient magneto-gene carrier for microRNA-encoding plasmid DNA delivery. Nanoscale. 2015;7(18):8554–8565. - PubMed
    1. Wang C, Ding C, Kong M, et al. Tumor-targeting magnetic lipoplex delivery of short hairpin RNA suppresses IGF-1R overexpression of lung adenocarcinoma A549 cells in vitro and in vivo. Biochem Biophys Res Commun. 2011;410(3):537–542. - PubMed
    1. Nahrendorf M, Keliher E, Marinelli B, et al. Detection of macrophages in aortic aneurysms by nanoparticle positron emission tomography-computed tomography. Arterioscler Thromb Vasc Biol. 2011;31(4):750–757. - PMC - PubMed

Publication types

MeSH terms