

Reciprocal changes in DNA methylation and hydroxymethylation and a broad repressive epigenetic switch characterize FMR1 transcriptional silencing in fragile X syndrome
- PMID: 26855684
- PMCID: PMC4743126
- DOI: 10.1186/s13148-016-0181-x
Reciprocal changes in DNA methylation and hydroxymethylation and a broad repressive epigenetic switch characterize FMR1 transcriptional silencing in fragile X syndrome
Abstract
Background: Fragile X syndrome (FXS) is the most common form of inherited intellectual disability, resulting from the loss of function of the fragile X mental retardation 1 (FMR1) gene. The molecular pathways associated with FMR1 epigenetic silencing are still elusive, and their characterization may enhance the discovery of novel therapeutic targets as well as the development of novel clinical biomarkers for disease status.
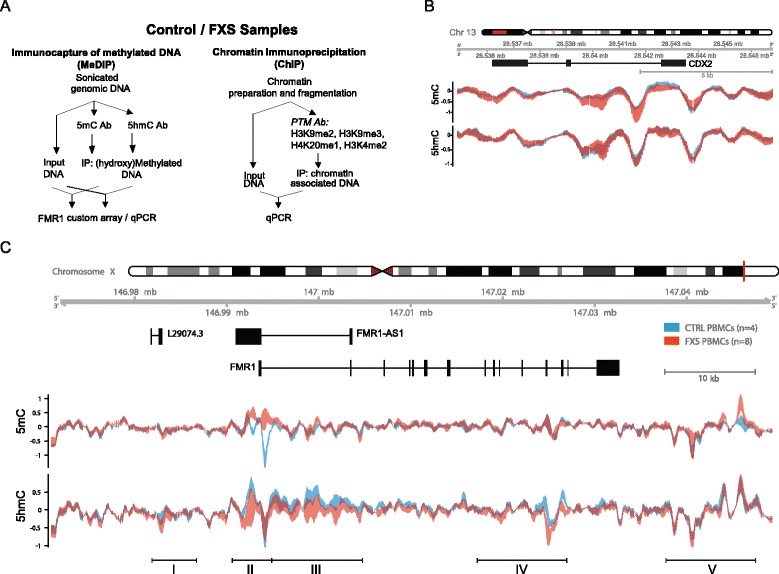
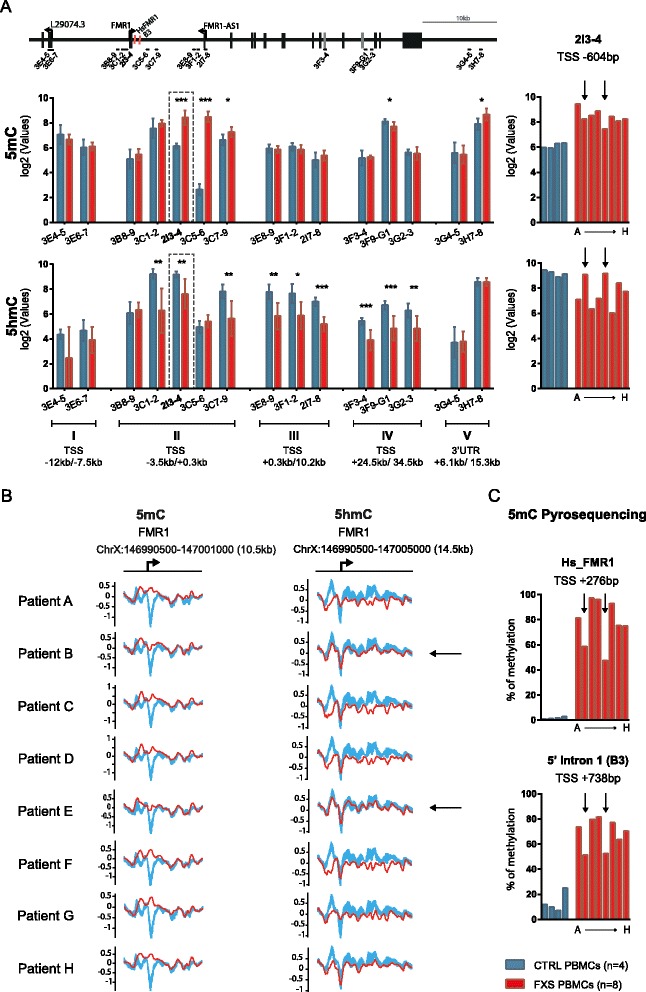
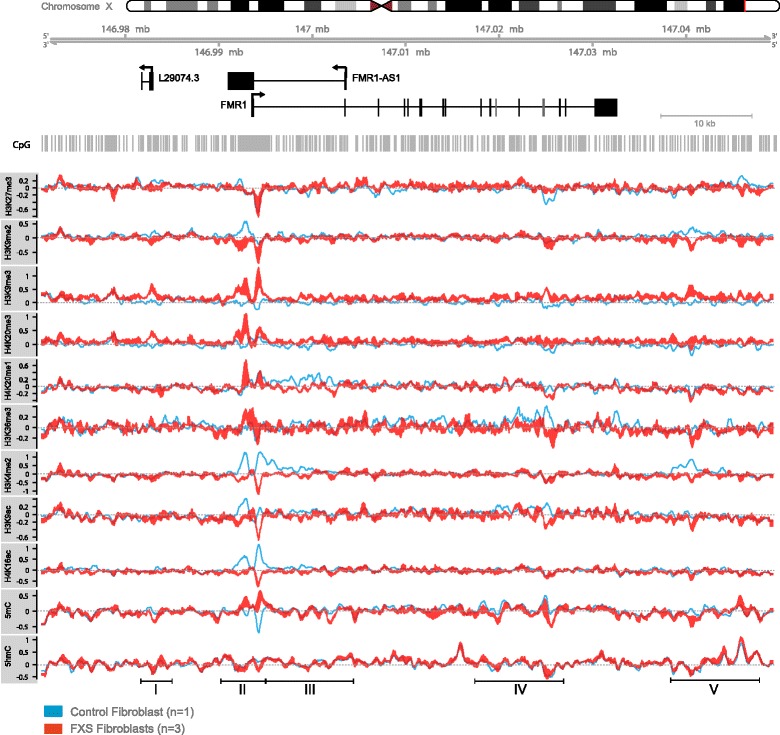
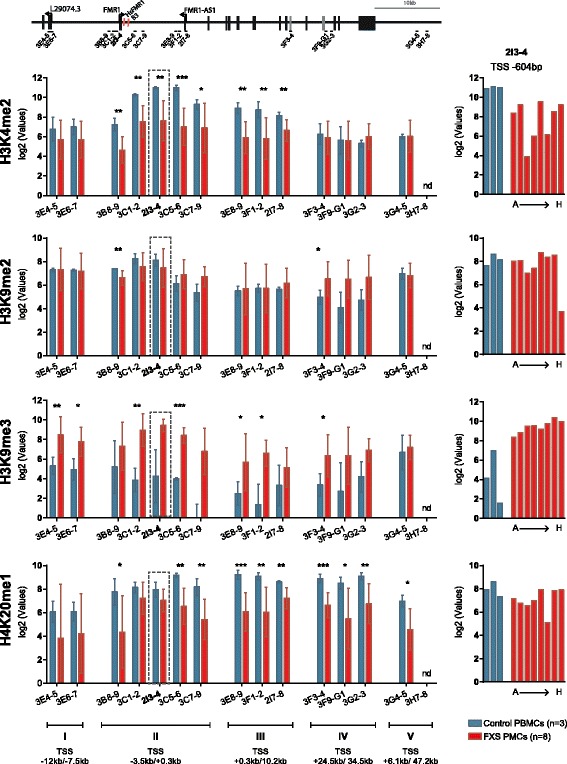
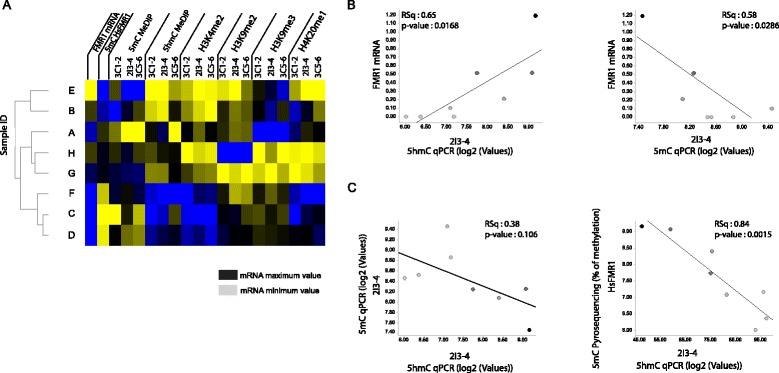
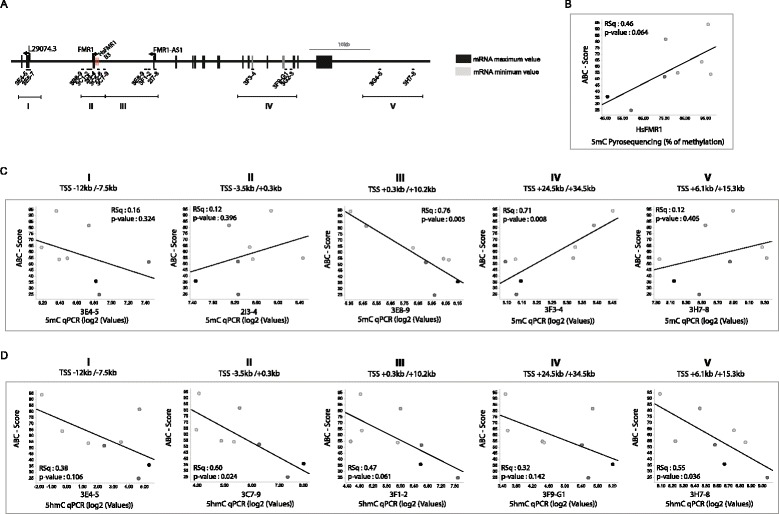
Results: We have deployed customized epigenomic profiling assays to comprehensively map the FMR1 locus chromatin landscape in peripheral mononuclear blood cells (PBMCs) from eight FXS patients and in fibroblast cell lines derived from three FXS patient. Deoxyribonucleic acid (DNA) methylation (5-methylcytosine (5mC)) and hydroxymethylation (5-hydroxymethylcytosine (5hmC)) profiling using methylated DNA immunoprecipitation (MeDIP) combined with a custom FMR1 microarray identifies novel regions of DNA (hydroxy)methylation changes within the FMR1 gene body as well as in proximal flanking regions. At the region surrounding the FMR1 transcriptional start sites, increased levels of 5mC were associated to reciprocal changes in 5hmC, representing a novel molecular feature of FXS disease. Locus-specific validation of FMR1 5mC and 5hmC changes highlighted inter-individual differences that may account for the expected DNA methylation mosaicism observed at the FMR1 locus in FXS patients. Chromatin immunoprecipitation (ChIP) profiling of FMR1 histone modifications, together with 5mC/5hmC and gene expression analyses, support a functional relationship between 5hmC levels and FMR1 transcriptional activation and reveal cell-type specific differences in FMR1 epigenetic regulation. Furthermore, whilst 5mC FMR1 levels positively correlated with FXS disease severity (clinical scores of aberrant behavior), our data reveal for the first time an inverse correlation between 5hmC FMR1 levels and FXS disease severity.
Conclusions: We identify novel, cell-type specific, regions of FMR1 epigenetic changes in FXS patient cells, providing new insights into the molecular mechanisms of FXS. We propose that the combined measurement of 5mC and 5hmC at selected regions of the FMR1 locus may significantly enhance FXS clinical diagnostics and patient stratification.
Keywords: 5-hydroxymethylation (5hmC); Chromatin profiling; Clinical biomarker; Epigenetic silencing, FMR1; Fragile X syndrome (FXS).
Figures
Similar articles
-
The FMR1 promoter is selectively hydroxymethylated in primary neurons of fragile X syndrome patients.Hum Mol Genet. 2016 Nov 15;25(22):4870-4880. doi: 10.1093/hmg/ddw311. Hum Mol Genet. 2016. PMID: 28173181 Free PMC article.
-
Epigenetic characterization of the FMR1 gene and aberrant neurodevelopment in human induced pluripotent stem cell models of fragile X syndrome.PLoS One. 2011;6(10):e26203. doi: 10.1371/journal.pone.0026203. Epub 2011 Oct 12. PLoS One. 2011. PMID: 22022567 Free PMC article.
-
DNA Methylation, Mechanisms of FMR1 Inactivation and Therapeutic Perspectives for Fragile X Syndrome.Biomolecules. 2021 Feb 16;11(2):296. doi: 10.3390/biom11020296. Biomolecules. 2021. PMID: 33669384 Free PMC article. Review.
-
CGG-repeat dynamics and FMR1 gene silencing in fragile X syndrome stem cells and stem cell-derived neurons.Mol Autism. 2016 Oct 6;7:42. doi: 10.1186/s13229-016-0105-9. eCollection 2016. Mol Autism. 2016. PMID: 27713816 Free PMC article.
-
Epigenetic modifications in human fragile X pluripotent stem cells; Implications in fragile X syndrome modeling.Brain Res. 2017 Feb 1;1656:55-62. doi: 10.1016/j.brainres.2015.10.004. Epub 2015 Oct 20. Brain Res. 2017. PMID: 26475977 Review.
Cited by
-
Therapeutic strategies for fragile X syndrome and implications for other gene-silencing disorders.Nat Genet. 2025 Aug;57(8):1812-1822. doi: 10.1038/s41588-025-02255-6. Epub 2025 Jul 17. Nat Genet. 2025. PMID: 40676228 Review.
-
Computational methods and next-generation sequencing approaches to analyze epigenetics data: Profiling of methods and applications.Methods. 2021 Mar;187:92-103. doi: 10.1016/j.ymeth.2020.09.008. Epub 2020 Sep 14. Methods. 2021. PMID: 32941995 Free PMC article. Review.
-
A Lexicon of DNA Modifications: Their Roles in Embryo Development and the Germline.Front Cell Dev Biol. 2018 Mar 27;6:24. doi: 10.3389/fcell.2018.00024. eCollection 2018. Front Cell Dev Biol. 2018. PMID: 29637072 Free PMC article. Review.
-
Of Men and Mice: Modeling the Fragile X Syndrome.Front Mol Neurosci. 2018 Mar 15;11:41. doi: 10.3389/fnmol.2018.00041. eCollection 2018. Front Mol Neurosci. 2018. PMID: 29599705 Free PMC article.
-
Exploring the epigenetic landscape: The role of 5-hydroxymethylcytosine in neurodevelopmental disorders.Camb Prism Precis Med. 2024 Apr 1;2:e5. doi: 10.1017/pcm.2024.2. eCollection 2024. Camb Prism Precis Med. 2024. PMID: 38699519 Free PMC article. Review.
References
Publication types
MeSH terms
Substances
LinkOut - more resources
Full Text Sources
Other Literature Sources
Medical
