. 2016 Feb 6;6(1):20150055.
doi: 10.1098/rsfs.2015.0055.

Modelling of bone fracture and strength at different length scales: a review

Affiliations

Modelling of bone fracture and strength at different length scales: a review

Fereshteh A Sabet et al. Interface Focus. .

Abstract

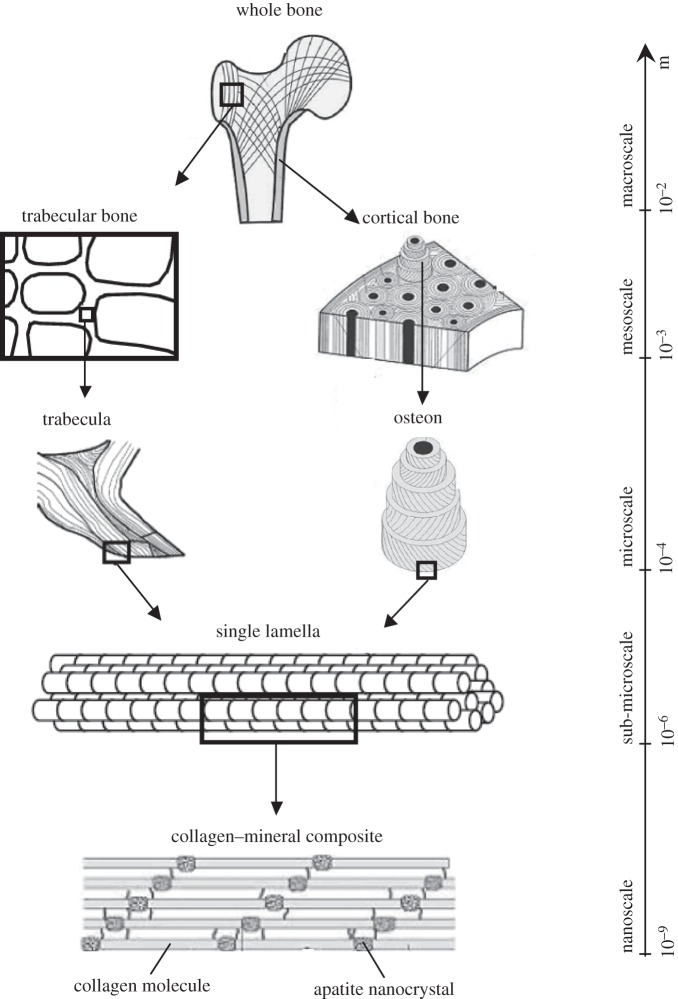
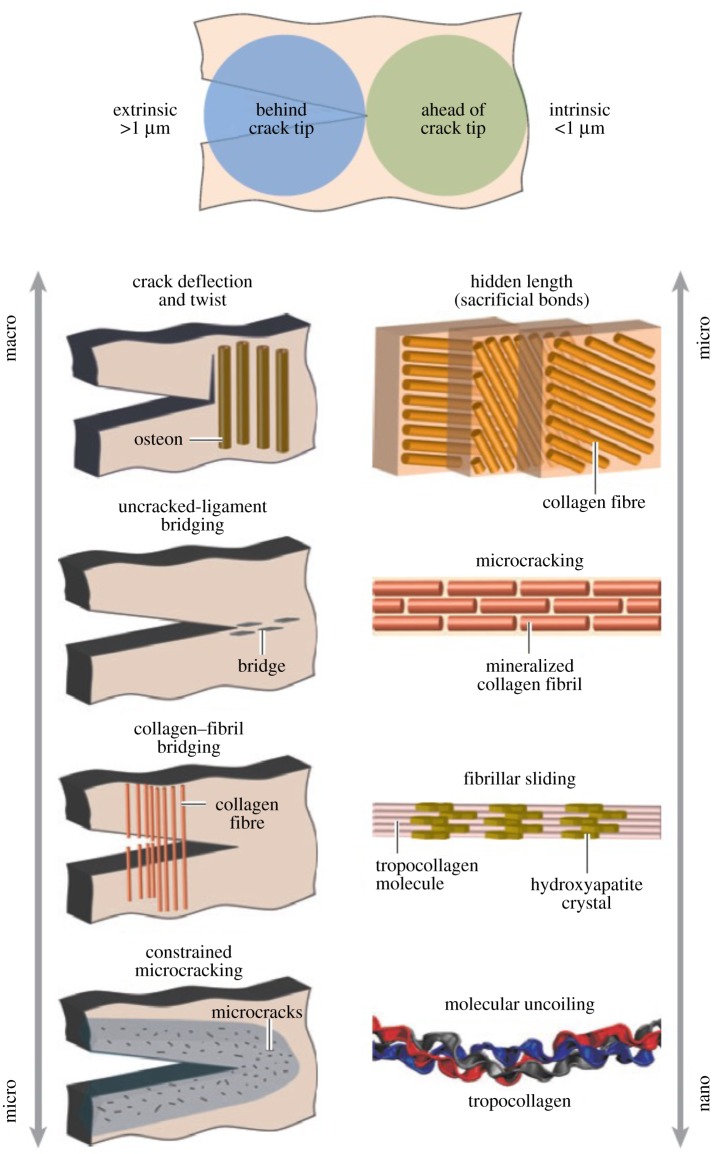
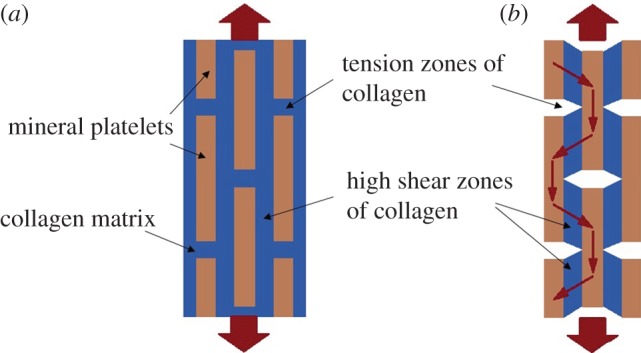
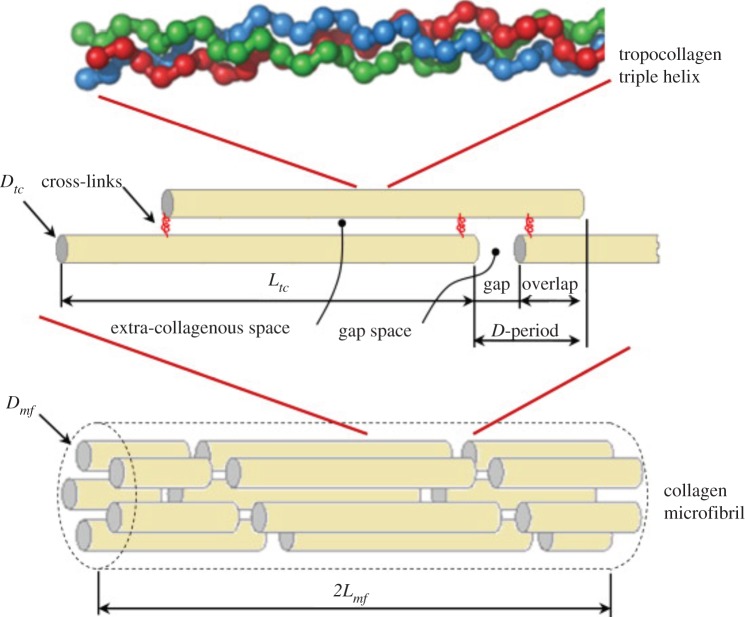
In this paper, we review analytical and computational models of bone fracture and strength. Bone fracture is a complex phenomenon due to the composite, inhomogeneous and hierarchical structure of bone. First, we briefly summarize the hierarchical structure of bone, spanning from the nanoscale, sub-microscale, microscale, mesoscale to the macroscale, and discuss experimental observations on failure mechanisms in bone at these scales. Then, we highlight representative analytical and computational models of bone fracture and strength at different length scales and discuss the main findings in the context of experiments. We conclude by summarizing the challenges in modelling of bone fracture and strength and list open topics for scientific exploration. Modelling of bone, accounting for different scales, provides new and needed insights into the fracture and strength of bone, which, in turn, can lead to improved diagnostic tools and treatments of bone diseases such as osteoporosis.

Keywords: bone fracture; bone strength; computational modelling; hierarchical structure; multiscale modelling.


Figures

Figure 1.
Figure 1.
Hierarchical structure of bone, spanning from the nanoscale to macroscale.
Figure 2.
Figure 2.
Bone toughness mechanisms at different levels of hierarchy. The toughness of bone results from a mutual competition between extrinsic (crack-tip shielding) toughening mechanisms and intrinsic (plastic deformation) toughening mechanisms. Molecular uncoiling and intermolecular sliding of molecules are observed at the smallest level of TC molecules and mineralized collagen fibrils. Microcracking and fibrillar sliding are observed at the level of fibril arrays. At larger levels, the breaking of sacrificial bonds contributes to increasing the energy dissipation capacity of bone at the interface of fibril arrays, together with crack bridging by collagen fibrils. At the largest length scales in the 10–100 µm range, the primary sources of toughening are extrinsic and result from extensive crack deflection and crack bridging by uncracked ligaments, both of which are mechanisms that are motivated by the occurrence of microcracking [32]. (Online version in colour.)
Figure 3.
Figure 3.
A schematic of the shear-lag model proposed by Jäger & Fratzl [113] representing (a) staggered HA crystals embedded in protein matrix and (b) the load-carrying structure of the collagen–mineral composite [113,114]. (Online version in colour.)
Figure 4.
Figure 4.
The Hambli & Barkaoui [136] model geometry: five TC molecules shifted by the interval D = 67 nm forming a cylindrical shape, mineral phase filling the gap and extra-collagenous space and cross-links joining two TC molecule ends. (Online version in colour.)
Figure 5.
Figure 5.
The geometry of the collagen–HA nanocomposite used by Libonati et al. [151]. The building blocks, namely amino acid chains, collagen chains and the HA unit cell, are depicted on the right. (Online vesion in colour.)
Figure 6.
Figure 6.
Example of force–displacement curves from [151]. (a) Comparison between the initial structure and the confined one. (b) Comparison between a dry (vacuum) case and wet case: the water causes a general increase in the mechanical properties owing to the interactions with mineral and protein.
Figure 7.
Figure 7.
Model of the osteonal cortical bone microstructure with arbitrary oriented microcracks employed by Raeisi Najafi et al. [163].
Figure 8.
Figure 8.
Microcrack propagation trajectory under tension in the Raeisi Najafi et al. [74] model—the propagation trajectory was deviated as approaching the osteon: (a) primary microcrack, (b–d) propagated microcrack with (b) E0 = 10 GPa, Ei = 26 GPa, Ec = 6 GPa; (c) E0 = 19 GPa, Ei = 26 GPa, Ec = 6 GPa; (d) E0 = 19 GPa, Ei = 15 GPa, Ec = 24 GPa.
Figure 9.
Figure 9.
Microcrack propagation severely affected by separation of osteons [74]. Close proximity of osteons will not allow microcrack propagation between the osteons. (a,c) Primary microcrack; (b,d) propagated microcrack.
Figure 10.
Figure 10.
Microcrack propagation trajectory under compression in the Raeisi Najafi et al. [74] study.
Figure 11.
Figure 11.
The Mischinski & Ural [175] cohesive FEM model of a single osteon. (a) FEM mesh demonstrating crack penetration into an osteon for a 0° crack, (b) stress contours showing the different stages of crack propagation for 0° crack penetration, (c) FEM mesh demonstrating crack deflection into the cement line for a 45° crack, and (d) stress contours showing the different stages of crack propagation for a 45° crack deflection. (Online version in colour.)
Figure 12.
Figure 12.
Example of the Budyn et al. [168] model geometry with strain distribution before crack initiation. (Online version in colour.)
Figure 13.
Figure 13.
Examples of the Budyn et al. [168] model with different microstructure showing crack initiation in blue and crack growth in red.
Figure 14.
Figure 14.
The Abdel-Wahab et al. [166] model—distribution of maximum principal stress in the vicinity of (a) upper and (c) lower microcracks at the crack initiation increment, and for increments of (b) arrest of the upper microcrack by void, and (d) arrest of the lower microcrack at the cement line. (Online version in colour.)
Figure 15.
Figure 15.
Budyn et al.'s [184] results of human cortical bone modelling under seven steps of applied compression. (a) Light microscopy observations of cracked microstructure, (b) displacement field in the direction of applied compression, (c) longitudinal stress and (d) local damage fields in the FEM solution.
Figure 16.
Figure 16.
Overview of the Dragomir-Daescu et al. [208] QCT/FEA modelling steps, from QCT scan to simulation of fracture. (Online version in colour.)
Figure 17.
Figure 17.
Results of the Hambli et al. [223] model. (ad) Accumulation of continuum damage in the proximal femur; (eh) corresponding crack propagation. (Online version in colour.)
Figure 18.
Figure 18.
The Ural & Mischinski [246] model geometry: (a) part 1, microscopy image of cortical bone; (b) part 1, FEM model; (c) part 2, schematic of detailed microstructure; (d) part 2, FEM model; (e) part 3, a sketch of the human forearm highlighting the section that was modelled; and (f) three-dimensional FEM model of an idealized human radius bone. (Online version in colour.)

References

    1. Olszta MJ, Cheng X, Soo Jee S, Kumar R, Kim Y-Y, Kaufman MJ, Douglas EP, Gower LB. 2007. Bone structure and formation: a new perspective. Mater. Sci. Eng. R 58, 77–116. ( 10.1016/j.mser.2007.05.001) - DOI
    1. Novitskaya E, Po-Yu C, Elham H, Li J, Vlado L, Iwona J, Joanna M. 2011. Recent advances on the measurement and calculation of the elastic moduli of cortical and trabecular bone: a review. Theor. Appl. Mech. 38, 209–297. ( 10.2298/TAM1103209N) - DOI
    1. Boskey AL. 2003. Bone mineral crystal size. Osteoporos. Int. 14, 16–21. ( 10.1007/s00198-003-1468-2) - DOI - PubMed
    1. Fratzl P, Groschner M, Vogl G, Plenk H, Eschberger J, Fratzl-Zelman N, Koller K, Klaushofer K. 1992. Mineral crystals in calcified tissues: a comparative study by SAXS. J. Bone Miner. Res. 7, 329–334. ( 10.1002/jbmr.5650070313) - DOI - PubMed
    1. Jackson SA, Cartwright AG, Lewis D. 1978. Morphology of bone-mineral crystals. Cacif. Tissue Int. 25, 217–222. - PubMed

LinkOut - more resources