Advancing multiscale structural mapping of the brain through fluorescence imaging and analysis across length scales
- PMID: 26855758
- PMCID: PMC4686247
- DOI: 10.1098/rsfs.2015.0081
Advancing multiscale structural mapping of the brain through fluorescence imaging and analysis across length scales
Abstract
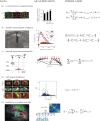
Brain function emerges from hierarchical neuronal structure that spans orders of magnitude in length scale, from the nanometre-scale organization of synaptic proteins to the macroscopic wiring of neuronal circuits. Because the synaptic electrochemical signal transmission that drives brain function ultimately relies on the organization of neuronal circuits, understanding brain function requires an understanding of the principles that determine hierarchical neuronal structure in living or intact organisms. Recent advances in fluorescence imaging now enable quantitative characterization of neuronal structure across length scales, ranging from single-molecule localization using super-resolution imaging to whole-brain imaging using light-sheet microscopy on cleared samples. These tools, together with correlative electron microscopy and magnetic resonance imaging at the nanoscopic and macroscopic scales, respectively, now facilitate our ability to probe brain structure across its full range of length scales with cellular and molecular specificity. As these imaging datasets become increasingly accessible to researchers, novel statistical and computational frameworks will play an increasing role in efforts to relate hierarchical brain structure to its function. In this perspective, we discuss several prominent experimental advances that are ushering in a new era of quantitative fluorescence-based imaging in neuroscience along with novel computational and statistical strategies that are helping to distil our understanding of complex brain structure.
Keywords: brain structure; fluorescence imaging; multiscale analysis and modelling.
Figures


Similar articles
-
Multi-scale light microscopy/electron microscopy neuronal imaging from brain to synapse with a tissue clearing method, ScaleSF.iScience. 2021 Dec 27;25(1):103601. doi: 10.1016/j.isci.2021.103601. eCollection 2022 Jan 21. iScience. 2021. PMID: 35106459 Free PMC article.
-
Multiscale and Multimodal Optical Imaging of the Ultrastructure of Human Liver Biopsies.Front Physiol. 2021 Feb 17;12:637136. doi: 10.3389/fphys.2021.637136. eCollection 2021. Front Physiol. 2021. PMID: 33679449 Free PMC article.
-
Light Sheet Illumination for 3D Single-Molecule Super-Resolution Imaging of Neuronal Synapses.Front Synaptic Neurosci. 2021 Nov 24;13:761530. doi: 10.3389/fnsyn.2021.761530. eCollection 2021. Front Synaptic Neurosci. 2021. PMID: 34899261 Free PMC article. Review.
-
Differentiation and Characterization of Excitatory and Inhibitory Synapses by Cryo-electron Tomography and Correlative Microscopy.J Neurosci. 2018 Feb 7;38(6):1493-1510. doi: 10.1523/JNEUROSCI.1548-17.2017. Epub 2018 Jan 8. J Neurosci. 2018. PMID: 29311144 Free PMC article.
-
[Comparison and progress review of various super-resolution fluorescence imaging techniques].Se Pu. 2021 Oct;39(10):1055-1064. doi: 10.3724/SP.J.1123.2021.06015. Se Pu. 2021. PMID: 34505427 Free PMC article. Review. Chinese.
Cited by
-
A frequency-domain model-based reconstruction method for transcranial photoacoustic imaging: A 2D numerical investigation.Photoacoustics. 2023 Sep 21;33:100561. doi: 10.1016/j.pacs.2023.100561. eCollection 2023 Oct. Photoacoustics. 2023. PMID: 38021290 Free PMC article.
-
Imaging analysis of the interface between osteoblasts and microrough surfaces of laser-sintered titanium alloy constructs.J Microsc. 2018 Apr;270(1):41-52. doi: 10.1111/jmi.12648. Epub 2017 Sep 28. J Microsc. 2018. PMID: 28960365 Free PMC article.
-
Hard X-Ray Nanoholotomography: Large-Scale, Label-Free, 3D Neuroimaging beyond Optical Limit.Adv Sci (Weinh). 2018 Mar 30;5(6):1700694. doi: 10.1002/advs.201700694. eCollection 2018 Jun. Adv Sci (Weinh). 2018. PMID: 29938163 Free PMC article.
-
Imaging crossing fibers in mouse, pig, monkey, and human brain using small-angle X-ray scattering.Acta Biomater. 2023 Jul 1;164:317-331. doi: 10.1016/j.actbio.2023.04.029. Epub 2023 Apr 23. Acta Biomater. 2023. PMID: 37098400 Free PMC article.
-
A combinatorial method to visualize the neuronal network in the mouse spinal cord: combination of a modified Golgi-Cox method and synchrotron radiation micro-computed tomography.Histochem Cell Biol. 2021 Apr;155(4):477-489. doi: 10.1007/s00418-020-01949-8. Epub 2021 Jan 4. Histochem Cell Biol. 2021. PMID: 33398435 Free PMC article.
References
-
- Cajal SR. 1894. The Croonian lecture: la fine structure des centres nerveux. Proc. R. Soc. Lond. 55, 444–468. (10.1098/rspl.1894.0063) - DOI
-
- Cajal SR. 1906. In Nobel Lectures, physiology or medicine 1901–1921.
Grants and funding
LinkOut - more resources
Full Text Sources
Other Literature Sources
Research Materials

