Comparative Study
. 2016 Feb 5:6:6.
doi: 10.1186/s13395-016-0076-8. eCollection 2016.

Alternating bipolar field stimulation identifies muscle fibers with defective excitability but maintained local Ca(2+) signals and contraction

Affiliations
Comparative Study

Alternating bipolar field stimulation identifies muscle fibers with defective excitability but maintained local Ca(2+) signals and contraction

Erick O Hernández-Ochoa et al. Skelet Muscle. .

Abstract

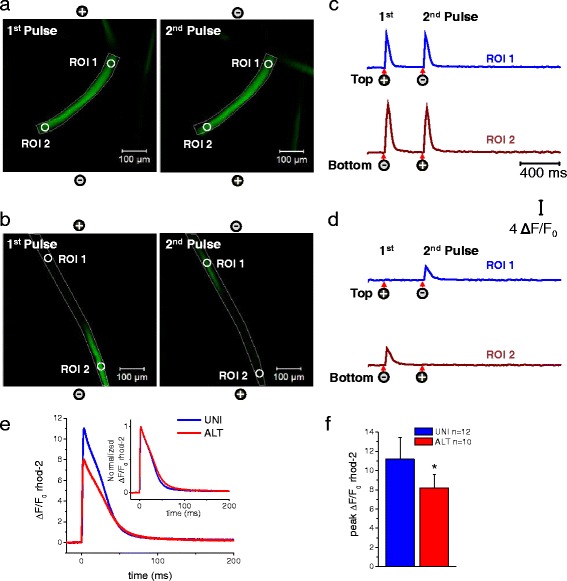
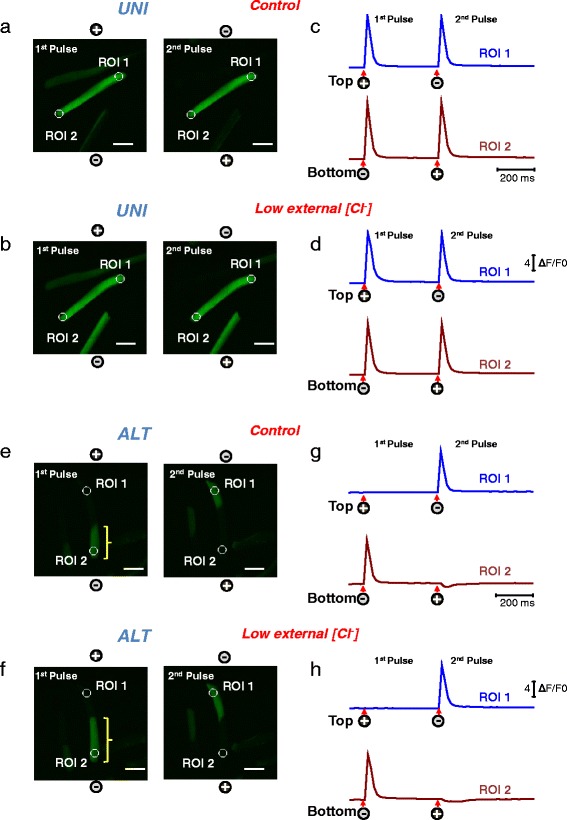
Background: Most cultured enzymatically dissociated adult myofibers exhibit spatially uniform (UNI) contractile responses and Ca(2+) transients over the entire myofiber in response to electric field stimuli of either polarity applied via bipolar electrodes. However, some myofibers only exhibit contraction and Ca(2+) transients at alternating (ALT) ends in response to alternating polarity field stimulation. Here, we present for the first time the methodology for identification of ALT myofibers in primary cultures and isolated muscles, as well as a study of their electrophysiological properties.

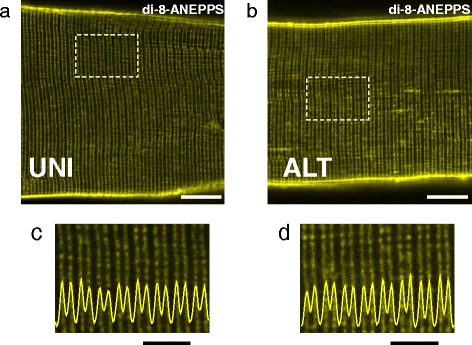
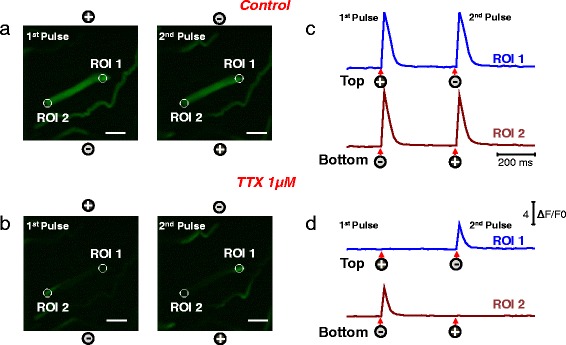
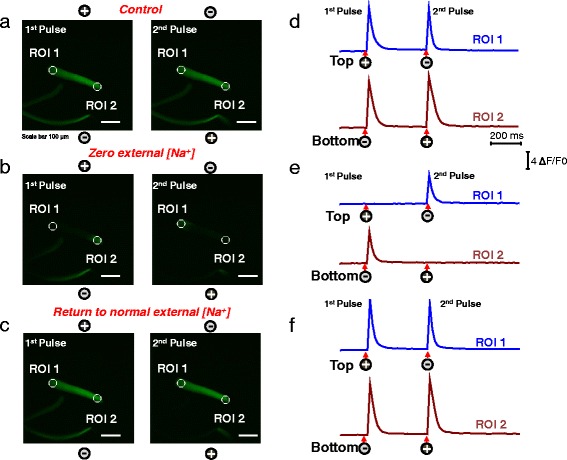
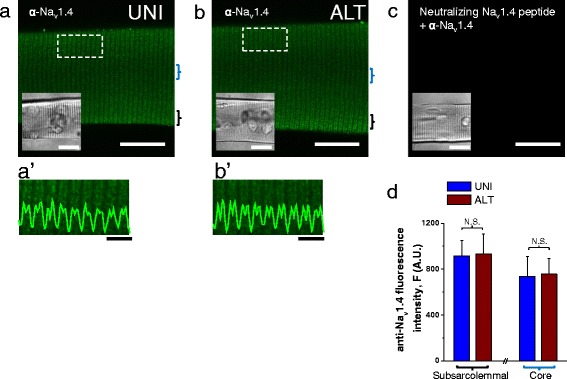
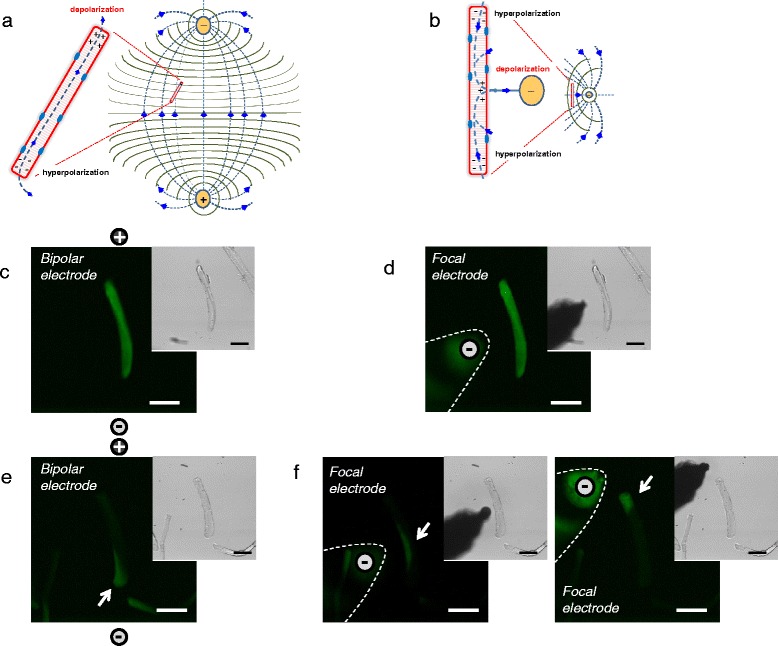
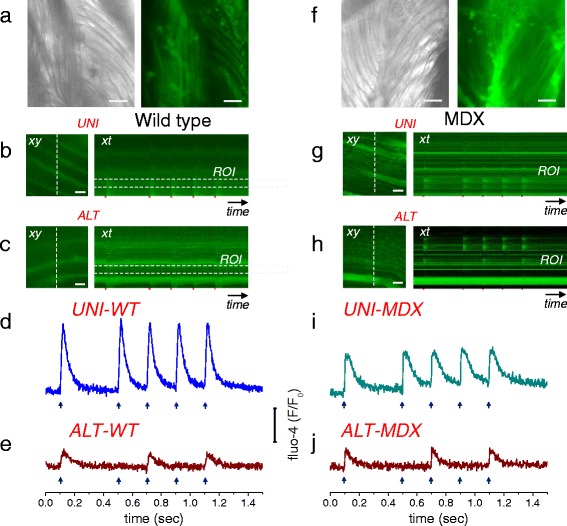
Results: We used high-speed confocal microscopic Ca(2+) imaging, electric field stimulation, microelectrode recordings, immunostaining, and confocal microscopy to characterize the properties of action potential-induced Ca(2+) transients, contractility, resting membrane potential, and staining of T-tubule voltage-gated Na(+) channel distribution applied to cultured adult myofibers. Here, we show for the first time, with high temporal and spatial resolution, that normal control myofibers with UNI responses can be converted to ALT response myofibers by TTX addition or by removal of Na(+) from the bathing medium, with reappearance of the UNI response on return of Na(+). Our results suggest disrupted excitability as the cause of ALT behavior and indicate that the ALT response is due to local depolarization-induced Ca(2+) release, whereas the UNI response is triggered by action potential propagation over the entire myofiber. Consistent with this interpretation, local depolarizing monopolar stimuli give uniform (propagated) responses in UNI myofibers, but only local responses at the electrode in ALT myofibers. The ALT responses in electrically inexcitable myofibers are consistent with expectations of current spread between bipolar stimulating electrodes, entering (hyperpolarizing) one end of a myofiber and leaving (depolarizing) the other end of the myofiber. ALT responses were also detected in some myofibers within intact isolated whole muscles from wild-type and MDX mice, demonstrating that ALT responses can be present before enzymatic dissociation.

Conclusions: We suggest that checking for ALT myofiber responsiveness by looking at the end of a myofiber during alternating polarity stimuli provides a test for compromised excitability of myofibers, and could be used to identify inexcitable, damaged or diseased myofibers by ALT behavior in healthy and diseased muscle.

Keywords: Abnormal excitability; Cultured myofibers; Enzymatic dissociation; Excitation-contraction coupling; Skeletal muscle.


Figures

Fig. 1
Fig. 1
Electrically induced Ca2+ transients in myofibers exhibiting spatially uniform activation (UNI) or myofibers showing alternate end activation (ALT) in response to alternating polarity electric field stimulation. Spatio-temporal properties of depolarization-induced rhod-2 Ca2+ transients in myofibers that responded with uniform responses (a UNI) and myofibers showing local alternating end responses (b ALT) when stimulated with a bipolar field stimulation of alternating polarity and imaged in frame mode (xy-t; 60 frames/s) using high-speed confocal microscope. Images labeled as first and second in a and b represent snap shots of the time series at the peak of the transients in response to two sequential field pulses (0.5 ms; 15 V/cm) separated by an interval of 400 ms. See video in Additional file 3 for the entire time series. UNI myofibers exhibit a global Ca2+ transient in response to pulses of both polarities during alternating polarity stimulation, whereas ALT myofibers display only local non-propagated responses at alternating ends upon application of pulses of alternate polarity. The polarity signs indicate the location of the electrodes and their polarity for each stimulus. c and d are shown the time course of the rhod-2 fluorescence measured at the ends of the myofibers. Circles labeled as regions of interest (ROI) show ROI 1 (myofiber’s upper end, blue trace) and ROI 2 (myofiber’s lower end, dark red trace) show the locations used to measure the time course of the rhod-2 fluorescence. Arrows and signs under the traces indicate both the polarity and the time when the pulses where applied. Vertical scale: ΔF/F0 = 4; horizontal scale: time 400 ms. e Averaged time courses of the rhod-2 fluorescence measured in UNI myofibers and at the responding end of the ALT myofibers using ultra high-speed line scanning (100 μs/line) to further characterize the temporal properties of the Ca2+ transients. Inset, Time course of the normalized Ca2+ transients in the UNI and ALT myofibers derived from panel E to compare the kinetics of Ca2+ transients. f Bar plot summarizing differences in peak amplitude of rhod-2 ΔF/F0 transient. UNI fibers: ΔF/F0 = 11.18 ± 2.2, n = 12, N = 3; ALT fibers: ΔF/F0 = 8.15 ± 1.4, n = 10, N = 3. N indicates number of mice per condition, and n indicates number of fibers tested.*Indicates P < 0.05 when compared with UNI control fibers, two-sample t test
Fig. 2
Fig. 2
Evaluation of the T-tubule system of UNI and ALT myofibers. a, b Representative confocal images of a UNI myofiber (a) or an ALT myofiber (b) stained with di-8-ANEPPS to visualize the sarcolemma and T-tubules. Scale bars in a, b are 10 μm. c, d Bottom panels are zoom-in versions of boxed regions indicated in panels a and b. Traces inserted in zoomed-in images are averaged fluorescence profiles across the box, scale bars: 5 μm. In control UNI myofibers (n = 18, N = 3), T-tubules are organized in a regular striated pattern. No changes in T-tubule morphology are seen in ALT myofibers (n = 16, N = 3). N indicates number of mice per condition, and n indicates number of myofibers imaged
Fig. 3
Fig. 3
Myofibers exhibiting UNI responses under control conditions exhibit local Ca2+ transients (ALT responses) when treated with TTX. Myofibers with uniform responses were loaded with rhod-2, and their Ca2+ responses to electrical stimulation were recorded before and after the addition of TTX, a voltage-dependent Na+ channel blocker. Spatio-temporal properties of depolarization-induced rhod-2 Ca2+ transients in a myofiber that exhibited uniform responses in a physiological recording solution (a UNI) and ALT responses after treatment with TTX (b). Rhod-2 signals were imaged and analyzed as in Fig. 1 (see video in Additional file 4 for the entire time series). Scale bars in a–b are 100 μm. UNI myofibers exhibit a global Ca2+ transient in response to pulses of alternate polarity; however, the addition of TTX “converts” UNI myofibers into ALT myofibers that display only local non-propagated Ca2+ transients in response to pulses of alternate polarity, as the ALT myofibers described in Fig. 1b. The polarity signs indicate the location of the electrodes and their polarity for each stimulus. c, d show the time course of the rhod-2 fluorescence measured at the ends of the myofibers. Circles labeled as regions of interest (ROI) ROI 1 (myofiber’s upper end, blue trace) and ROI 2 (myofiber’s lower end, dark red trace) show the locations used to measure the time course of the rhod-2 fluorescence. Arrows and signs under the traces indicate both the polarity and the time when the pulses where applied. Vertical scale: ΔF/F0 = 4; horizontal scale: time 200 ms
Fig. 4
Fig. 4
Myofibers with uniform responses challenged with a Na+-free extracellular solution exhibit local ALT Ca2+ transients that reverse to UNI responses upon return to normal Na+ containing external solution. Myofibers with uniform responses were loaded with rhod-2 and their Ca2+ transients elicited by electrical stimulation were recorded (a) before, during the treatment with a Na+-free external solution (b), and after washout and return to normal physiological solution (c). After challenging the myofiber with Na-free solution their Ca2+ transients show local and alternate responses when stimulated with alternating polarity bipolar field stimulation. Upon washout of the Na+ free solution and return to physiological conditions, the uniform behavior is completely restored. Rhod-2 signals were imaged and analyzed as in Fig. 1. See video in Additional file 5 (UNI myofiber challenged with Na+-free solution, and the reversibility of effects of Na+-free solution) for the entire time series. The polarity signs indicate the location of the electrodes and their polarity at any given time. Scale bars in a–c are 100 μm. d–f shows the time course of the rhod-2 fluorescence measured at the ends of the myofibers. Circles labeled as regions of interest (ROI) show ROI 1 (myofiber’s upper end, blue trace) and ROI 2 (myofiber’s lower end, dark red trace) the locations used to measure the time course of the rhod-2 fluorescence. Arrows and signs under the traces indicate both the polarity and the time when the pulses where applied. Vertical scale: ΔF/F0 = 4; horizontal scale: time 200 ms
Fig. 5
Fig. 5
Myofibers with UNI or ALT responses challenged with a low [Cl] extracellular solution exhibit modest alterations on excitability. Myofibers with uniform or alternate responses were loaded with rhod-2 and their Ca2+ responses to electrical stimulation were recorded before and after the perfusion with a low [Cl] external solution. Spatio-temporal properties of electrically induced Ca2+ transients in myofibers that exhibited uniform or alternate responses in a physiological recording solution (a UNI, e ALT) and after treatment with a low [Cl] external solution (b UNI, f ALT). Rhod-2 signals were imaged and analyzed as in Fig. 1. Scale bars in a, b, e, and f are 100 μm. UNI myofibers displayed a global Ca2+ transient in response to pulses of alternate polarity, and the perfusion of the low [Cl] external solution produced negligible effects on the properties of the Ca2+ transients. Similarly, ALT myofibers displayed only local non-propagated responses at alternating ends upon application of pulses of alternate polarity and perfusion of the low [Cl] external solution produced negligible effects on the overall ALT phenotype; however, in ALT fibers exposed to low [Cl] solution, the longitudinal spread of the electrically elicited Ca2+ transient is increased (compare brackets length in e and f). c, d, g, and h show the time course of the rhod-2 fluorescence measured at the ends of the myofibers. Circles labeled as regions of interest ROI 1 (myofiber’s upper end, blue trace) and ROI 2 (myofiber’s lower end, dark red trace) show the locations used to measure the time course of the rhod-2 fluorescence. Arrows and signs under the traces indicate both the polarity and the time when the pulses were applied. Vertical scale: ΔF/F0 = 4; horizontal scale: time 200 ms
Fig. 6
Fig. 6
Nav1.4 sodium channel localization in UNI and ALT myofibers. Exemplar confocal images of UNI (a) and ALT (b) myofibers labeled with antibody to the intracellular II-III loop of Nav1.4. UNI and ALT fibers were identified using field stimulation and their locations within any tested dish were saved using a computer-controlled and motorized microscope stage, and then subjected to immunostaining protocol. After immunostaining, the same computer-controlled stage was used to localize and image the previously stored locations of corresponding UNI and ALT myofibers and then confocal imaging was performed. In each case, images show single confocal slices through the middle of the myofibers. Scale bars in a–c are 100 μm. a'b' panels are zoomed-in versions of boxed regions indicated in panels a and b. Traces inserted on a'b' are averaged fluorescence profiles across the box, scale bars: 4 μm. In both a-a' and b-b', the immunofluorescent staining is localized to repeated transversely oriented bands whose general periodicity corresponded to that of T-tubules (see Fig. 2a, b). These images show that there are little, if any, differences in the immunolocalization of Nav1.4 channels between UNI and ALT myofiber types. c shows myofiber where the Nav1.4 antibody was preincubated with the Nav1.4 II-III loop neutralizing peptide before labeling. Insets in a-c are transmitted light images of myofibers shown in confocal images. d bar plot summarizing Nav1.4 channel staining intensity measured at the subsarcolemmal and core regions of UNI and ALT myofibers. N.S. Indicates P > 0.05 when compared with UNI control fibers, two-sample t test
Fig. 7
Fig. 7
Extracellular electrode configurations used for electrical field stimulation of isolated myofibers and comparison of responses to stimuli by bipolar and local unipolar electrodes. a Theoretical dipole electrical field pattern and isopotential lines generated with two remote Platinum electrodes, separated by about 5 mm and oriented perpendicular to the bottom of the dish. b Theoretical unipolar electrical field pattern and isopotential lines generated with a focal tungsten extracellular stimulating electrode together with a remote field electrode (note: these cartoons represent a simplified approximation to the size, location, and orientation of the electrodes, electrical field, isopotential lines, and current fluxes). c–f Spatial properties of electrically induced Ca2+ transients in UNI and ALT myofibers in response to bipolar or focal unipolar stimulation. In each case, images are confocal snap shots of the time series at the peak of the transient in response to field stimulation (0.5 ms; 15 V/cm). c and d shows spatial properties of electrically induced Ca2+ transient of a UNI myofiber stimulated with a bipolar electrode (c) or with the focal electrode and using the same myofiber (d) (note: the spatial properties of the Ca2+ transients elicited by the bipolar or the unipolar electrode are similar in the UNI myofiber; the signals spread across the entire myofiber regardless of the electrode configuration used). e, f illustrates spatial properties of electrically induced Ca2+ transients of an ALT myofiber stimulated with bipolar electrodes (e) or with the focal electrode (f) either positioned near the center (f left panel) or near the upper end (f right panel) using the same myofiber. Note the differences in the spatial properties of the Ca2+ transients in the ALT myofiber when elicited with remote bipolar or local unipolar electrode. In the case of bipolar stimulation the Ca2+ transient is local and restricted to one end of the myofiber (e); however, when activated by unipolar stimulation, the Ca2+ signal occurs in the myofiber region in close proximity with the location electrode (f). Insets in c–f are transmitted light images to illustrate myofibers and electrode location
Fig. 8
Fig. 8
Alternate Ca2+ responses are observed in muscle fibers stimulated by bipolar field stimulation in whole muscle from wild-type and MDX mice. a Left panel, transmitted light image (×10 objective) of a segment of a FDB muscle isolated from wild-type mouse showing bundles of myofibers. Right panel, confocal image of the same FDB muscle segment shown on left panel, loaded fluo-4-AM. The whole muscle was explored in search of alternate responses using line-scan (xt) imaging (2 ms/line). b Representative confocal frame (xy, left panel) and line-scan images (xt, right panel) of a FDB segment illustrating uniform (UNI-WT) responses to a single field stimulus followed by a train of four pulses at 5 Hz. c representative frame (xy; left panel) and line-scan (xt; right panel) images of a FDB segment illustrating alternate (ALT-WT) responses to the same field stimulation pattern used in panel b. b, c were imaged with a × 63/1.5 NA objective. Trace in panel d shows time course of fluo-4 signals in the UNI-WT fiber (blue trace). Trace in panel e shows time course of fluo-4 signals of the ALT-WT fiber (red trace). f Left panel, transmitted light image (×10 objective) of a segment of a FDB muscle isolated from MDX mouse. Right panel, confocal image of FDB muscle segment, shown on left panel, loaded fluo-4-AM. g Exemplar confocal frame (xy, left panel) and line-scan images (xt, right panel) of a FDB segment from MDX mouse illustrating uniform (UNI-MDX) responses to field stimuli as used in panel b. h representative confocal frame (xy; left panel) and line-scan (xt; right panel) images of a FDB segment from MDX mouse illustrating alternate (ALT-MDX) responses to the same field stimulation pattern used in panel b. g, h were imaged with a × 10/0.3 NA objective. i shows time course of fluo-4 signals in the UNI-MDX fiber (cyan trace). j shows time course of fluo-4 signals of the ALT-MDX fiber (red trace). The dashed rectangles in b, c, g, and h (right panels) show regions of interest (ROI) used to measure the fluorescence time course. Note that the Ca2+ transients of the UNI-WT and UNI-MDX fibers (d and i) occur in response to each single stimulus (arrows under traces), whereas the ALT-WT and ALT-MDX fibers (e and j) respond to every other stimulus (see arrows under traces). Scale bars in a, f–h: 100 μm; b and c: 20 μm

Similar articles

Cited by

References

    1. Lannergren J, Westerblad H. The temperature dependence of isometric contractions of single, intact fibres dissected from a mouse foot muscle. J Physiol. 1987;390:285–93. doi: 10.1113/jphysiol.1987.sp016700. - DOI - PMC - PubMed
    1. Bischoff R. Proliferation of muscle satellite cells on intact myofibers in culture. Dev Biol. 1986;115(1):129–39. doi: 10.1016/0012-1606(86)90234-4. - DOI - PubMed
    1. Colombini B, Benelli G, Nocella M, Musaro A, Cecchi G, Bagni MA. Mechanical properties of intact single fibres from wild-type and MLC/mIgf-1 transgenic mouse muscle. J Muscle Res Cell Motil. 2009;30(5–6):199–207. doi: 10.1007/s10974-009-9187-8. - DOI - PubMed
    1. Allen DG, Lamb GD, Westerblad H. Skeletal muscle fatigue: cellular mechanisms. Physiol Rev. 2008;88(1):287–332. doi: 10.1152/physrev.00015.2007. - DOI - PubMed
    1. Head SI. Membrane potential, resting calcium and calcium transients in isolated muscle fibres from normal and dystrophic mice. J Physiol. 1993;469(1):11–9. doi: 10.1113/jphysiol.1993.sp019801. - DOI - PMC - PubMed

Publication types

MeSH terms

LinkOut - more resources