

A biophysical model of supercoiling dependent transcription predicts a structural aspect to gene regulation
- PMID: 26855771
- PMCID: PMC4744432
- DOI: 10.1186/s13628-016-0027-0
A biophysical model of supercoiling dependent transcription predicts a structural aspect to gene regulation
Abstract
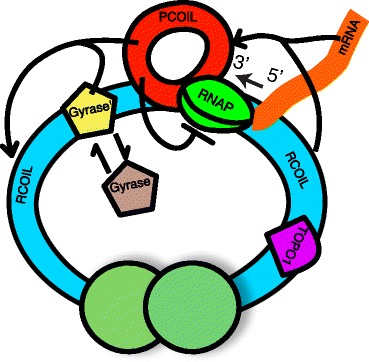
Background: Transcription in Escherichia coli generates positive supercoiling in the DNA, which is relieved by the enzymatic activity of gyrase. Recently published experimental evidence suggests that transcription initiation and elongation are inhibited by the buildup of positive supercoiling. It has therefore been proposed that intermittent binding of gyrase plays a role in transcriptional bursting. Considering that transcription is one of the most fundamental cellular processes, it is desirable to be able to account for the buildup and release of positive supercoiling in models of transcription.
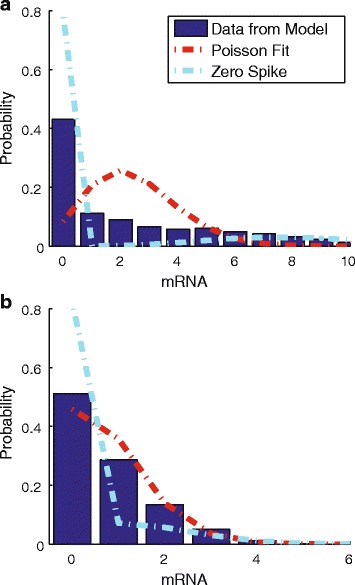
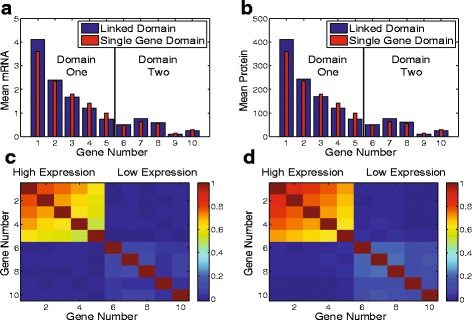
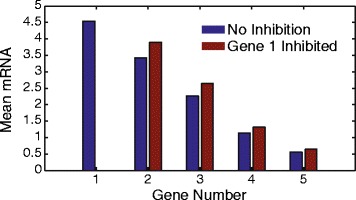
Results: Here we present a detailed biophysical model of gene expression that incorporates the effects of supercoiling due to transcription. By directly linking the amount of positive supercoiling to the rate of transcription, the model predicts that highly transcribed genes' mRNA distributions should substantially deviate from Poisson distributions, with enhanced density at low mRNA copy numbers. Additionally, the model predicts a high degree of correlation between expression levels of genes inside the same supercoiling domain.
Conclusions: Our model, incorporating the supercoiling state of the gene, makes specific predictions that differ from previous models of gene expression. Genes in the same supercoiling domain influence the expression level of neighboring genes. Such structurally dependent regulation predicts correlations between genes in the same supercoiling domain. The topology of the chromosome therefore creates a higher level of gene regulation, which has broad implications for understanding the evolution and organization of bacterial genomes.
Keywords: Bursting; Gene expression; Gyrase; RNA polymerase; Supercoiling; Transcription.
Figures
Similar articles
-
How does supercoiling regulation on a battery of RNA polymerases impact on bacterial transcription bursting?Phys Biol. 2018 Sep 6;15(6):066007. doi: 10.1088/1478-3975/aad933. Phys Biol. 2018. PMID: 30091721
-
Long-Range Supercoiling-Mediated RNA Polymerase Cooperation in Transcription.J Phys Chem B. 2021 May 13;125(18):4692-4700. doi: 10.1021/acs.jpcb.1c01859. Epub 2021 Apr 29. J Phys Chem B. 2021. PMID: 33913709
-
A spatially resolved stochastic model reveals the role of supercoiling in transcription regulation.PLoS Comput Biol. 2022 Sep 19;18(9):e1009788. doi: 10.1371/journal.pcbi.1009788. eCollection 2022 Sep. PLoS Comput Biol. 2022. PMID: 36121892 Free PMC article.
-
The Transcriptome of Streptococcus pneumoniae Induced by Local and Global Changes in Supercoiling.Front Microbiol. 2017 Jul 31;8:1447. doi: 10.3389/fmicb.2017.01447. eCollection 2017. Front Microbiol. 2017. PMID: 28824578 Free PMC article. Review.
-
DNA supercoiling and transcription control: a model from the study of suppression of the leu-500 mutation in Salmonella typhimurium topA- strains.Prog Nucleic Acid Res Mol Biol. 2003;73:43-68. doi: 10.1016/s0079-6603(03)01002-x. Prog Nucleic Acid Res Mol Biol. 2003. PMID: 12882514 Review.
Cited by
-
Selection for ancient periodic motifs that do not impart DNA bending.PLoS Genet. 2020 Oct 6;16(10):e1009042. doi: 10.1371/journal.pgen.1009042. eCollection 2020 Oct. PLoS Genet. 2020. PMID: 33022009 Free PMC article.
-
Transitions in a genetic transcriptional regulatory system under Lévy motion.Sci Rep. 2016 Jul 14;6:29274. doi: 10.1038/srep29274. Sci Rep. 2016. PMID: 27411445 Free PMC article.
-
Bacterial genome architecture shapes global transcriptional regulation by DNA supercoiling.Nucleic Acids Res. 2019 Jun 20;47(11):5648-5657. doi: 10.1093/nar/gkz300. Nucleic Acids Res. 2019. PMID: 31216038 Free PMC article.
-
Complex Diffusion in Bacteria.Adv Exp Med Biol. 2020;1267:15-43. doi: 10.1007/978-3-030-46886-6_2. Adv Exp Med Biol. 2020. PMID: 32894475 Free PMC article. Review.
-
DNA supercoiling is a fundamental regulatory principle in the control of bacterial gene expression.Biophys Rev. 2016 Sep;8(3):209-220. doi: 10.1007/s12551-016-0205-y. Epub 2016 Jun 16. Biophys Rev. 2016. PMID: 28510224 Free PMC article. Review.
References
LinkOut - more resources
Full Text Sources
Other Literature Sources
