

Evaluation of TgH(CX3CR1-EGFP) mice implanted with mCherry-GL261 cells as an in vivo model for morphometrical analysis of glioma-microglia interaction
- PMID: 26856327
- PMCID: PMC4746826
- DOI: 10.1186/s12885-016-2118-3
Evaluation of TgH(CX3CR1-EGFP) mice implanted with mCherry-GL261 cells as an in vivo model for morphometrical analysis of glioma-microglia interaction
Abstract
Background: Glioblastoma multiforme is the most aggressive brain tumor. Microglia are prominent cells within glioma tissue and play important roles in tumor biology. This work presents an animal model designed for the study of microglial cell morphology in situ during gliomagenesis. It also allows a quantitative morphometrical analysis of microglial cells during their activation by glioma cells.
Methods: The animal model associates the following cell types: 1- mCherry red fluorescent GL261 glioma cells and; 2- EGFP fluorescent microglia, present in the TgH(CX3CR1-EGFP) mouse line. First, mCherry-GL261 glioma cells were implanted in the brain cortex of TgH(CX3CR1-EGFP) mice. Epifluorescence - and confocal laser-scanning microscopy were employed for analysis of fixed tissue sections, whereas two-photon laser-scanning microscopy (2P-LSM) was used to track tumor cells and microglia in the brain of living animals.
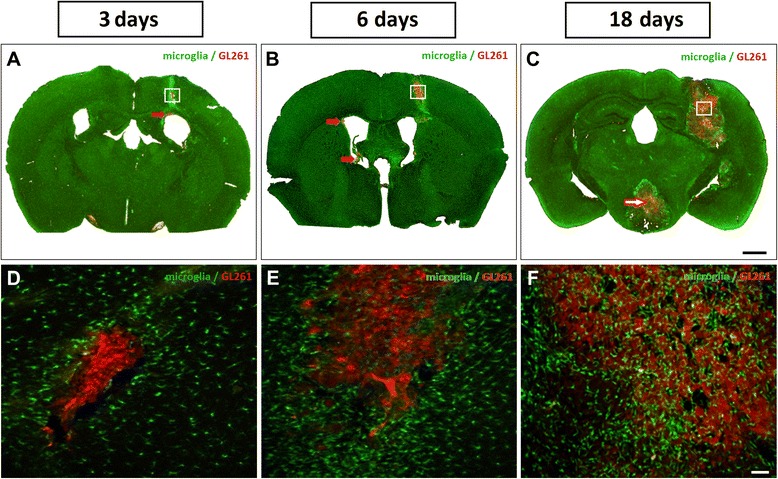
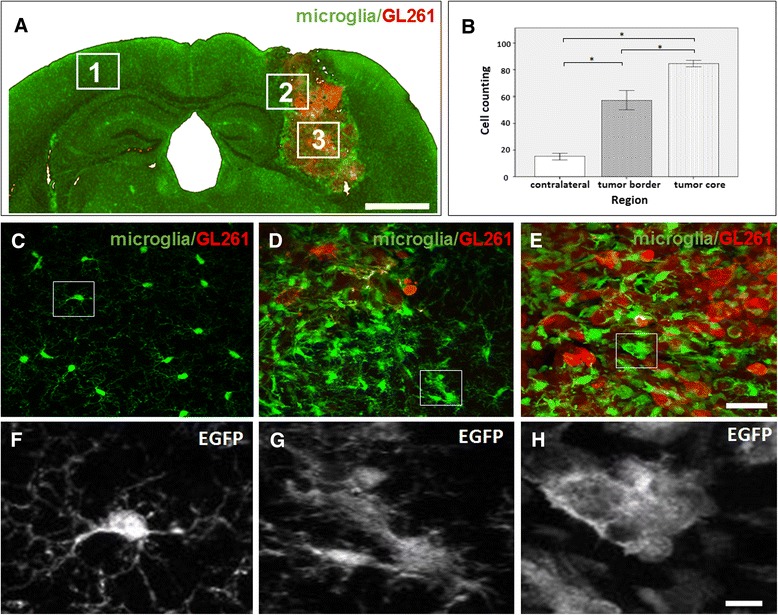
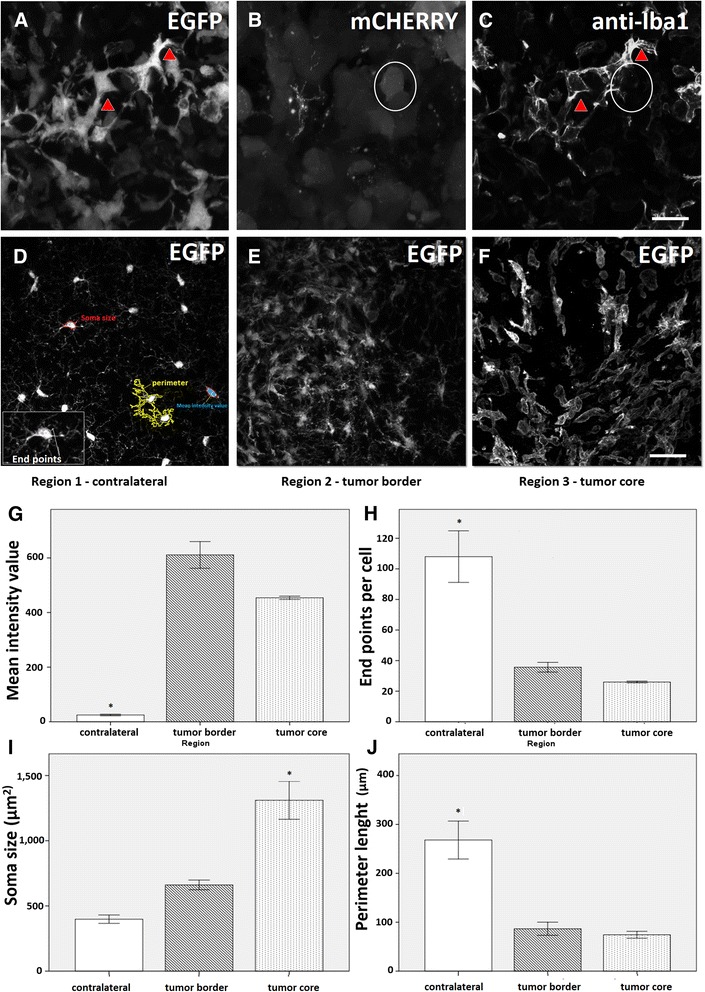
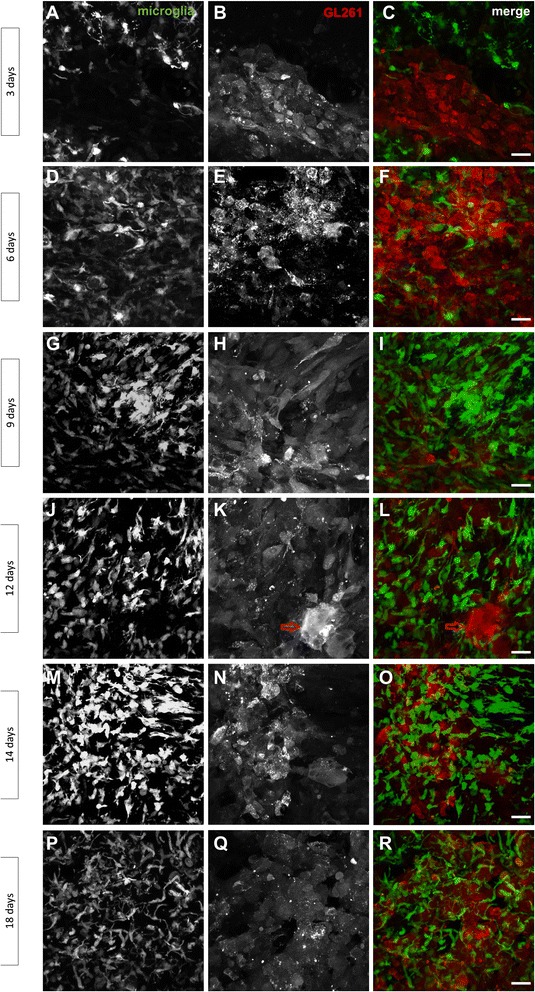
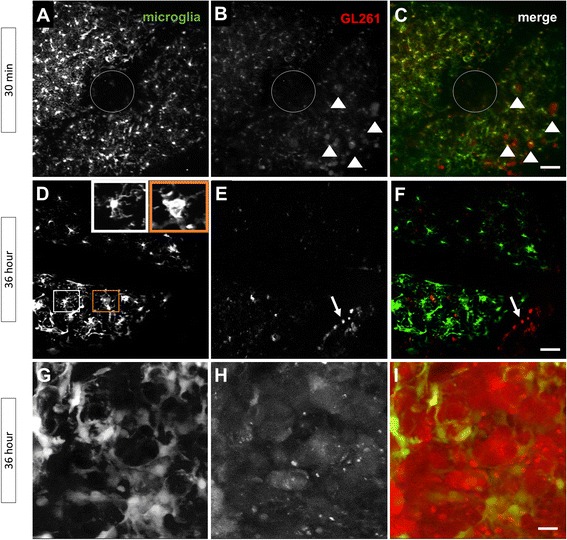
Results: Implanted mCherry-GL261 cells successfully developed brain tumors. They mimic the aggressive behavior found in human disease, with a rapid increase in size and the presence of secondary tumors apart from the injection site. As tumor grows, mCherry-GL261 cells progressively lost their original shape, adopting a heterogeneous and diffuse morphology at 14-18 d. Soma size increased from 10-52 μm. At this point, we focused on the kinetics of microglial access to glioma tissues. 2P-LSM revealed an intense microgliosis in brain areas already shortly after tumor implantation, i.e. at 30 min. By confocal microscopy, we found clusters of microglial cells around the tumor mass in the first 3 days. Then cells infiltrated the tumor area, where they remained during all the time points studied, from 6-18 days. Microglia in contact with glioma cells also present changes in cell morphology, from a ramified to an amoeboid shape. Cell bodies enlarged from 366 ± 0.0 μm(2), in quiescent microglia, to 1310 ± 146.0 μm(2), and the cell processes became shortened.
Conclusions: The GL261/CX3CR1 mouse model reported here is a valuable tool for imaging of microglial cells during glioma growth, either in fixed tissue sections or living animals. Remarkable advantages are the use of immunocompetent animals and the simplified imaging method without the need of immunohistochemical procedures.
Figures
Similar articles
-
GDNF mediates glioblastoma-induced microglia attraction but not astrogliosis.Acta Neuropathol. 2013 Apr;125(4):609-20. doi: 10.1007/s00401-013-1079-8. Epub 2013 Jan 24. Acta Neuropathol. 2013. PMID: 23344256
-
CX3CL1 and CX3CR1 in the GL261 murine model of glioma: CX3CR1 deficiency does not impact tumor growth or infiltration of microglia and lymphocytes.J Neuroimmunol. 2008 Jul 31;198(1-2):98-105. doi: 10.1016/j.jneuroim.2008.04.016. Epub 2008 May 27. J Neuroimmunol. 2008. PMID: 18508133 Free PMC article.
-
Loss of CX3CR1 increases accumulation of inflammatory monocytes and promotes gliomagenesis.Oncotarget. 2015 Jun 20;6(17):15077-94. doi: 10.18632/oncotarget.3730. Oncotarget. 2015. PMID: 25987130 Free PMC article.
-
Microglia in Glioma.Adv Neurobiol. 2024;37:513-527. doi: 10.1007/978-3-031-55529-9_28. Adv Neurobiol. 2024. PMID: 39207710 Review.
-
Investigating microglia-brain tumor cell interactions in vivo in the larval zebrafish brain.Methods Cell Biol. 2017;138:593-626. doi: 10.1016/bs.mcb.2016.10.001. Epub 2016 Oct 31. Methods Cell Biol. 2017. PMID: 28129859 Review.
Cited by
-
Pulsed and oscillating gradient MRI for assessment of cell size and extracellular space (POMACE) in mouse gliomas.NMR Biomed. 2016 Oct;29(10):1350-63. doi: 10.1002/nbm.3577. Epub 2016 Jul 22. NMR Biomed. 2016. PMID: 27448059 Free PMC article.
-
Function of neuronal nitric oxide synthase enzyme in temozolomide-induced damage of astrocytic tumor cells.Oncol Lett. 2018 Apr;15(4):4891-4899. doi: 10.3892/ol.2018.7917. Epub 2018 Feb 1. Oncol Lett. 2018. PMID: 29552127 Free PMC article.
-
A nonmyeloablative chimeric mouse model accurately defines microglia and macrophage contribution in glioma.Neuropathol Appl Neurobiol. 2019 Feb;45(2):119-140. doi: 10.1111/nan.12489. Epub 2018 May 17. Neuropathol Appl Neurobiol. 2019. PMID: 29679380 Free PMC article.
-
Brain intratumoural astatine-211 radiotherapy targeting syndecan-1 leads to durable glioblastoma remission and immune memory in female mice.EBioMedicine. 2024 Jul;105:105202. doi: 10.1016/j.ebiom.2024.105202. Epub 2024 Jun 20. EBioMedicine. 2024. PMID: 38905749 Free PMC article.
-
Wasl is crucial to maintain microglial core activities during glioblastoma initiation stages.Glia. 2022 Jun;70(6):1027-1051. doi: 10.1002/glia.24154. Epub 2022 Feb 22. Glia. 2022. PMID: 35194846 Free PMC article.
References
-
- Markovic DS, Vinnakota K, Chirasani S, Synowitz M, Raguet H, Stock K, Sliwa M, Lehmann S, Kälin R, van Rooijen N, Holmbeck K, Heppner FL, Kiwit J, Matyash V, Lehnardt S, Kaminska B, Glass R, Kettenmann H. Gliomas induce and exploit microglial MT1-MMP expression for tumor expansion. Proc Natl Acad Sci U S A. 2009;106:12530–5. doi: 10.1073/pnas.0804273106. - DOI - PMC - PubMed
-
- Szulzewsky F, Pelz A, Feng X, Synowitz M, Markovic D, Langmann T, Holtman IR, Wang X, Eggen BJL, Boddeke HWGM, Hambardzumyan D, Wolf SA, Kettenmann H. Glioma-Associated Microglia/Macrophages Display an Expression Profile Different from M1 and M2 Polarization and Highly Express Gpnmb and Spp1. PLoS One. 2015;10:e0116644. doi: 10.1371/journal.pone.0116644. - DOI - PMC - PubMed
Publication types
MeSH terms
Substances
LinkOut - more resources
Full Text Sources
Other Literature Sources
Research Materials
