. 2016 Apr 22;60(5):2639-51.
doi: 10.1128/AAC.02070-15. Print 2016 May.

Effects of Low-Dose Amoxicillin on Staphylococcus aureus USA300 Biofilms

Affiliations

Effects of Low-Dose Amoxicillin on Staphylococcus aureus USA300 Biofilms

Kevin D Mlynek et al. Antimicrob Agents Chemother. .

Abstract

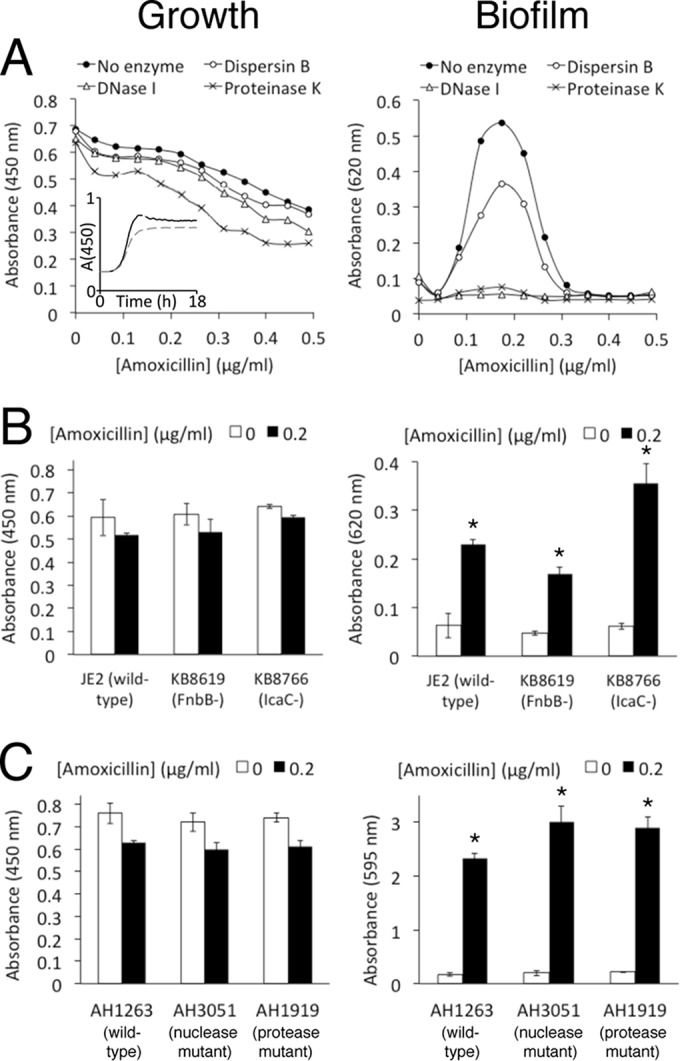
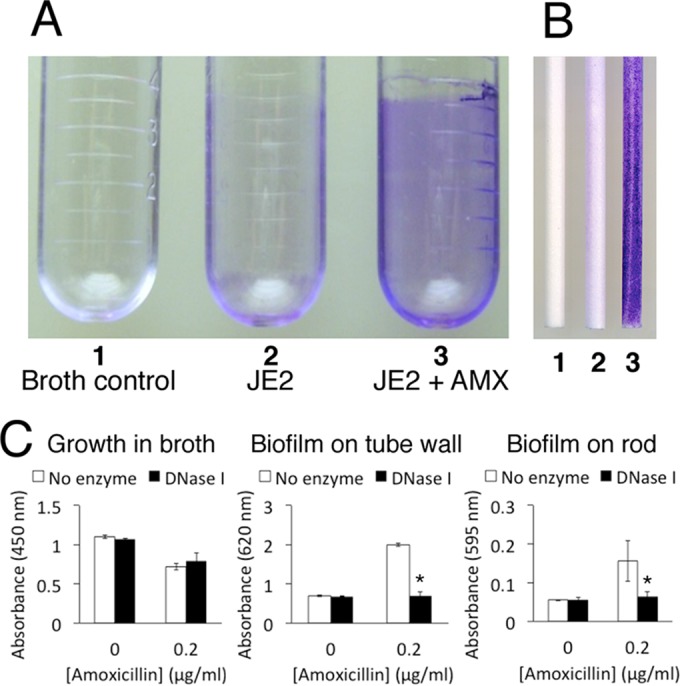
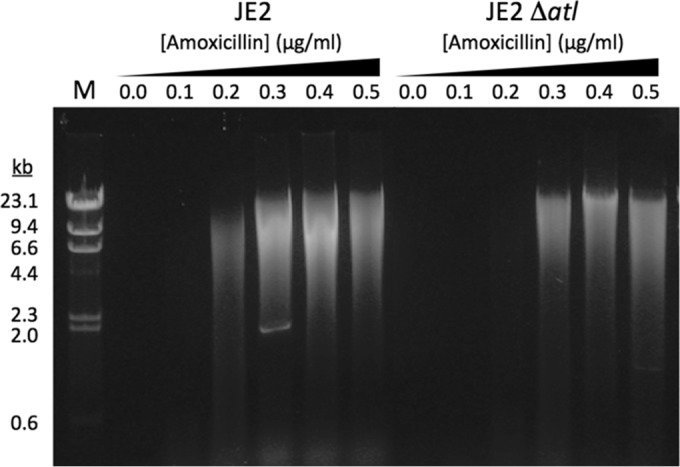
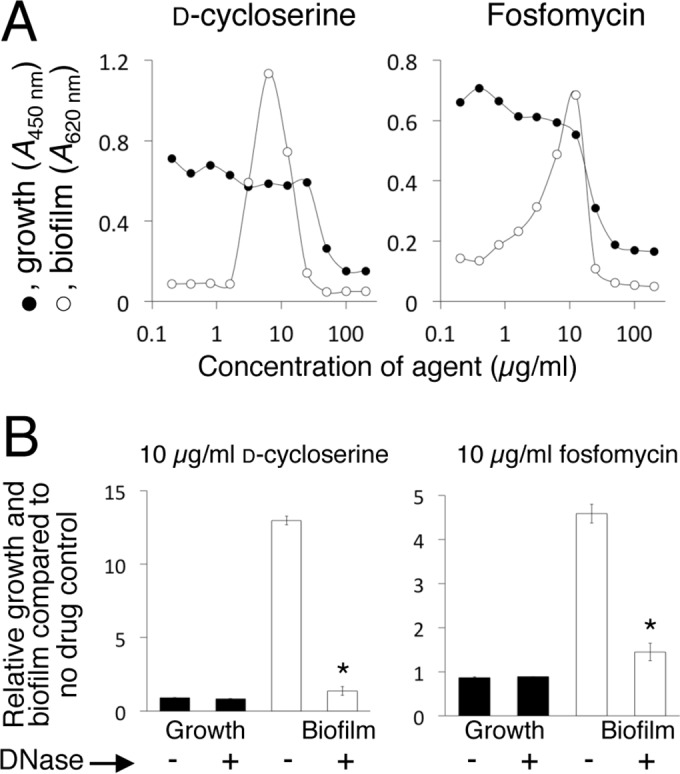
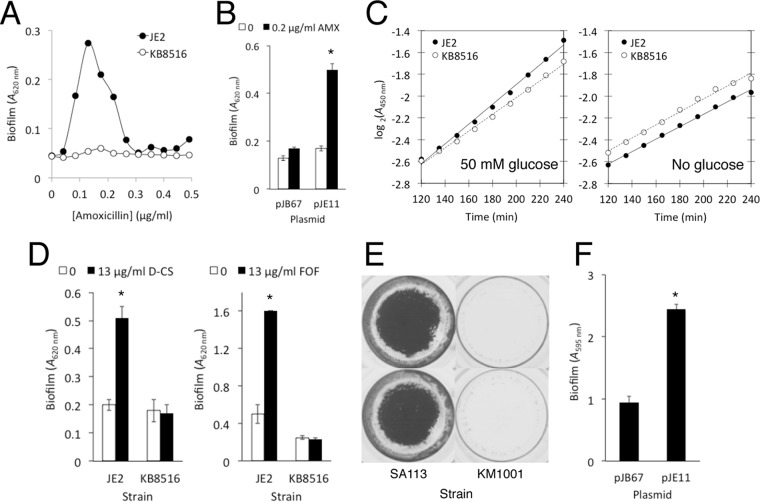
Previous studies showed that sub-MIC levels of β-lactam antibiotics stimulate biofilm formation in most methicillin-resistant Staphylococcus aureus (MRSA) strains. Here, we investigated this process by measuring the effects of sub-MIC amoxicillin on biofilm formation by the epidemic community-associated MRSA strain USA300. We found that sub-MIC amoxicillin increased the ability of USA300 cells to attach to surfaces and form biofilms under both static and flow conditions. We also found that USA300 biofilms cultured in sub-MIC amoxicillin were thicker, contained more pillar and channel structures, and were less porous than biofilms cultured without antibiotic. Biofilm formation in sub-MIC amoxicillin correlated with the production of extracellular DNA (eDNA). However, eDNA released by amoxicillin-induced cell lysis alone was evidently not sufficient to stimulate biofilm. Sub-MIC levels of two other cell wall-active agents with different mechanisms of action-d-cycloserine and fosfomycin-also stimulated eDNA-dependent biofilm, suggesting that biofilm formation may be a mechanistic adaptation to cell wall stress. Screening a USA300 mariner transposon library for mutants deficient in biofilm formation in sub-MIC amoxicillin identified numerous known mediators of S. aureus β-lactam resistance and biofilm formation, as well as novel genes not previously associated with these phenotypes. Our results link cell wall stress and biofilm formation in MRSA and suggest that eDNA-dependent biofilm formation by strain USA300 in low-dose amoxicillin is an inducible phenotype that can be used to identify novel genes impacting MRSA β-lactam resistance and biofilm formation.


Figures

FIG 1
FIG 1
Growth and biofilm formation of wild-type and mutant USA300 strains in static 96-well microtiter plates after 18 h. Broth was supplemented with sub-MIC amoxicillin at the indicated concentrations. (A) Growth and biofilm of strain JE2 in the presence of 10 μg/ml DNase I, dispersin B, or proteinase K. (Inset) Growth of strain JE2 from 0 to 18 h in no antibiotic (solid line) and 0.2 μg/ml amoxicillin (dashed line) in the absence of enzymes. A(450), absorbance at 450 nm. (B) Growth and biofilm of JE2, isogenic fnbB (fibronectin binding protein B) mutant strain KB8619, and isogenic icaC (poly-N-acetyl-d-glucosamine) mutant strain KB8766. (C) Growth and biofilm of wild-type strain AH1263 and isogenic nuclease- and protease-deficient mutant strains AH3051 and AH1919. All the values show means for duplicate wells, and the error bars indicate ranges. Error bars were omitted from panel A for clarity. *, significantly different from no-antibiotic control (P < 0.05).
FIG 2
FIG 2
Growth and biofilm formation of MRSA strain JE2 in polystyrene culture tubes incubated in a gyratory shaker. (A) Biofilm formation on the walls of tubes visualized by staining with crystal violet. Tube 1, sterile broth control; tube 2, strain JE2; tube 3, strain JE2 supplemented with 0.2 μg/ml amoxicillin (AMX). (B) Biofilm formation on polystyrene rods suspended in the centers of the tubes in panel A during incubation. Rods 1, 2, and 3 were suspended in tubes 1, 2, and 3, respectively. (C) Quantitation of growth in tubes (in broth), biofilm on the sides of the tubes, and biofilm on the rod in the presence or absence of 10 μg/ml DNase I. The graphs show mean absorbance values from duplicate tubes or rods, and the error bars indicate ranges. *, significantly different from no-enzyme control (P < 0.05).
FIG 3
FIG 3
Physical characteristics of JE2 biofilms cultured in low-dose amoxicillin. (A and B) Surface attachment assay. (A) Microtiter plate wells were inoculated with sterile broth (Broth control), JE2 inoculum (JE2), or JE2 inoculum supplemented with 0.2 μg/ml amoxicillin (JE2 + AMX). All the wells also contained 1-μm-diameter magnetic microbeads. The microtiter plate was incubated for 3 h, placed on a block of 96 magnets for 1 min, and then imaged using a microplate scanner. Duplicate wells for each condition are shown. (B) Quantitation of the spot intensity in panel A using BioFilm Control software. The spot intensity is expressed in BFI units, which are inversely proportional to the amount of biofilm in the well. *, significantly different (P < 0.05). (C and D) Biofilm porosity assay. (C) Rate of fluid flow through JE2 biofilms (squares), JE2 biofilms cultured in 0.2 μg/ml amoxicillin (triangles), and JE2 biofilms cultured in 0.2 μg/ml amoxicillin plus 10 μg/ml DNase I (diamonds). Fluid flow was measured using centrifugal filter devices. The solid circles show the rate of fluid flow through a control device inoculated with sterile broth. The values show means for duplicate devices. Error bars were omitted for clarity. *, significantly different from strain JE2 (P < 0.05); **, significantly different from strain JE2 plus AMX (P < 0.05). (D) Rate of fluid flow through JE2 biofilms cultured in increasing concentrations of amoxicillin. The values show mean flowthrough volumes and ranges for duplicate centrifugal filter devices after 90 s of centrifugation. *, significantly different from no-antibiotic control (P < 0.05). (E) Confocal scanning laser micrograph of 200-μm2 areas of JE2 biofilms cultured in glass-bottom dishes in the absence or presence of 0.2 μg/ml amoxicillin. The biofilms were stained with LIVE/DEAD stain. Green, live cells; red, dead cells and eDNA; yellow, mixture.
FIG 4
FIG 4
Low-dose amoxicillin induces eDNA release in JE2 and in a JE2 autolysin mutant (strain NE460; JE2 Δatl). Extracellular DNA was isolated from colony biofilms cultured on increasing concentrations of amoxicillin and analyzed by agarose gel electrophoresis. The sizes of molecular size markers (lane M) are indicated on the left.
FIG 5
FIG 5
d-Cycloserine and fosfomycin induce eDNA-dependent biofilm in MRSA strain JE2. (A) Growth and biofilm of MRSA strain JE2 in 96-well microtiter plates in the presence of increasing concentrations of d-cycloserine or fosfomycin. The graphs show mean absorbance values from duplicate wells. Error bars were omitted for clarity. (B) Effect of 10 μg/ml DNase I on growth and biofilm of JE2 in the presence of 10 μg/ml d-cycloserine or fosfomycin. The presence (+) or absence (−) of DNase I in the culture is indicated along the bottom. The values show relative growth and biofilm in the presence of the agent compared to growth and biofilm in the no-drug control (absorbance with drug/absorbance without drug × 100). The error bars show the ranges of values from duplicate wells. *, significantly different from no-DNase I control (P < 0.05).
FIG 6
FIG 6
Growth and biofilm of 16 defined NTML mutant strains in the presence of increasing concentrations of sub-MIC amoxicillin. The mutant strains correspond to those listed in Table 2. The name of the inactivated gene in each mutant strain is shown above each set of graphs. The x axes indicate amoxicillin concentrations (in micrograms per milliliter), and the y axes indicate absorbance (450 nm for growth and 620 nm for biofilm). The values show mean absorbance values from 2 to 5 assays. Error bars were omitted for clarity. (A) Biofilm-deficient mutants. (B) Amoxicillin-hypersensitive mutants. (C) Amoxicillin-hyperresistant mutants.
FIG 7
FIG 7
Genetic map and translated amino acid sequence of S. aureus glcJ. (A) Genetic maps of S. aureus glcJ and flanking regions and the homologous B. subtilis glucokinase operon and flanking regions. The arrows indicate ORFs and the direction of transcription. Solid arrows, glcJ; shaded arrows, genes with homologues in both species; open arrows, genes unique to S. aureus or B. subtilis. The numbers below the arrows are gene numbers based on the USA300 numbering system for S. aureus (GenBank accession number NC_007793) and the strain 168 numbering system for B. subtilis (GenBank accession number AL009126). Gene names and putative functions are shown above the S. aureus map. Putative functions of genes unique to B. subtilis are shown below the B. subtilis map. The dashed lines demarcate homologous regions. (B) Amino acid alignment of S. aureus GlcJ (Sau) with homologues from B. subtilis (Bsu), Streptococcus suis (Ssu), Gracilibacillus lacisalsi (Gla), and Salinicoccus carnicancri (Sca). Amino acids present in more than one sequence are shaded. The asterisks indicate amino acids conserved in all five sequences. Protein lengths are in parentheses. The arrow above the S. aureus sequence indicates the location and direction of the transposon insertion in mutant strains NE516, KB8516, and KM1001.
FIG 8
FIG 8
Biofilm formation by S. aureus strains JE2 and SA113 and their isogenic glcJ mutants, KB8516 and KM1001, respectively, in 96-well microtiter plates. (A) Biofilm formation by strains JE2 and KB8516 in increasing concentrations of amoxicillin. (B) Biofilm formation by KB8516 harboring plasmid pJB67 (vector control) or pJE11 (glcJ) in no antibiotic (0) or 0.2 μg/ml amoxicillin. The values show means and ranges for duplicate wells. *, significantly different from the pJB67 control (P < 0.05). (C) Growth curves for strains JE2 and KB8516 in static microtiter plates. Bacteria were cultured in 17 g/liter tryptone, 3 g/liter Soytone (BD Biosciences), 5 g/liter NaCl, 2.5 g/liter K2HPO4 supplemented with 9 g/liter (50 mM) glucose or no glucose. The graphs show mean absorbance values from 3 or 4 wells. (D) Biofilm formation by JE2 and KB8515 in 0 μg/ml or 13 μg/ml d-cycloserine (D-CS) or fosfomycin (FOF). The values show means and ranges from duplicate wells. *, significantly different from the no-drug control (P < 0.05). (E) Biofilm formation by S. aureus strains SA113 (wild type) and KM1001 (SA113 ΔglcJ) in antibiotic-free medium. The biofilm was visualized by staining with crystal violet. Duplicate wells of each strain are shown. (F) Biofilm formation by strain KM1001 harboring plasmid pJB67 (vector control) or pJE11 (glcJ) in antibiotic-free medium. The values show means and ranges for duplicate wells. *, significantly different from the pJB67 control (P < 0.05).

Similar articles

Cited by

References

    1. Stryjewski ME, Corey GR. 2014. Methicillin-resistant Staphylococcus aureus: an evolving pathogen. Clin Infect Dis 58:S10–S19. doi: 10.1093/cid/cit613. - DOI - PubMed
    1. Otto M. 2013. Community-associated MRSA: what makes them special? Int J Med Microbiol 303:324–330. doi: 10.1016/j.ijmm.2013.02.007. - DOI - PMC - PubMed
    1. Otto M. 2008. Staphylococcal biofilms. Curr Top Microbiol Immunol 322:207–228. - PMC - PubMed
    1. de Lencastre H, Oliveira D, Tomasz A. 2007. Antibiotic resistant Staphylococcus aureus: a paradigm of adaptive power. Curr Opin Microbiol 10:428–435. doi: 10.1016/j.mib.2007.08.003. - DOI - PMC - PubMed
    1. O'Neill E, Pozzi C, Houston P, Humphreys H, Robinson DA, Loughman A, Foster TJ, O'Gara JP. 2008. A novel Staphylococcus aureus biofilm phenotype mediated by the fibronectin-binding proteins, FnBPA and FnBPB. J Bacteriol 190:3835–3850. doi: 10.1128/JB.00167-08. - DOI - PMC - PubMed

Publication types

MeSH terms