. 2016 May 1;39(5):1069-82.
doi: 10.5665/sleep.5758.

Responses in Rat Core Auditory Cortex are Preserved during Sleep Spindle Oscillations

Affiliations

Responses in Rat Core Auditory Cortex are Preserved during Sleep Spindle Oscillations

Yaniv Sela et al. Sleep. .

Abstract

Study objectives: Sleep is defined as a reversible state of reduction in sensory responsiveness and immobility. A long-standing hypothesis suggests that a high arousal threshold during non-rapid eye movement (NREM) sleep is mediated by sleep spindle oscillations, impairing thalamocortical transmission of incoming sensory stimuli. Here we set out to test this idea directly by examining sensory-evoked neuronal spiking activity during natural sleep.

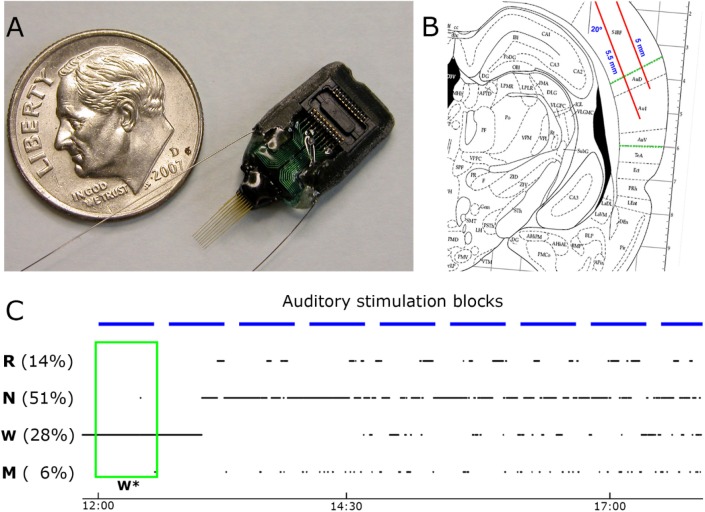
Methods: We compared neuronal (n = 269) and multiunit activity (MUA), as well as local field potentials (LFP) in rat core auditory cortex (A1) during NREM sleep, comparing responses to sounds depending on the presence or absence of sleep spindles.

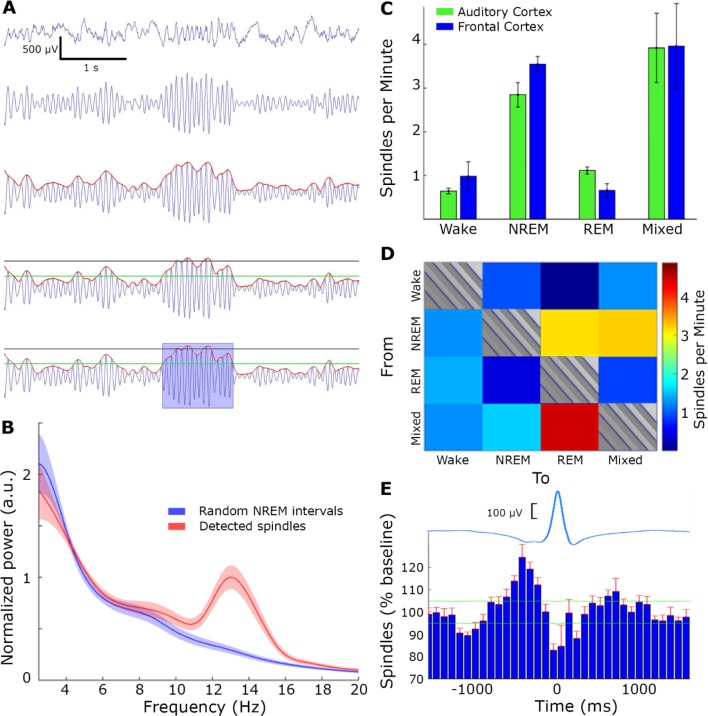
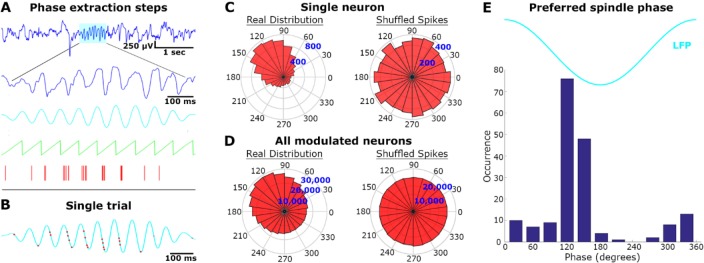
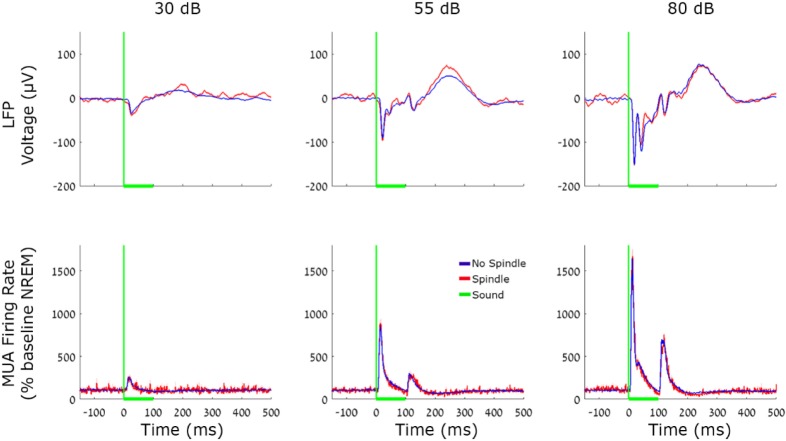
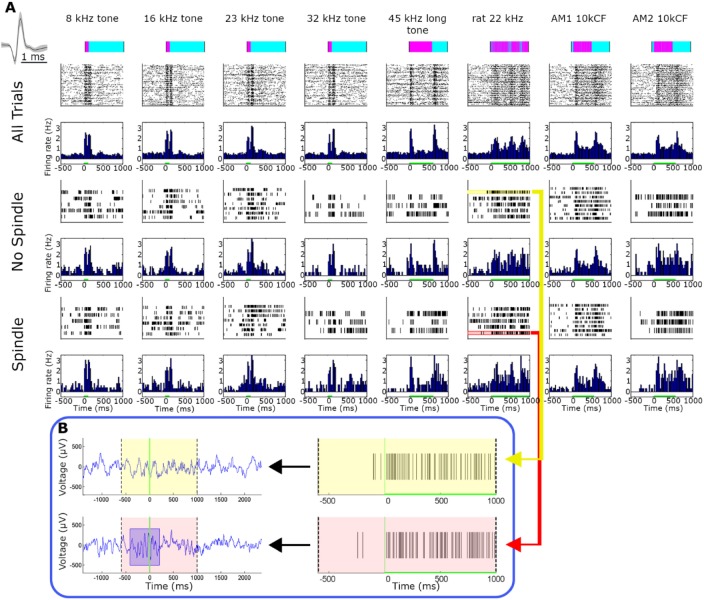
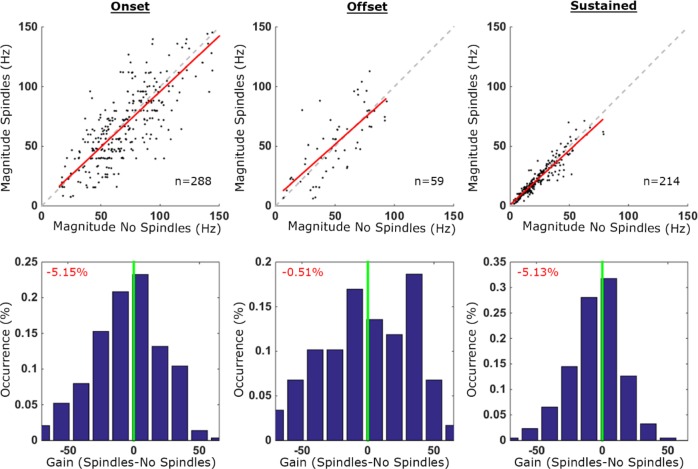
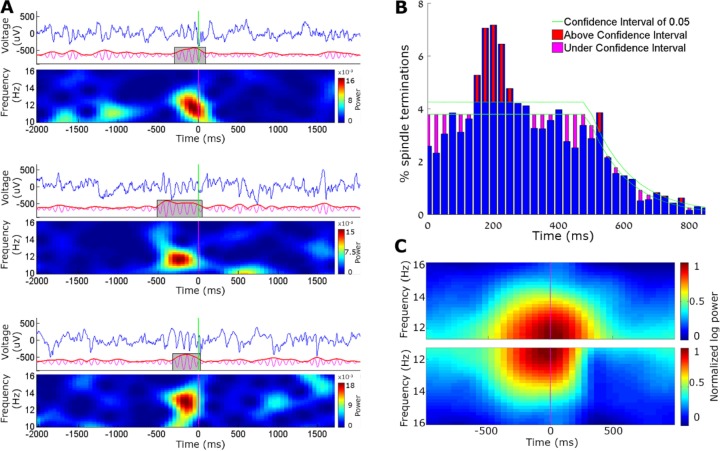
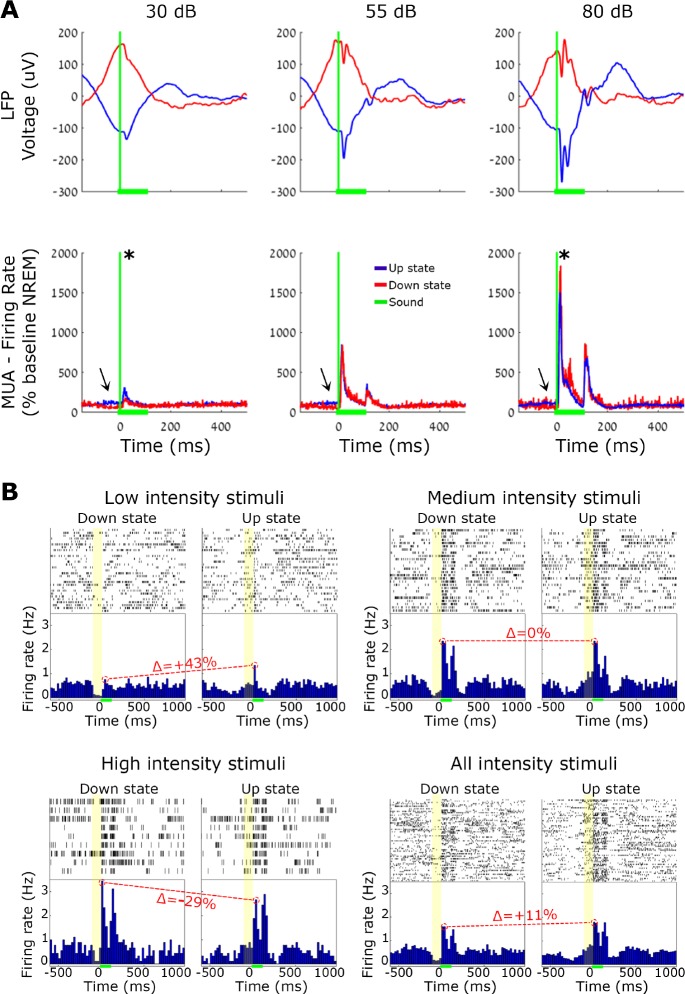
Results: We found that sleep spindles robustly modulated the timing of neuronal discharges in A1. However, responses to sounds were nearly identical for all measured signals including isolated neurons, MUA, and LFPs (all differences < 10%). Furthermore, in 10% of trials, auditory stimulation led to an early termination of the sleep spindle oscillation around 150-250 msec following stimulus onset. Finally, active ON states and inactive OFF periods during slow waves in NREM sleep affected the auditory response in opposite ways, depending on stimulus intensity.

Conclusions: Responses in core auditory cortex are well preserved regardless of sleep spindles recorded in that area, suggesting that thalamocortical sensory relay remains functional during sleep spindles, and that sensory disconnection in sleep is mediated by other mechanisms.

Keywords: LFP; NREM sleep; auditory cortex; rat; single-unit; sleep spindles.


Figures

Figure 1
Figure 1
Experimental setup. (A) The main implanted recording device was a microwire array consisting of 16-channel (two rows of eight each) tungsten wires of 33 μm and 20–70 kOhm (Tucker-Davis Technologies, Inc. (TDT), Alachua, FL, USA; spacing between microwires: 175–250 μm; separation between rows: L–R: 375–500 μm, D–V: 0.5 mm). (B) Sketch of surgical plan with oblique implantation of auditory microwires (red lines) superimposed with a coronal diagram of the rat brain 4.5 mm posterior to bregma; dotted green lines denote borders of auditory cortex. (C) Example of the auditory stimulation protocol superimposed with changes in vigilance states. Sessions started around 12:00 (time on bottom) and lasted 4–6 h. Experiments included repeated identical blocks of sound stimulation (horizontal blue bars, top), interleaved with 10-min silent intervals. Rats were kept continuously awake during the first block of stimulation (green box, W*) and were left undisturbed during all other blocks. W, N, R, and M correspond to wakefulness, non-rapid eye movement (NREM) sleep, rapid eye movement (REM) sleep, and mixed sleep, respectively. Note that percent time spent in each vigilance state does not add to 100% since epochs containing artifacts were excluded.
Figure 2
Figure 2
Spindle detection. (A) Spindle detection algorithm, from top to bottom: local field potential (LFP) raw data (first row) was band-passed to the sigma band (10–16 Hz, second row) and instantaneous amplitude (red line, third row) was extracted. Detection (black) and noise (green) thresholds were set (fourth row), and duration limits determined the detection of a spindle (blue rectangle, bottom row). (B) LFP power spectral density of detected spindle events (red) and random time intervals in non-rapid eye movement (NREM) sleep (blue). (C) Number of detected spindles per minute in each state, separately for A1 (green) and motor cortex (blue). Note the higher occurrence during NREM sleep and mixed states. (D) Number of detected spindles before state transitions (16 sec) reveal maximal occurrence around transitions between NREM to rapid eye movement (REM) sleep as well as transitions between NREM- > Mixed State- > REM. (E) Number of detected spindles around slow waves (time zero corresponds to OFF periods occurring along with LFP positive peak). Top, average LFP slow wave (blue); Bottom, histogram of spindle occurrence (percentage deviation from baseline; mean + standard error of the mean (SEM) across experiments in red). Horizontal green lines, confidence intervals (α = 0.001). Note higher spindle occurrence around up states.
Figure 3
Figure 3
Locking of unit discharges to sleep spindle phase. (A) Phase extraction steps: for each detected spindle (first row, cyan), the raw local field potential (LFP, second row) was band-pass filtered (third row, cyan) and the instantaneous phase (green) was compared to precise timing of neuronal action potentials (red bars). (B) Single trial example. The band-passed spindle from panel A is shown superimposed with its corresponding neuronal spikes (red dots). (C) Single neuron analysis across all spindles: spindle phase angular distribution of spikes from the same unit displayed in A (“real distribution”, left), and distribution of randomly shuffled spikes within each spindle (“shuffled spikes”, right). (D) Same as in C for all modulated neurons (n = 178/269, 66%). (E) Cumulative histogram of preferred spindle phase for all modulated neurons.
Figure 4
Figure 4
Local field potentials (LFP) and multiunit activity (MUA) auditory responses during spindle and nonspindle trials. Responses of A1 neuronal populations evoked by 100 msec tone pips. Red, spindle trials; Blue, no spindles. Top row, average A1 LFP; Bottom row, average MUA. Columns (left to right) mark sound intensities of 30, 55, and 80 dB SPL. Vertical green lines, sound onset; Horizontal green line, sound duration. Note that both LFP and MUA responses are virtually indistinguishable during spindle and nonspindle trials.
Figure 5
Figure 5
Representative single-unit auditory responses during spindle and nonspindle trials. (A) Representative auditory responses of a putative single unit during spindle and nonspindle trials (rows) for eight different stimuli (columns). Rows (top to bottom) correspond to stimuli names and intensities, timing and structure of acoustic stimulus (pink over cyan), followed by raster plots and peristimulus time histograms (PSTHs) for all trials, spindle trials, and non-spindle trials. Inset on upper left shows mean ± standard error of the mean (SEM) of action potential waveform. Firing rate in all bar graphs is expressed in terms of percent of baseline and is shown with the same scale across all states and stimuli. Note that neuronal responses are nearly indistinguishable visually between spindle and non-spindle trials. (B) Two representative trials denoting spike responses during spindle (pink, bottom) and nonspindle (yellow, top) trials. Left panels show A1 local field potential (LFP) whereas right panels show single-unit spiking activity. Note robust response that persists during spindle occurrence.
Figure 6
Figure 6
Quantitative comparison of auditory responses in isolated neurons during spindle and nonspindle trials. Quantitative comparison of auditory responses in isolated neurons (n = 269) in spindle and nonspindle trials. Columns (left to right) depict results separately for onset, offset, and sustained responses. Top row: scatter plot of response magnitudes (spikes per second, Hz) in spindle trials (y-axis) versus no-spindle trials (x-axis). Each dot denotes the response of one neuronal unit to a specific stimulus (n = 288, 59 and 214 conditions for onset, offset, and sustained responses, respectively). Dashed gray line is the identity (45°) line and in red the regression line. Bottom row: distribution of gain factors computed for each stimulus separately. Vertical green line marks zero gain while percentage (red font, top left corners) shows the mean gain factor (none of these mean gain factors were significantly different than zero when evaluated via bootstrapping, see Methods). Positive (versus negative) gain values denote increased response magnitude in spindle trials (versus no-spindle trials). Note that by and large neuronal responses during spindle trials retain response magnitudes.
Figure 7
Figure 7
Auditory stimulation leads to early termination of sleep spindles in some trials. (A) Three representative example trials for the early termination of spindles upon auditory stimulation. In each example, top row shows the A1 local field potential (LFP, blue), middle row shows the detection procedure (10–16 Hz band-pass filtered signal in magenta, its envelope in red, and detected spindle in gray box), and the bottom depicting time-frequency dynamics (spectrogram). Vertical green line, sound onset. Note the abrupt termination of spindles upon auditory stimulation in all three instances. (B) Percentage of spindle terminations after loud tone stimuli. Blue bars show average number of spindle terminations in each time bin, and green lines depict the confidence interval (α = 0.05). Red and magenta bars show moments of statistically significant increases and decreases in spindle termination. (C) Mean time-frequency (spectrogram) representation of spindle events occurring along with loud tones, separately for (i) all trials (top, symmetric shape), and (ii) for “interrupted spindles” terminating between 150–250 ms after the sound (bottom, asymmetric shape, 30% of trials).
Figure 8
Figure 8
Auditory responses during slow wave ON (active) and OFF (silent) periods. Comparison between responses to 100 msec tone pips during slow waves. (A) Mean A1 local field potential (LFP, top) and A1 multiunit activity (MUA, bottom) responses evoked by low- (30 dB), medium- (55 dB), and high-intensity (80 dB) tone pips. Red/blue traces correspond to OFF/ON periods. Green lines indicate sound onset (vertical) and duration (horizontal), and arrows point to differences in baseline firing between the two conditions. (B) Representative single-unit auditory responses to each volume intensity. In each quarter: spike raster plots and peristimulus time histogram (PSTH) show single-unit responses separately for different volume conditions. Green horizontal bars denote sound stimulation. Yellow boxes mark neuronal OFF period (left) versus neuronal ON period (right), and Δ (in red) specify the change in peak response (OFF divided by ON period). Note that the prestimulus baseline shows clear differences between ON and OFF periods (as expected), and a negative interaction exists between slow wave phase and sound intensity.

Similar articles

Cited by

References

    1. Carskadon MA, Dement WC. Normal human sleep: an overview. In: Kryger MH, Roth T, Dement WC, editors. Principles and practice of sleep medicine. 5th ed. St. Louis, MO: Saunders/Elsevier; 2011. pp. 16–26.
    1. Rechtschaffen A, Hauri P, Zeitlin M. Auditory awakening thresholds in REM and NREM sleep stages. Percept Mot Skills. 1966;22:927–42. - PubMed
    1. Neckelmann D, Ursin R. Sleep stages and EEG power spectrum in relation to acoustical stimulus arousal threshold in the rat. Sleep. 1993;16:467–77. - PubMed
    1. Rechtschaffen A. The single-mindedness and isolation of dreams. Sleep. 1978;1:97–109. - PubMed
    1. Nir Y, Tononi G. Dreaming and the brain: from phenomenology to neurophysiology. Trends Cogn Sci. 2010;14:88–100. - PMC - PubMed

Publication types