

The importance of age, sex and place in understanding socioeconomic inequalities in allostatic load: Evidence from the Scottish Health Survey (2008-2011)
- PMID: 26856976
- PMCID: PMC4746832
- DOI: 10.1186/s12889-016-2796-4
The importance of age, sex and place in understanding socioeconomic inequalities in allostatic load: Evidence from the Scottish Health Survey (2008-2011)
Abstract
Background: Given the broad spectrum of health and wellbeing outcomes that are patterned by socioeconomic position (SEP), it has been suggested that there may be common biological pathways linking SEP and health. Allostatic load is one such pathway, which aims to measure cumulative burden/dysregulation across multiple physiological systems. This study aimed to determine the contextual and demographic factors (age, sex and place) that may be important in better understanding the links between lower SEP and higher allostatic load.
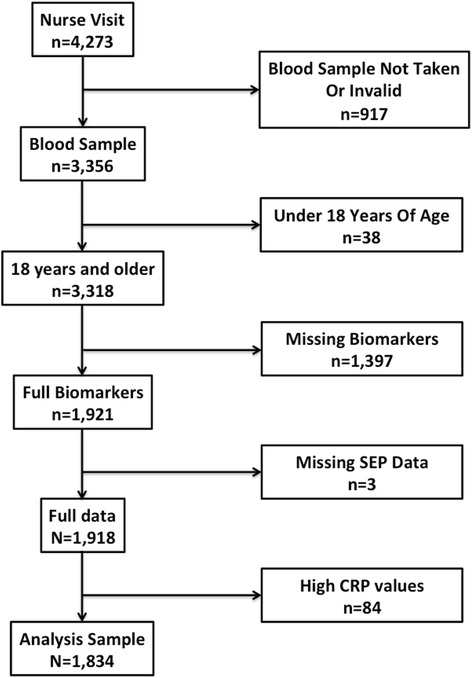
Methods: Data were from a nationally representative sample of adults (18+): the Scottish Health Survey (2008-2011). Higher SEP ('1') was defined as having 'Higher'-level, secondary school qualifications versus having lower level or no qualifications ('0'). For allostatic load, a range of 10 biomarkers across the cardiovascular, metabolic and immune systems were used. Respondents were scored "1" for each biomarker that fell into the highest quartile of risk. Linear regressions were run in STATA, including SEP, age (continuous and as a 7-category variable), sex (male/female), urbanity (a 5-category variable ranging from primary cities to remote rural areas) and geographical location (based on 10 area-level healthboards). Interactions between SEP and each predictor, as well as stratified analyses, were tested.
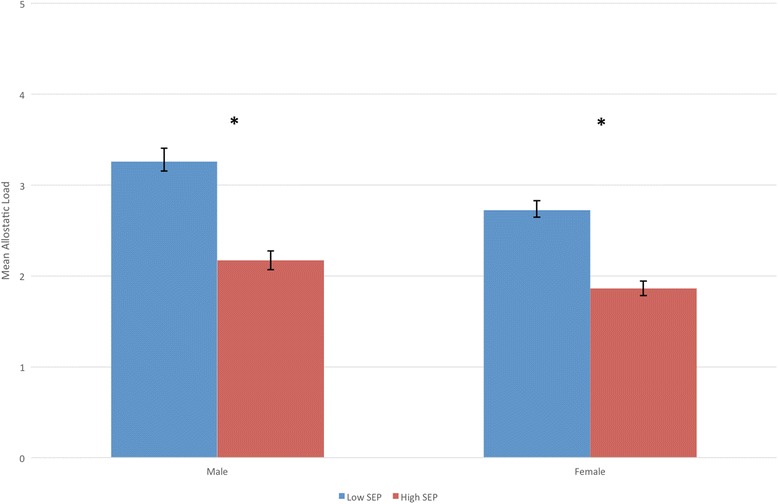
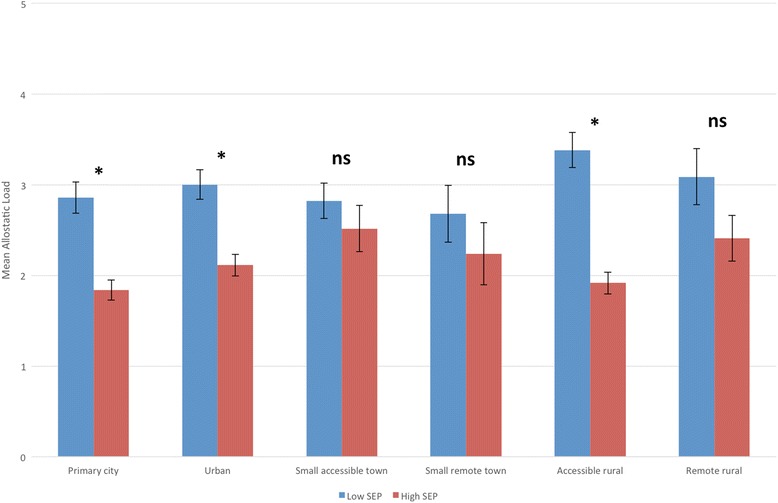
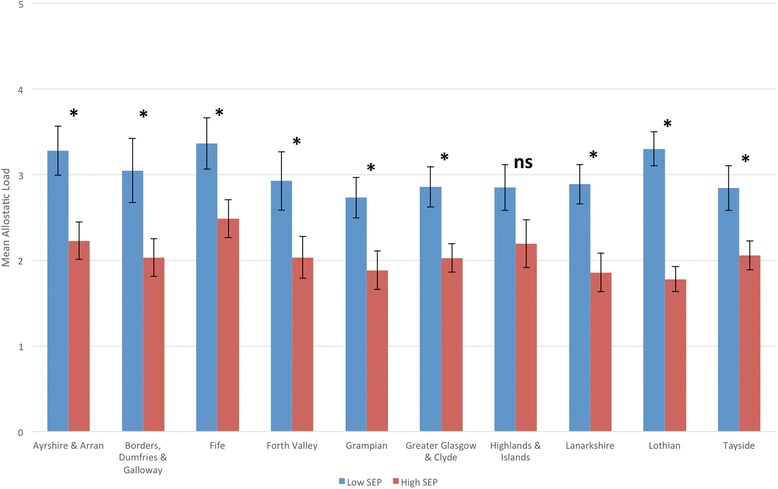
Results: Lower SEP was associated with higher allostatic load even after adjusting for age, sex and place (b = -0.631, 95 % CI -0.795, -0.389, p < 0.001). There was no significant effect moderation between SEP and age, sex or place. Stratified analysis did show that the inequality identified in the baseline models widened with age, becoming significant at ages 35-44, before narrowing at older ages (75+). There was no difference by sex, but more mixed findings with regards place (urbanity or geographical location), with a mix of significant and non-significant results by SEP that did not appear to follow any pattern.
Conclusions: Inequalities in allostatic load by educational attainment, as a measure of SEP, are consistent with age, sex and place. However, these stratified analyses showed that these inequalities did widen with age, before narrowing in later life, matching the patterns seen with other objective and subjective health measures. However, effect moderation analysis did not support evidence of a statistically significant interaction between age and SEP. Context remains an important feature in understanding and potentially addressing inequalities, although may be less of an issue in terms of physiological burden.
Figures

Similar articles
-
The role of material, psychosocial and behavioral factors in mediating the association between socioeconomic position and allostatic load (measured by cardiovascular, metabolic and inflammatory markers).Brain Behav Immun. 2015 Mar;45:41-9. doi: 10.1016/j.bbi.2014.10.005. Epub 2014 Oct 22. Brain Behav Immun. 2015. PMID: 25459100 Free PMC article.
-
Socioeconomic position across the lifecourse & allostatic load: data from the West of Scotland Twenty-07 cohort study.BMC Public Health. 2014 Feb 20;14:184. doi: 10.1186/1471-2458-14-184. BMC Public Health. 2014. PMID: 24555560 Free PMC article.
-
Role of allostatic load and health behaviours in explaining socioeconomic disparities in mortality: a structural equation modelling approach.J Epidemiol Community Health. 2018 Jun;72(6):545-551. doi: 10.1136/jech-2017-209131. Epub 2018 Feb 19. J Epidemiol Community Health. 2018. PMID: 29459378
-
Disparities in allostatic load, telomere length and chronic stress burden among African American adults: A systematic review.Psychoneuroendocrinology. 2022 Jun;140:105730. doi: 10.1016/j.psyneuen.2022.105730. Epub 2022 Mar 21. Psychoneuroendocrinology. 2022. PMID: 35338946
-
Allostasis and allostatic load: expanding the discourse on stress and cardiovascular disease.J Clin Nurs. 2008 Apr;17(7B):201-8. doi: 10.1111/j.1365-2702.2008.02347.x. J Clin Nurs. 2008. PMID: 18578796 Review.
Cited by
-
Association of Unhealthy Lifestyle and Childhood Adversity With Acceleration of Aging Among UK Biobank Participants.JAMA Netw Open. 2022 Sep 1;5(9):e2230690. doi: 10.1001/jamanetworkopen.2022.30690. JAMA Netw Open. 2022. PMID: 36066889 Free PMC article.
-
Recasting the Immigrant Health Paradox Through Intersections of Legal Status and Race.J Immigr Minor Health. 2021 Oct;23(5):1092-1104. doi: 10.1007/s10903-021-01162-2. Epub 2021 Mar 3. J Immigr Minor Health. 2021. PMID: 33656653 Free PMC article. Review.
-
Allostatic load and its determinants in a German sample-Results from the Carla cohort.PLoS One. 2025 Apr 24;20(4):e0321178. doi: 10.1371/journal.pone.0321178. eCollection 2025. PLoS One. 2025. PMID: 40273157 Free PMC article.
-
Allostatic Load Measurement: A Systematic Review of Reviews, Database Inventory, and Considerations for Neighborhood Research.Int J Environ Res Public Health. 2022 Dec 18;19(24):17006. doi: 10.3390/ijerph192417006. Int J Environ Res Public Health. 2022. PMID: 36554888 Free PMC article.
-
Neighbourhood socioeconomic deprivation and allostatic load: a multi-cohort study.Sci Rep. 2019 Jun 19;9(1):8790. doi: 10.1038/s41598-019-45432-4. Sci Rep. 2019. PMID: 31217447 Free PMC article.
References
-
- Graham H. Unequal lives: health and socioeconomic inequalities. Maidenhead, UK: Open University Press; 2007.
-
- Graham H, Kelly MP. Health Inequalities: Concepts, Framework and Policy. HDA Briefing paper. London, UK: HDA; 2004.
-
- Schulkin J. Allostasis, Homeostasis and the costs of Physiological Adaptation. New York, USA: Cambridge University Press; 2004.
MeSH terms
Substances
LinkOut - more resources
Full Text Sources
Other Literature Sources
Medical
