. 2016 Feb 8;5(2):e002796.
doi: 10.1161/JAHA.115.002796.

Durable Benefits of Cellular Postconditioning: Long-Term Effects of Allogeneic Cardiosphere-Derived Cells Infused After Reperfusion in Pigs with Acute Myocardial Infarction

Affiliations

Durable Benefits of Cellular Postconditioning: Long-Term Effects of Allogeneic Cardiosphere-Derived Cells Infused After Reperfusion in Pigs with Acute Myocardial Infarction

Hideaki Kanazawa et al. J Am Heart Assoc. .

Abstract

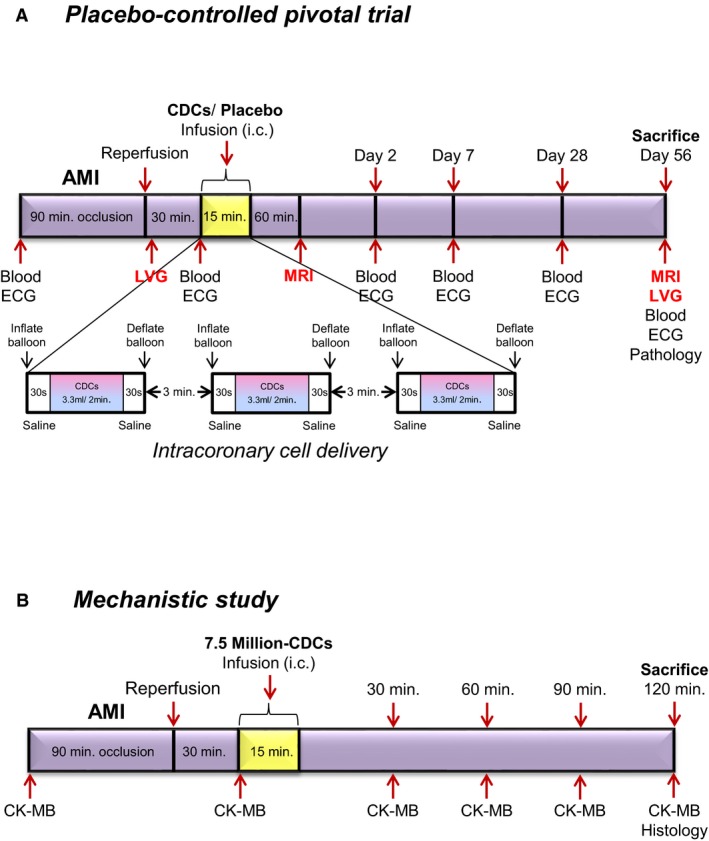
Background: Infusion of allogeneic cardiosphere-derived cells (allo-CDCs) postreperfusion elicits cardioprotective cellular postconditioning in pigs with acute myocardial infarction. However, the long-term effects of allo-CDCs have not been assessed. We performed a placebo-controlled pivotal study for long-term evaluation, as well as shorter-term mechanistic studies.

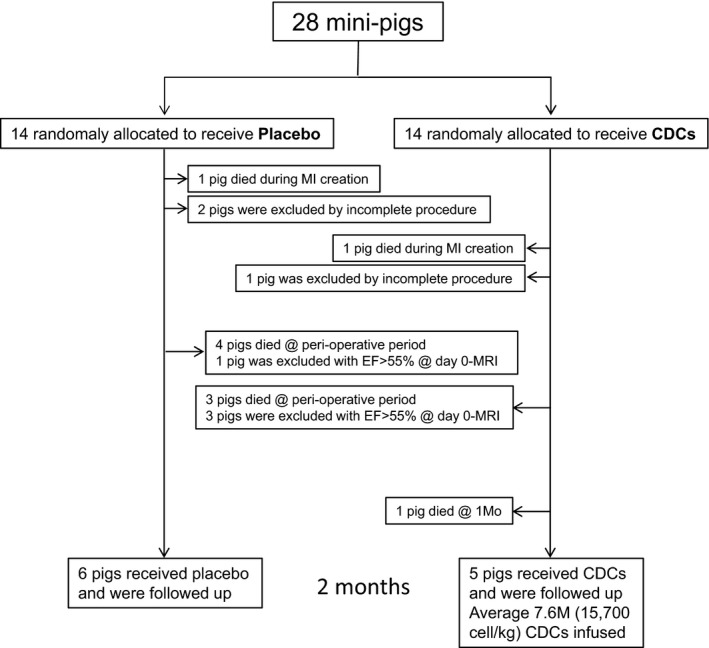
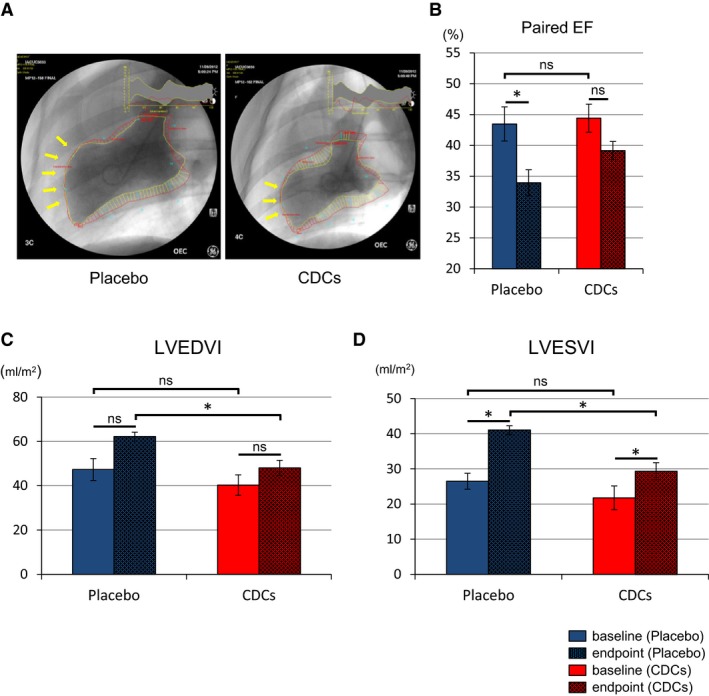
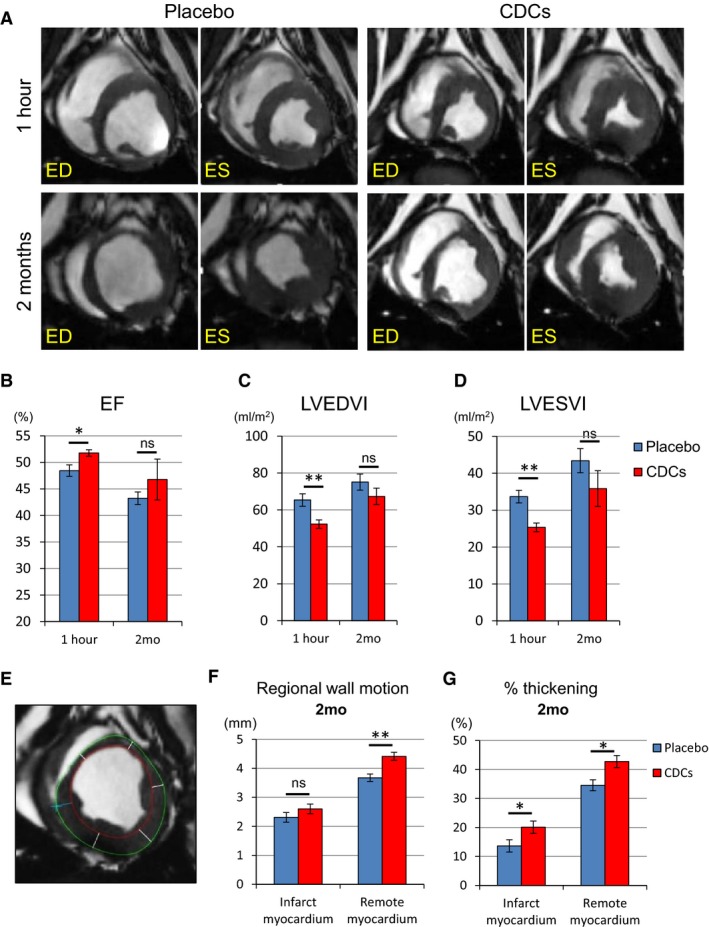
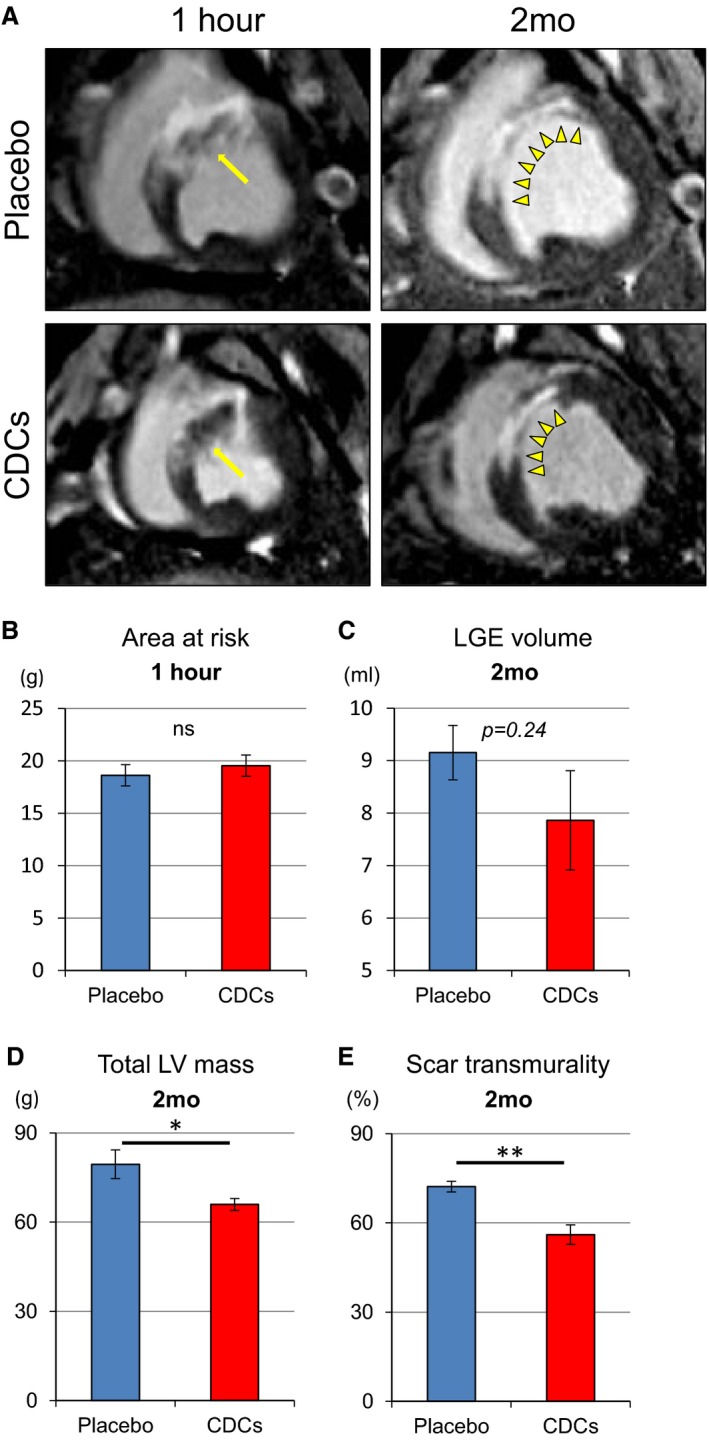
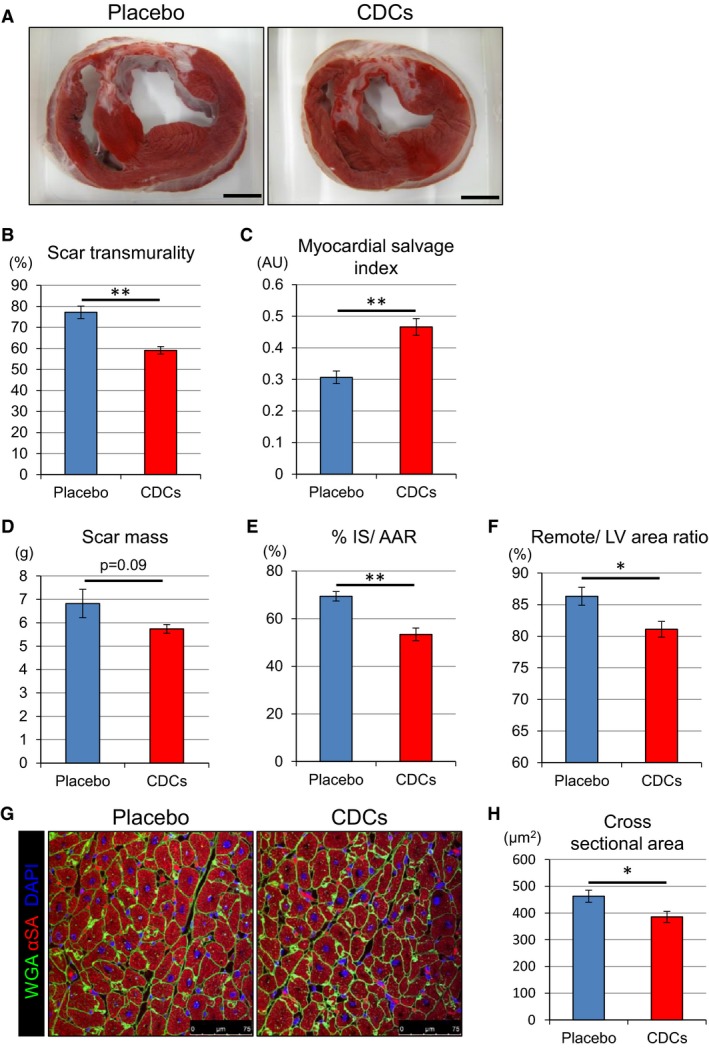
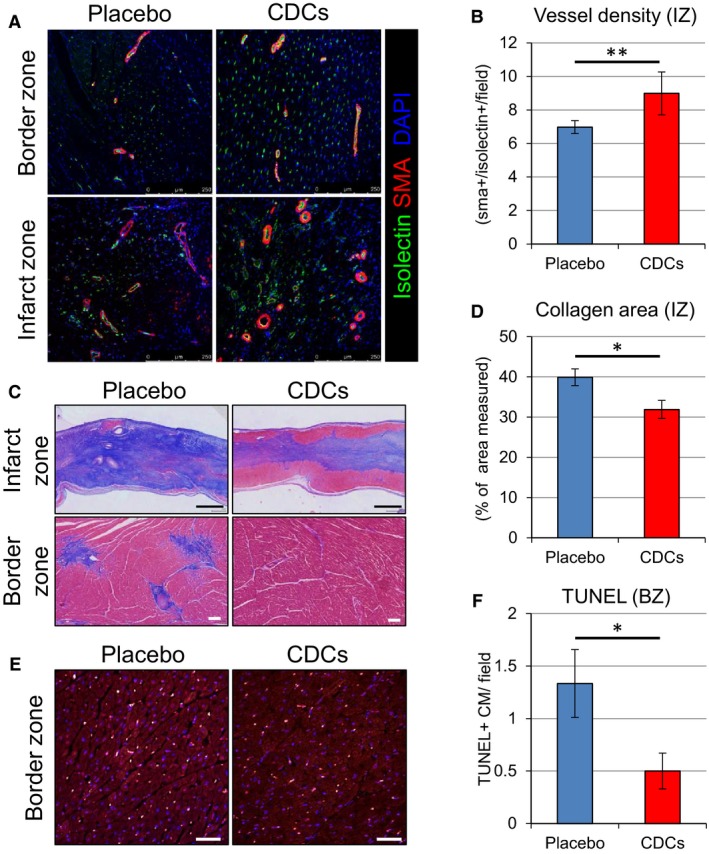
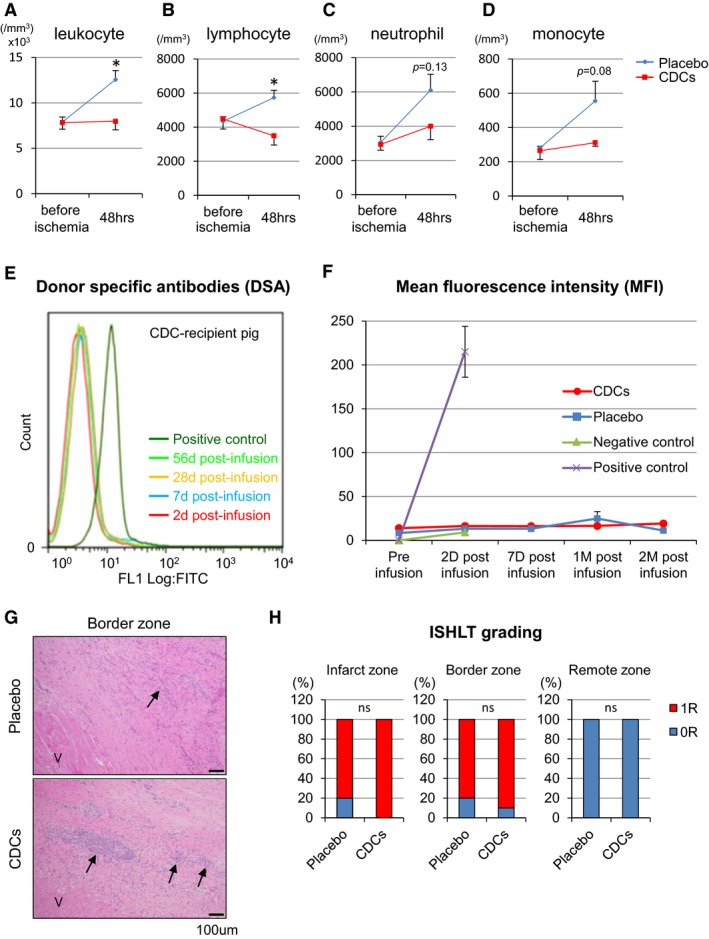
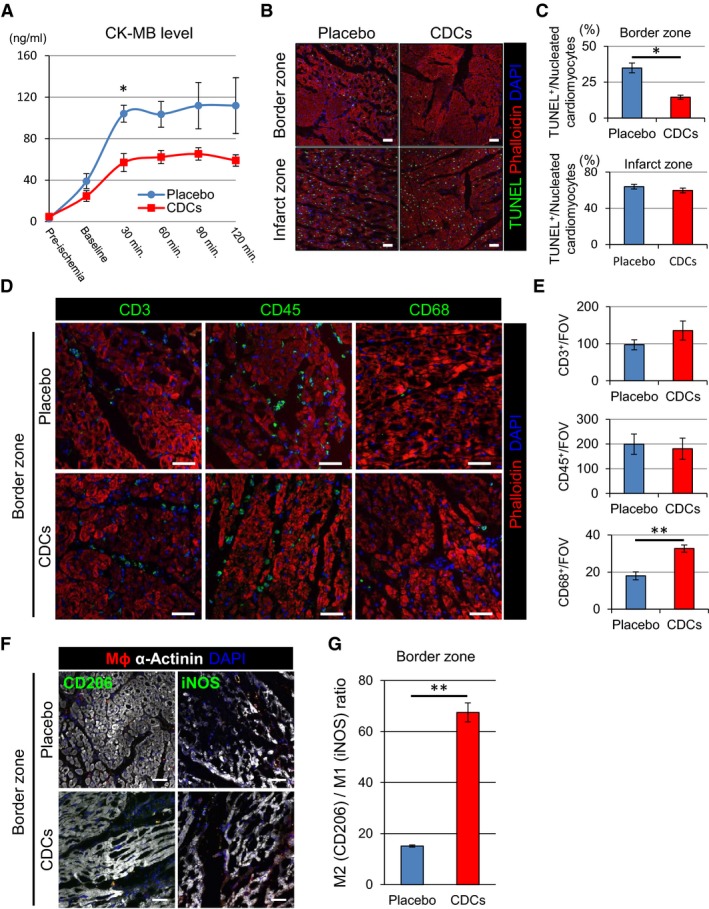
Methods and results: Minipigs underwent 1.5-hour mid-left anterior descending balloon occlusion followed by reperfusion and were randomized to receive intracoronary allo-CDCs or vehicle 30 minutes postreperfusion. Left ventriculography (LVG) demonstrated preserved ejection fraction (EF) and attenuation of LV remodeling in CDC-treated pigs. Pigs underwent cardiac magnetic resonance imaging (MRI) and LVG 1 hour and 8 weeks after therapy to evaluate efficacy. MRI showed improvement of EF and attenuation of LV remodeling immediately after allo-CDC infusion. In addition, allo-CDCs improved regional function and decreased hypertrophy 2 months post-treatment. Histological analysis revealed increased myocardial salvage index, enhanced vascularity, sustained reductions in infarct size/area at risk and scar transmurality, and attenuation of collagen deposition in the infarct zone of allo-CDC-treated pigs at 2 months. Allo-CDCs did not evoke lymphohistiocytic infiltration or systemic humoral memory response. Short-term experiments designed to probe mechanism revealed antiapoptotic effects of allo-CDCs on cardiomyocytes and increases in cytoprotective macrophages, but no increase in overall inflammatory cell infiltration 2 hours after cell therapy.

Conclusions: Allo-CDC infusion postreperfusion is safe, improves cardiac function, and attenuates scar size and remodeling. The favorable effects persist for at least 2 months after therapy. Thus, cellular postconditioning confers not only acute cardioprotection, but also lasting structural and functional benefits.

Keywords: allogeneic transplantation; cardioprotective effect; cardiosphere‐derived cells.


Figures

Figure 1
Figure 1
Study protocols. Placebo‐controlled pivotal trial (A) and mechanistic study (B). AMI indicates acute myocardial infarction; CDCs, cardiosphere‐derived cells; CK, creatine kinase; ECG, electrocardiogram; LVG, left ventriculography; MRI, magnetic resonance imaging.
Figure 2
Figure 2
Flow chart of experimental design. CDCs indicates cardiosphere‐derived cells; EF, ejection fraction; MI, myocardial infarction; MRI, magnetic resonance imaging.
Figure 3
Figure 3
Allogeneic CDCs preserve cardiac function and attenuate adverse remodeling compared to placebo pigs, as assessed by left ventriculography. Representative cine pictures of left ventriculography in placebo and CDC‐treated pig at endpoint (2 months; A). Yellow arrow indicates akinetic anterior wall of left ventricle. Paired EF in each groups at baseline (≈15 minutes postreperfusion) and endpoint (B). Paired end‐diastolic volume index (C) and end‐systolic volume index (D) in placebo and CDC groups at baseline and endpoint. CDCs indicates cardiosphere‐derived cells; EF, ejection fraction; LVEDVI, left ventricular end‐diastolic volume index; LVESVI, left ventricular end‐systolic volume index. Values are means±SEM. *P<0.05 between 2 groups.
Figure 4
Figure 4
Allogeneic CDCs exhibit improved global function and remodeling 1 hour after cell treatment compared to placebo, as assessed by MRI. Matched cine short‐axis images (at end‐diastole [ED] and end‐systole [ES]) at 1 hour and 2 months post‐treatment for pigs treated with placebo and allogeneic CDCs (A). Comparison of ejection fraction (B), LVEDVI (C), and LVESVI (D) at 1 hour and 2 months in placebo‐ and CDC‐treated pigs. Endocardial (red) and epicardial (green) contours of the LV are shown. Cardiac slices were divided into 6 segments to calculate regional wall motion and thickening in infarct and remote myocardium at 2 months (E). Regional wall motion (F) and percent thickening (G) in infarct and remote myocardium in placebo and CDC groups at 2 months. CDCs indicates cardiosphere‐derived cells; EF, ejection fraction; LVEDVI, left ventricular end‐diastolic volume index; LVESVI, left ventricular end‐systolic volume index; MRI, magnetic resonance imaging. Values are means±SEM. *P<0.05 and **P<0.01 between 2 groups.
Figure 5
Figure 5
Allogeneic CDCs improve regional wall motion and thickening, as assessed by MRI. Representative early and delayed Gd‐enhanced MRI images of heart in short‐axis section at 1 hour and 2 months in a placebo‐ and a CDC‐treated pig (A). One hour post–cell infusion, risk area (ischemic myocardium) is evident by areas of hyperintensity, including dark zone (yellow arrows). Arrows point to no‐reflow area. At 2 months, infarcted scar area (yellow arrow heads) appears hyperintense (white) whereas viable myocardium appears dark. Scar area decreased in CDC‐treated pig compared to placebo pig. Comparison of area at risk at 1 hour (B), volume of late Gd enhancement (LGE; C), total LV mass (D), and scar transmurality (E) at 2 months in placebo‐ and CDC‐treated pigs. Values are means±SEM. *P<0.05 and **P<0.01 between 2 groups. CDCs indicates cardiosphere‐derived cells; EF, ejection fraction; Gd, gadolinium; LV, left ventricular; MRI, magnetic resonance imaging.
Figure 6
Figure 6
Allogeneic CDCs prevent hypertrophy, decrease infarct size, and salvage myocardium, as assessed by postmortem histology. Representative short‐axis heart slices of a placebo‐ and a CDC‐treated pig after incubation with TTC. Viable myocardium stains brick red, whereas scarred myocardium appears white (A). Comparison of scar transmurality (B), myocardial salvage index (C), scar mass (D), and percent IS/AAR (E) at 2 months in placebo and CDC groups. Comparison of remote area (as percent of LV) at 2 months in placebo and CDC groups (F). Cardiomyocyte cross‐sectional area in the remote zone (G and H). AAR indicates area at risk; AU, astronimcal unit; CDCs, cardiosphere‐derived cells; IS, infarct size; LV, left ventricle; TTC, 2,3,5‐triphenyl tetrazolium chloride. Values are means±SEM. *P<0.05 and **P<0.01 between 2 groups. Scale bar in (A) is 1 cm.
Figure 7
Figure 7
Immunohistological assessment of vessel density, collagen deposition, and apoptosis of cardiomyocytes. Representative images of vessel density in border and infarct zones assessed by immunostaining for isolectin and α‐smooth muscle actin at 2 months in placebo‐ and CDC‐treated pigs (A). Quantitative analysis of vessel density in infarct zone (B). Representative sections from the infarcted wall and border zone of placebo‐ and CDC‐treated pigs stained with Masson's trichrome. Scar area stains blue and viable myocardium stains red (C). Quantitative analysis of collagen deposition in infarct zone (D). Comparison of apoptosis of cardiomyocytes assessed by TUNEL staining (E) and quantitative evaluation of TUNEL‐positive cell number in the border zone (F). Values are means±SEM. *P<0.05 and **P<0.01 between 2 groups. Scale bars: (C) (upper)=1 mm; (C) (lower)=100 μm; and (E)=50 μm. BZ indicates border zone; CDCs, cardiosphere‐derived cells; DAPI, 4′,6‐diamidino‐2‐phenylindole; IZ, infarct zone; SMA, smooth muscle actin; TUNEL, terminal deoxynucleotidyl transferase dUTP nick end labeling.
Figure 8
Figure 8
Inflammation and immune responses. Serum total leukocyte (A), lymphocyte (B), neutrophil (C), and monocyte (D) counts in placebo‐ and CDC‐treated pigs at baseline (pretreatment) and 48 hours. Representative levels of circulating IgG antidonor antibodies were measured in CDC‐treated pig serum samples with flow cytometry (E). Mean fluorescence intensity (MFI) of circulating IgG antidonor antibody (F). No alloreactive antibodies were detected in any recipients of allogeneic CDCs at any time point. G, Histopathology (H&E staining) in border zone in placebo‐ and CDC‐treated pigs. Viable cardiac muscle fibers (V) are present in the lower left corner of the image. Arrows indicates minimal and mild lymphohistiocytic infiltrates in the infarct of placebo and CDCs group, respectively. Ratio of Grade 0R or1R with ISHLT grading system in infarct, border, and remote zone (H). CDCs indicates cardiosphere‐derived cells; H&E, hematoxylin and eosin; IgG, immunoglobulin G; ISHLT, the International Society for Heart and Lung Transplantation. Values are means±SEM. *P<0.05 between 2 groups.
Figure 9
Figure 9
Allogeneic CDCs induce cytoprotective effects by anti‐inflammatory and ‐apoptotic mechanisms. Level of serum CK‐MB with placebo‐ and CDC‐treated pigs during the 2 hours postintervention (A). TUNEL staining in border and infarct zones of placebo and CDC‐treated pigs 2 hours postintervention (B). Quantification of TUNEL‐positive cardiomyocytes in border and infarct zones of placebo and CDC‐treated pigs (C). Representative images (D) and quantification (E) of inflammatory cell infiltration (CD3, CD45, and CD68) in border zone of placebo‐ and CDC‐treated pigs 2 hours postintervention. Representative images of M1 (iNos+) and M2 (CD206+) macrophages in the border zone of placebo‐ and CDC‐treated pigs 2 hours postintervention (F). Macrophage polarization markers iNos (M1) and CD206 (M2) were utilized to differentiate the proportion of infiltrating M1 and M2 macrophages within the border zone tissue 2 hours postintervention. Data are presented as the number of CD206+ vs iNos+ macrophage per field of view (G). Values are means±SEM. *P<0.05 and **P<0.01 between 2 groups. Scale bars are 50 μm in (B, D, and F). CDCs indicates cardiosphere‐derived cells; CK, creatine kinase; iNOS, inducble nitric oxide synthase; TUNEL, terminal deoxynucleotidyl transferase dUTP nick end labeling.

Similar articles

Cited by

References

    1. Kloner RA, Rezkalla SH. Cardiac protection during acute myocardial infarction: where do we stand in 2004? J Am Coll Cardiol. 2004;44:276–286. - PubMed
    1. Kanazawa H, Tseliou E, Malliaras K, Yee K, Dawkins JF, De Couto G, Smith RR, Kreke M, Seinfeld J, Middleton RC, Gallet R, Cheng K, Luthringer D, Valle I, Chowdhury S, Fukuda K, Makkar RR, Marban L, Marban E. Cellular postconditioning: allogeneic cardiosphere‐derived cells reduce infarct size and attenuate microvascular obstruction when administered after reperfusion in pigs with acute myocardial infarction. Circ Heart Fail. 2015;8:322–332. - PMC - PubMed
    1. Malliaras K, Smith RR, Kanazawa H, Yee K, Seinfeld J, Tseliou E, Dawkins JF, Kreke M, Cheng K, Luthringer D, Ho CS, Blusztajn A, Valle I, Chowdhury S, Makkar RR, Dharmakumar R, Li D, Marban L, Marban E. Validation of contrast‐enhanced magnetic resonance imaging to monitor regenerative efficacy after cell therapy in a porcine model of convalescent myocardial infarction. Circulation. 2013;128:2764–2775. - PMC - PubMed
    1. Swindle MM. Swine in the Laboratory: Surgery, Anesthesia, Imaging and Experimental Techniques. Boca Raton, FL: CRC Press; 2007.
    1. Payne AR, Casey M, McClure J, McGeoch R, Murphy A, Woodward R, Saul A, Bi X, Zuehlsdorff S, Oldroyd KG, Tzemos N, Berry C. Bright‐blood T2‐weighted MRI has higher diagnostic accuracy than dark‐blood short tau inversion recovery MRI for detection of acute myocardial infarction and for assessment of the ischemic area at risk and myocardial salvage. Circ Cardiovasc Imaging. 2011;4:210–219. - PubMed

Publication types

MeSH terms