. 2016 Mar;24(3):615-25.
doi: 10.1002/oby.21383. Epub 2016 Feb 9.

Obesity decreases B cell responses in young and elderly individuals

Affiliations

Obesity decreases B cell responses in young and elderly individuals

Daniela Frasca et al. Obesity (Silver Spring). 2016 Mar.

Abstract

Objective: To evaluate the effects of obesity-associated inflammation on influenza vaccine responses.

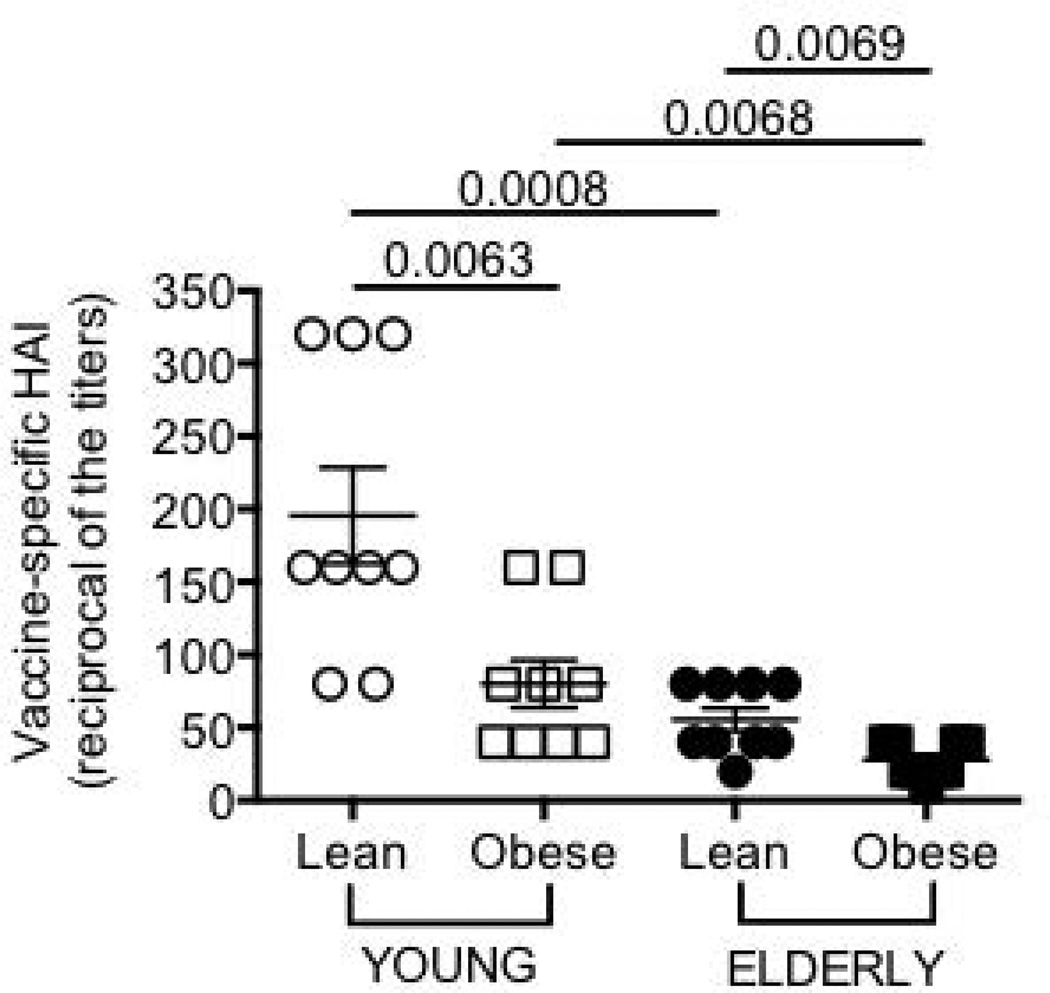
Methods: In young and elderly individuals, both lean and with obesity, antibody responses to influenza vaccination were measured.

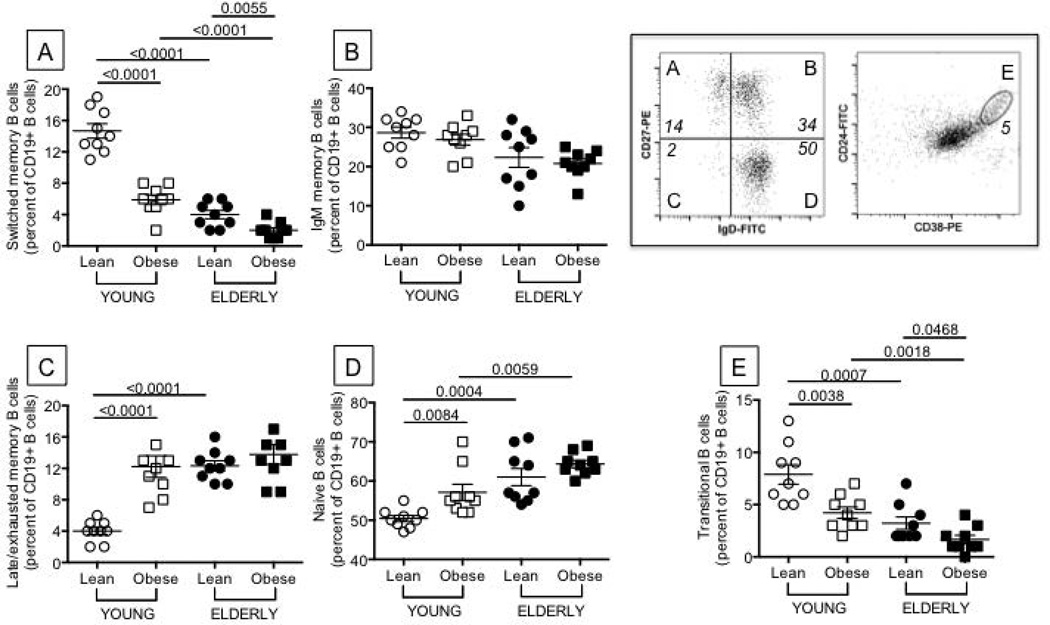
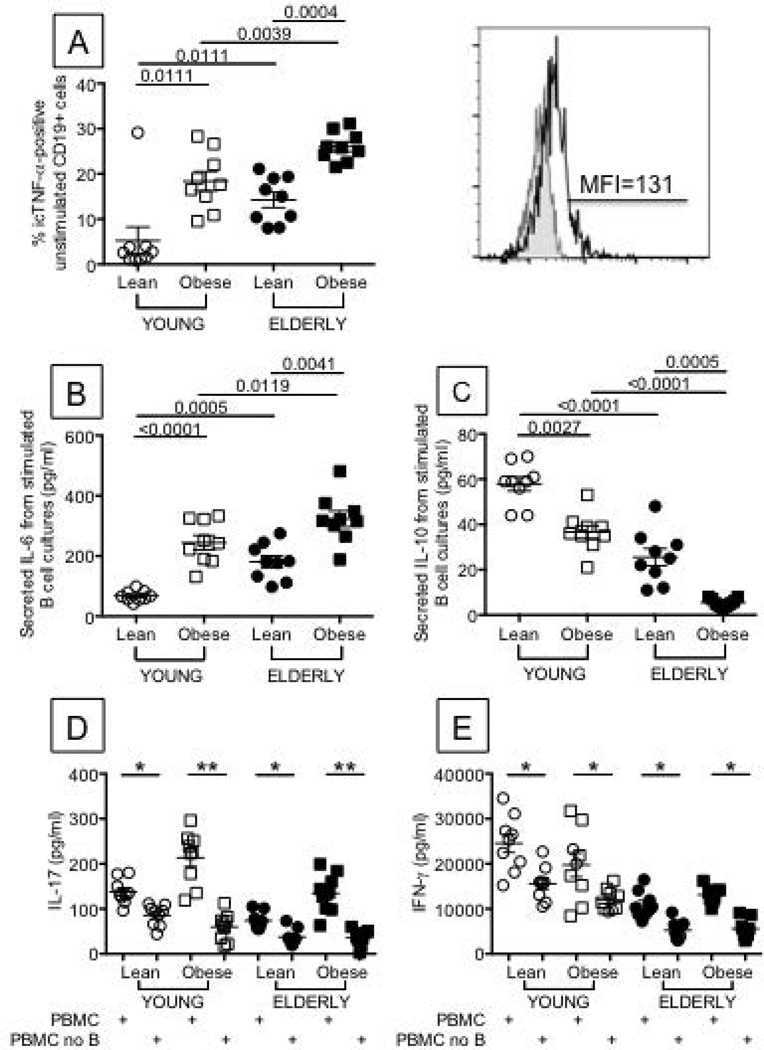
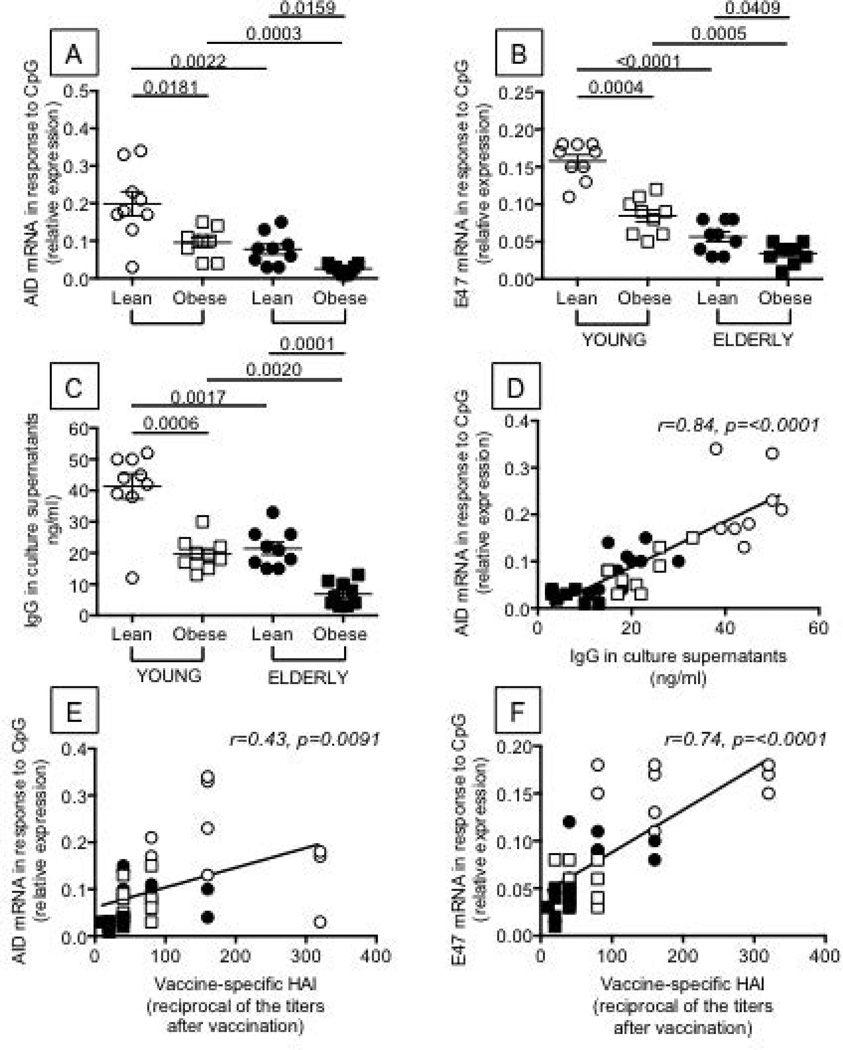
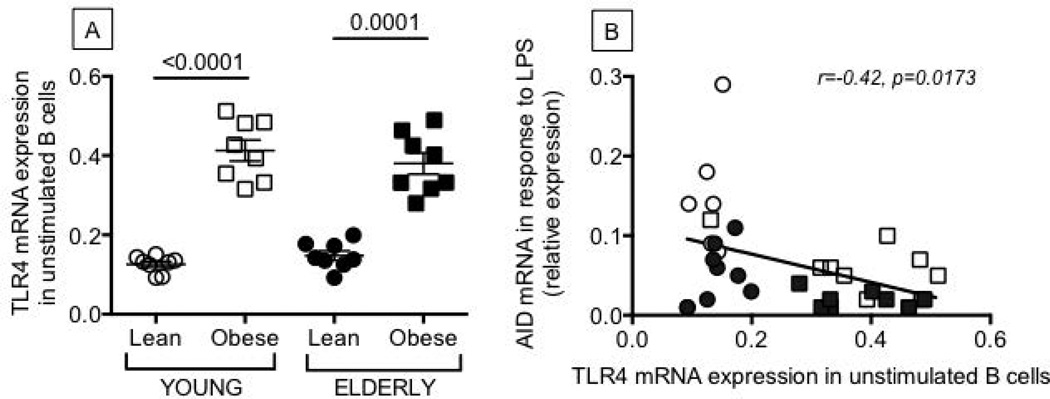
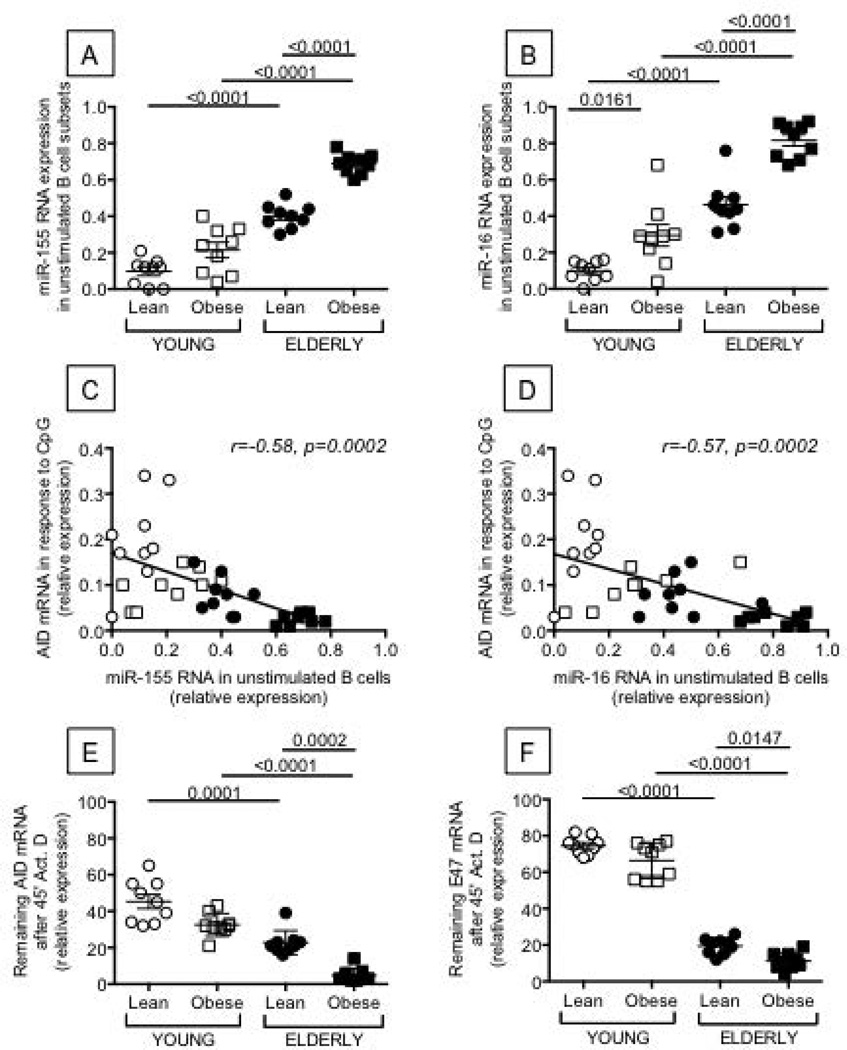
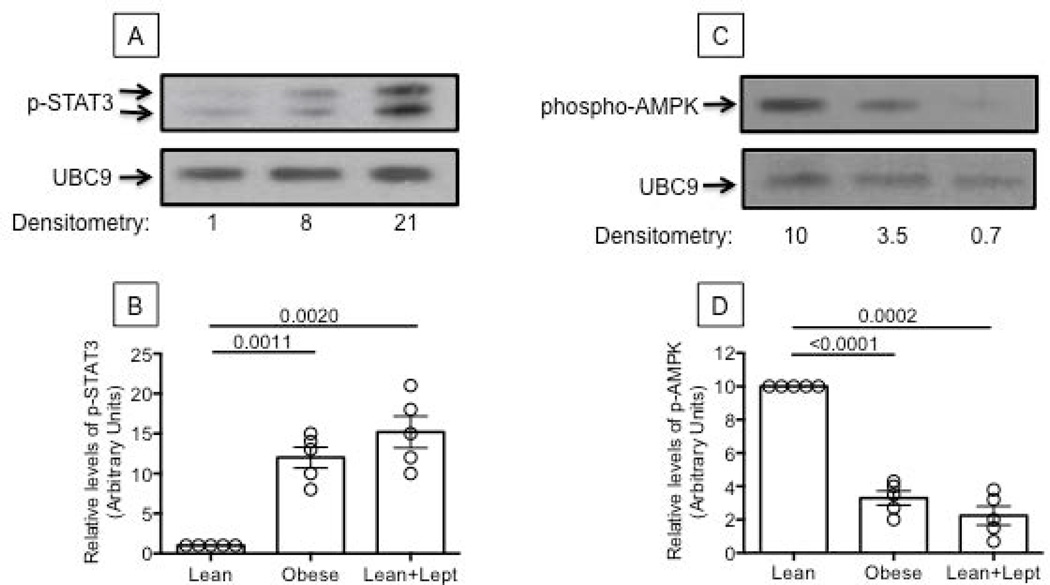
Results: A decrease in in vivo vaccine responses, circulating switched memory, and transitional B cells and an increase in pro-inflammatory late/exhausted memory B cells were found. In vitro B cell function was measured by activation-induced cytidine deaminase and E47, markers of optimal antibody responses. Moreover, IL-6 production was increased, whereas IL-10 production was decreased in cultures of B cells from individuals with obesity. Markers of immune activation (TNF-α, TLR4, micro-RNAs) in unstimulated B cells were also found increased and were negatively correlated with B cell function. In order to reveal potential mechanisms, we stimulated B cells from lean individuals in vitro with leptin, the adipokine increased in obesity. Leptin increased phospho-STAT3, crucial for TNF-α production, and decreased phospho-AMPK, the energy sensing enzyme upstream of phospho-p38 MAPK and E47. Leptin-induced phospho-STAT3 and phospho-AMPK levels were similar to those in B cells from individuals with obesity.

Conclusions: These results demonstrate that leptin can be responsible for decreased B cell function in obesity.


Conflict of interest statement

Disclosure: No potential conflicts of interest relevant to this article are reported.

Figures

Figure 1
Figure 1. Obesity decreases the influenza vaccine response in young and elderly individuals
Sera were collected before (t0) and after vaccination (t7), and analyzed by HAI assay. To evaluate antibody production to the vaccine (and therefore to all viral strains present in the vaccine), the reciprocal of the titers after vaccination is shown. The response peaked at t7 and decreased only minimally at t28. The reciprocal of the titers decreased from 196 to 160 (lean young), from 80 to 62 (young with obesity), from 56 to 51 (lean elderly) and from 28 to 23 (elderly with obesity). ANOVA: F(3,36)=6.719,p<.05, observed power=.713
Figure 2
Figure 2. Obesity decreases the percentage of switched memory and transitional B cells and increases that of late/exhausted memory B cells
One hundred µl of blood from the same individuals as in Figure 1 were stained for 20 min at room temperature with the following antibodies: anti-CD19 (BD 555415), anti-CD27 (BD 555441), and anti-IgD (BD 555778) to measure switched memory (IgD-CD27+), IgM memory (IgD+CD27+), naive (IgD+CD27−), late/exhausted memory (IgD-CD27−) B cells. Anti-CD24 (BD 555427) and anti-CD38 (BD 555460) antibodies were used to measure transitional B cells (CD24brightCD38bright). Switched memory (A) are IgD-CD27+, IgM memory (B) are IgD+CD27+, naive (C) are IgD+CD27−, late/exhausted memory (D) are IgD-CD27−, transitional B cells (E) are CD24brightCD38bright. Results are expressed as percentages of CD19+ B cells. Representative dot plots to evaluate the different subsets are shown in the top right quadrant of the Figure (both are from a lean young individual). B cell percentages and numbers are decreased by obesity in young and elderly individuals. Percentages and numbers are, respectively: 17% and 425 cells/µl (lean young), 12% and 287 cells/µl (young with obesity), 5% and 125 cells/µl (lean elderly) and 3% and 69 cells/µl (elderly with obesity). ANOVA - A: F(3,36)=35.37,p<.01, observed power=1. B: F(3,36)=0.05,p=.94, observed power=.051. C: F(3,36)=1.304,p=.26, observed power=.20. D: F(3,36)=23.19,p<.01, observed power=.997. E: F(3,36)=3.98,p=.054, observed power=.49.
Figure 3
Figure 3. Obesity increases pro-inflammatory cytokines and decreases anti-inflammatory cytokines in ex vivo and in vitro-stimulated B cells from young and elderly individuals
A. One hundred µl of blood from the same individuals as in Figure 1 were stained with anti-CD19 (BD 555415), then fixed, permeabilized with 1X-PBS/0.2%Tween 20, and incubated with anti-TNF-α (BD 554512). Results are expressed as percentages of CD19+ B cells expressing icTNF-α. A representative histogram of icTNF-α staining (from a young individual with obesity) is shown right of A. MFI values are, respectively: 43±2 (lean young), 138±11 (young with obesity), 133±20 (lean elderly) and 251±9 (elderly with obesity). B. and C. B cells (106 cells/ml) from the same individuals as in Figure 1, were cultured with CpG and anti-Ig antibodies for 2 days. Cultures were harvested and supernatants tested for IL-6 (B) and IL-10 (C) production by ELISA. D and E. PBMCs were stimulated for 48 hrs with plate-bound anti-CD3 in the presence or absence of B cells, which were removed by magnetic sorting using CD19 microbeads (<0.1% B cells in PBMC after selection). IL-17 (D) and IFN-γ (E) were measured in culture supernatants by ELISA. In a pilot experiment, we have stimulated sorted B cells for 48 hrs with plate-bound anti-CD3 and neither IL-17 nor IFN-γ were found in culture supernatants (<2 pg/ml and <4 pg/ml, respectively, data not shown). In another pilot experiment, performed with PBMC from 2 young with obesity and 2 elderly with obesity, B cells were added back to the B cell-depleted PBMC. IL-17 production was similar to that observed in undepleted PBMC cultures (data not shown). *p<0.05, **p<0.01. ANOVA - A: F(3,36)=.131,p=.72, observed power=.064. B: F(3,36)=.847,p=.363, observed power=.146. C: F(3,36)=.057,p=.812, observed power=.056. D (PBMC): F(3,36)=.315,p=.58, observed power=.085. D (PBMC no B): F(3,36)=2.442,p=.13, observed power=.33. E (PBMC): F(3,36)=3.96,p=.06, observed power=.49. E (PBMC no B): F(3,36)=4.944,p=.033, observed power=.578.
Figure 4
Figure 4. Obesity decreases AID, E47 and IgG production in B cells from both young and elderly individuals
B cells (106 cells/ml) from the same individuals as in Figure 1 were isolated from the peripheral blood using CD19 microbeads and positive selection. Flow cytometry analysis of sorted B cell subsets shows that the relative percentages of the different B cell subsets are maintained after magnetic sorting (not shown). Using anti-CD3 and anti-CD14 antibodies, contamination with T cells and monocytes is usually less than 3%. In a pilot experiment, we have also stimulated the magnetically-sorted B cells with plate-bound anti-CD3 or LPS and found no IL-2/IFN-γ production and no TNF-α production in culture supernatants by T cells or monocytes, respectively (data not shown). B cells were cultured with CpG for 1 and 5 days to measure E47 and AID, respectively. Results show qPCR values (2−ΔΔCt) of AID (A) and E47 (B) mRNA expression normalized to GAPDH±SE. C. IgG production was measured in culture supernatants by ELISA. D. The in vivo response (HAI) is positively correlated with AID. E. The in vivo response (HAI) is positively correlated with E47. ANOVA - A: F(3,36)=2.332,p=.135, observed power=3.18. B: F(3,36)=16.08,p<.0001, observed power=.974. C: F(3,36)=2.58,p=.12, observed power=.346.
Figure 5
Figure 5. Unstimulated B cells from young and elderly individuals with obesity have higher levels of expression of TLR4 than lean controls
B cells were isolated from the peripheral blood of the same individuals as in Figure 1, and mRNA extracted to evaluate TLR4 (A) mRNA expression. Results are expressed as qPCR values (2−ΔΔCt) of TLR4 mRNA normalized to GAPDH. B. TLR4 in unstimulated B cells and AID in the same B cells after stimulation with LPS are negatively correlated. ANOVA - A: F(3,36)=2.358,p=.134, observed power=.32.
Figure 6
Figure 6. The expression of miR-155 and miR-16 is higher in unstimulated B cells from young and elderly individuals with obesity as compared to lean controls and is negatively correlated with AID
B cells were isolated from the peripheral blood of the same individuals as in Figure 1. Trizol was added to the pellets of unstimulated B cells (1 ml/106 B cells). RNA was extracted, RT reactions performed in the presence of specific primers for miR-155, miR-16, or U6 (control), and qPCR performed to evaluate expression levels of miR-155 (A) and miR-16 (B). Results are expressed as ratio miR:U6 levels. C. miR-155 in unstimulated B cells and AID in the same B cells after stimulation are negatively correlated. D. miR-16 in unstimulated B cells and AID in the same B cells after stimulation are negatively correlated. E. AID mRNA stability is decreased in B cells from elderly with obesity as compared to lean elderly individuals. B cells (106 cells/ml) were stimulated with CpG for 5 days. At the end of the stimulation time, RNA transcription was blocked by Actinomycin D (10 µg/ml). After 45 minutes, cells were harvested, RNA extracted and qPCR performed. Results are expressed as percentages of the samples untreated with Actinomycin D. F. E47 mRNA stability is decreased in B cells from elderly with obesity as compared to lean elderly individuals. B cells were processed as in E. ANOVA - A: F(3,36)=11.454,p=.002, observed power=.91. B: F(3,36)=4.62,p=.038, observed power=.552. E: F(3,36)=1.31,p=.26, observed power=.20. F: F(3,36)=.00,p=1.0, observed power=.05.
Figure 7
Figure 7. Leptin increases phospho-STAT3 and decreases phospho-AMPK in B cells from young lean individuals
A. Nuclear protein extracts from unstimulated B cells from one lean (left) and one young individual with obesity (middle) were analyzed in Western blot to evaluate phospho-STAT3. B cells from the lean individual were also stimulated with leptin (100 ng/106 cells) for 15 min (right). UBC9 was used as loading control. B. Densitometry (arbitrary units) of phospho-STAT3 (both bands), normalized to UBC9, from 5 young lean and 5 young individuals with obesity. Results refer to normalized phospho-STAT3 in young lean individuals, taken as 1. C. Cytoplasmic extracts from B cells from the same individuals in A and B were analyzed in Western blot to evaluate phospho-AMPK. UBC9 was used as loading control. D. Densitometry (arbitrary units) of phospho-AMPK, normalized to UBC9. Results refer to normalized phospho-AMPK in young lean individuals, taken as 10. ANOVA - B: F(3,36)=.000,p=107.174, observed power=1.00. D: F(3,36)=.000,p=29.511, observed power=1.00.

Comment in

References

    1. Nishimura S, Manabe I, Nagasaki M, Eto K, Yamashita H, Ohsugi M, et al. CD8+ effector T cells contribute to macrophage recruitment and adipose tissue inflammation in obesity. Nature medicine. 2009;15:914–920. - PubMed
    1. Lumeng CN, Bodzin JL, Saltiel AR. Obesity induces a phenotypic switch in adipose tissue macrophage polarization. J Clin Invest. 2007;117:175–184. - PMC - PubMed
    1. Winer DA, Winer S, Shen L, Wadia PP, Yantha J, Paltser G, et al. B cells promote insulin resistance through modulation of T cells and production of pathogenic IgG antibodies. Nature medicine. 2011;17:610–617. - PMC - PubMed
    1. Nikolajczyk BS. B cells as under-appreciated mediators of non-auto-immune inflammatory disease. Cytokine. 2010;50:234–242. - PMC - PubMed
    1. DeFuria J, Belkina AC, Jagannathan-Bogdan M, Snyder-Cappione J, Carr JD, Nersesova YR, et al. B cells promote inflammation in obesity and type 2 diabetes through regulation of T-cell function and an inflammatory cytokine profile. Proc Natl Acad Sci U S A. 2013;110:5133–5138. - PMC - PubMed

Publication types

Substances

LinkOut - more resources