. 2016 Jul 1;594(13):3501-16.
doi: 10.1113/JP271853. Epub 2016 Mar 17.

Properties of an optogenetic model for olfactory stimulation

Affiliations

Properties of an optogenetic model for olfactory stimulation

Federica Genovese et al. J Physiol. .

Abstract

Key points: In olfactory research it is difficult to deliver stimuli with defined intensity and duration to olfactory sensory neurons. Expression of channelrhodopsin 2 (ChR2) in olfactory sensory neurons provides a means to activate these neurons with light flashes. Appropriate mouse models are available. The present study explores the suitability of an established olfactory marker protein (OMP)/ChR2-yellow fluorescent protein (YFP) mouse model for ex vivo experimentation. Expression of ChR2 in sensory neurons of the main olfactory epithelium, the septal organ and vomeronasal organ is characterized. Expression pattern of ChR2 in olfactory receptor neurons and the properties of light responses indicate that light stimulation does not impact on signal transduction in the chemosensory cilia. Light-induced electro-olfactograms are characterized with light flashes of different intensities, durations and frequencies. The impact of light-induced afferent stimulation on the olfactory bulb is examined with respect to response amplitude, polarity and low-pass filtering.

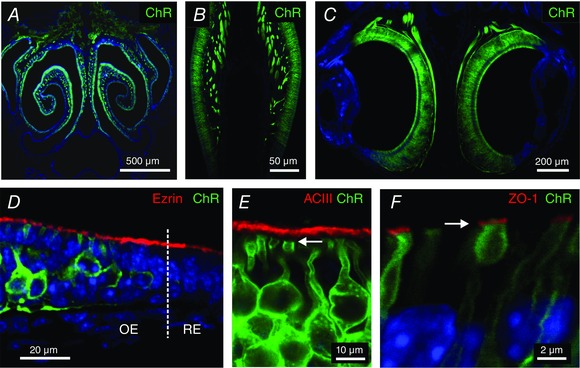
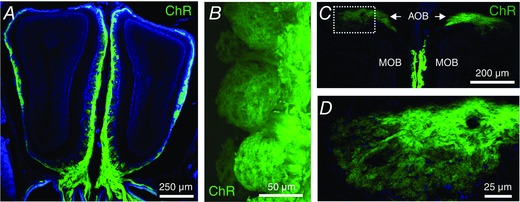
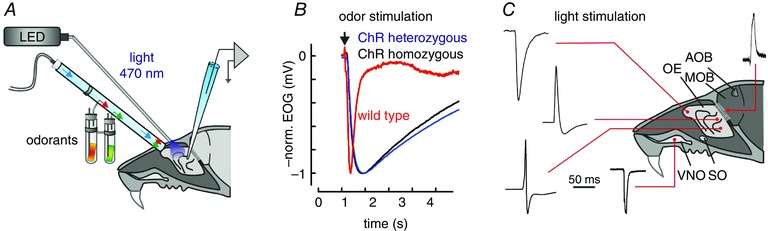
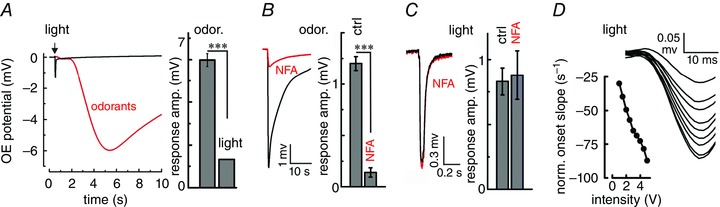
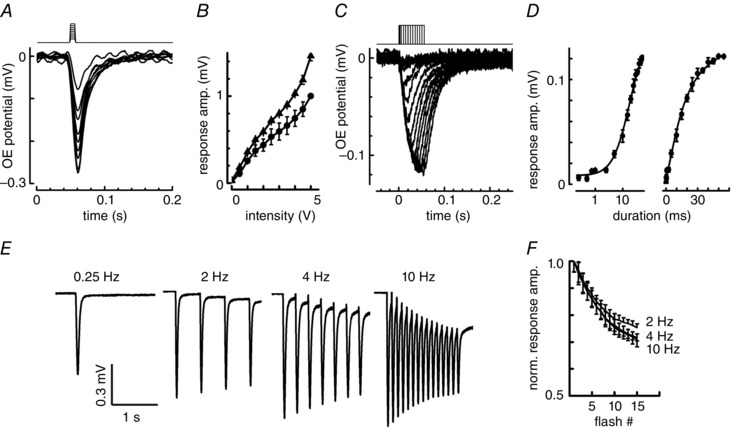
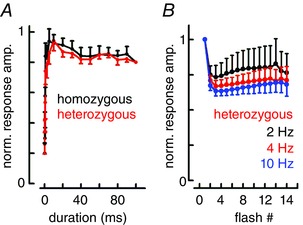
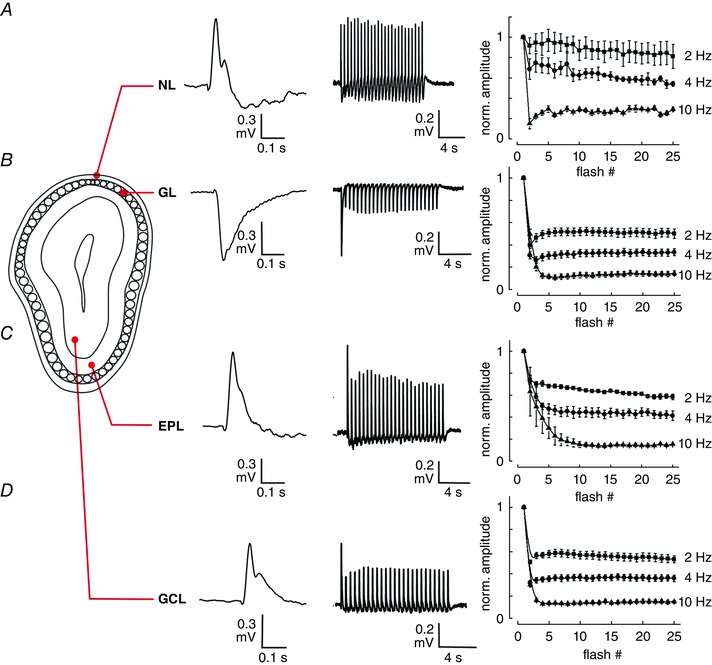
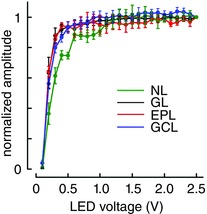
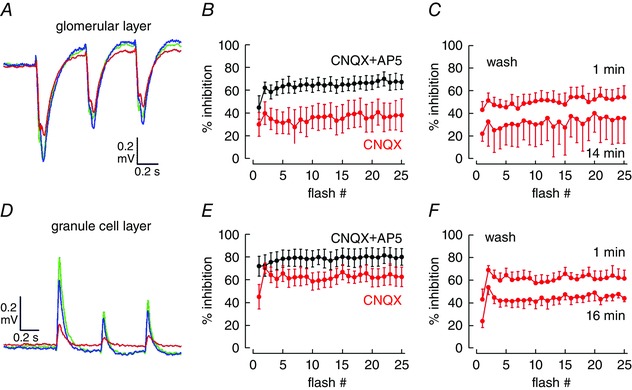
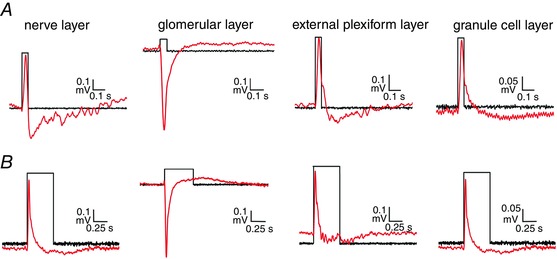
Abstract: For the examination of sensory processing, it is helpful to deliver stimuli in precisely defined temporal and spatial patterns with accurate control of stimulus intensity. This is challenging in experiments with the mammalian olfactory system because airborne odorants have to be transported into the intricate sensory structures of the nose and must dissolve in mucus to be detected by sensory neurons. Defined and reproducible activity can be generated in olfactory sensory neurons that express the light-gated ion channel channelrhodopsin 2 (ChR2). The neurons can be stimulated by light flashes in a controlled fashion by this optogenetic approach. Here we examined the application of an olfactory marker protein (OMP)/ChR2-yellow fluorescent protein (YFP) model for ex vivo exploration of the olfactory epithelium and the olfactory bulb of the mouse. We studied the expression patterns of ChR2 in the main olfactory system, the vomeronasal system, and the septal organ, and we found that ChR2 is absent from the sensory cilia of olfactory sensory neurons. In the olfactory epithelium, we characterized light-induced electro-olfactograms with respect to peripheral encoding of stimulus intensity, stimulus duration and stimulus frequency. In acute slices of the olfactory bulb, we identified specific aspects of the ChR2-induced input signal, concerning its dynamic range, its low-pass filter property and its response to prolonged stimulation. Our study describes the performance of the OMP/ChR2-YFP model for ex vivo experimentation on the peripheral olfactory system and documents its versatility and its limitations for olfactory research.


Figures

Figure 1
Figure 1. Expression of ChR–YFP in the nasal sensory epithelia
A, a coronal section of the nasal cavity showing ChR2–YFP signals along the septum, the turbinates and the lateral walls. The signal originates from the main olfactory neuroepithelium at the surface and from subepithelial axon bundles. The weaker signal at the top arises from OSN axons crossing the cribriform plate toward the olfactory bulb. B, ChR2–YFP signals in the septal organ on both sides of the central septum of the nasal cavity. C, a coronal section from the ventral aspect of the anterior nasal cavity showing the vomeronasal organ on both sides of the septum. The chemosensory surface that faces the lumen is labelled, as is the neuroepithelium with the vomeronasal neurons, and the afferent fibres projecting to the accessory olfactory bulb. D, in the main olfactory epithelium (OE), ChR2–YFP‐expressing cells are present, but the respiratory epithelium (RE) is devoid of such cells. The microvilli marker ezrin (red) marks the surface of both epithelia. E, at higher resolution, an immunolabel of the ciliary marker ACIII (red) renders visible a gap (arrow) between the dendritic ChR2–YFP signal and the cilia. F, labelling the tight‐junction marker ZO‐1 (red) demonstrates that the expression of ChR2–YFP does not cross the tight junction border and does not reach the ciliary membrane. The blue label represents nuclear DAPI stain.
Figure 2
Figure 2. Expression of ChR2–YFP in the olfactory bulb
A, a coronal section of the two parts of the main olfactory bulb shows the path of OSN axons from the posterior end of the nasal cavity (bottom) into the nerve layer that enwraps the main olfactory bulbs. B, ChR2–YFP‐expressing axons leave the nerve layer and enter the outer nuclear layer of the bulb where they coalesce to form the globular neuropils of the glomeruli. C, the accessory olfactory bulb (AOB) is located at the dorsal surface at the posterior end of the main olfactory bulb (MOB). It receives the ChR2–YFP‐expressing axons of chemosensitive neurons located in the vomeronasal organ (cf. Fig. 1 C). The boxed area is displayed at higher magnification in D. Glomeruli in the AOB are smaller than in the MOB but are discernible by the ChR2–YFP fluorescence. The blue label represents nuclear DAPI stain.
Figure 3
Figure 3. Characterization of epithelial light response in ChR2–YFP mice
A, ex vivo preparation of the olfactory system for epithelial recording. The exposed olfactory epithelium can be stimulated with 470 nm light to open ChR2 channels, and with odorants through an air tube. Surface potentials are recorded through a micropipette filled with Ringer solution. B, surface potentials elicited by the odorant mixture H100 display a slower time course in OMP/ChR2–YFP mice compared with wild‐type (red), reflecting the lack of the olfactory marker protein (OMP) in the homozygous OMP−/−/ChR2–YFP+/+ animals (black). Heterozygous OMP−/+/ChR2–YFP+/− animals, which possess one intact OMP allele, show similarly delayed EOG kinetics (blue). C, shapes of light‐induced surface potentials recorded from the olfactory epithelium (OE) depend on the point of recording. Negative, monophasic signals originate from anterior areas of the OE, biphasic signals from posterior regions, reflecting increasing contributions from capacitive currents from subepithelial axon bundles. The vomeronasal organ (VNO) produced negative, monophasic signals in response to light flashes. AOB, accessory olfactory bulb; MOB, main olfactory bulb; SO, septal organ of Masera.
Figure 4
Figure 4. Origin of epithelial light‐responses
A, comparison of a light response and an odorant response from the same spot on an olfactory epithelium. Both responses were elicited by 50 ms stimulations. Onset and decline of the light response are much faster, and the mean amplitude of light responses amounts to only 23% of odorant responses. Bar graph: mean of 8 animals with SEM; unpaired t test; P < 0.001. B, odorant responses are largely inhibited by the chloride‐channel blocker niflumic acid (NFA, 300 μm). Bar graph: mean of 8 animals with SEM; paired t test; P = 0.0005. C, light responses are resistant to 300 μm niflumic acid. Bar graph: mean of 3 animals with SEM; paired t test; P = 0.327. D, quantification of the onset kinetics of a light response. Increasing light intensity (given as voltage applied to the LED light source) causes increasing slope of the onset. The normalized onset slope (slope divided by maximal amplitude) reaches 90 s−1 at full light intensity, but does not saturate.
Figure 5
Figure 5. Graded light stimulation of the olfactory epithelium at reduced light intensity
A, light response of a single spot of olfactory epithelium to 10 ms flashes of light delivered at 1 min intervals with increasing intensity. The response amplitude increased and, even at the highest light intensity (5 V LED voltage), full recovery was achieved within 100 ms. B, the intensity–response relation for three runs on the same recording spot displays a non‐linear shape. Intensity–response relations from different spots have different slopes but similar shapes. No saturation is discernible. C, applying bright flashes (5 V LED voltage) at increasing durations (0.1–55 ms) caused increasing responses that recovered within 10–100 ms. D, the mean duration–response relation (3 repeats from the same spot) displayed a near‐linear region between 3 and 20 ms and approached saturation with 30 ms flashes. E, surface‐potential response to repetitive stimulation by light flashes with 25 ms duration (2 Hz and 10 Hz), 40 ms (0.25 Hz), or 50 ms (4 Hz), all recorded from the same spot of olfactory epithelium. F, decline of response amplitudes during a series of 15 flashes delivered at different frequencies. The amplitudes decline about 20–30% at all frequencies and appear to level off after 10–15 flashes. Means (± SEM) are averages of 12 recordings from 4 animals.
Figure 6
Figure 6. Comparison of epithelial surface potentials in homozygous and heterozygous OMP/ChR2–YFP mice
A, the amplitudes of surface potentials triggered by bright flashes increase with flash duration and show similar characteristics in homozygous OMP−/−/ChR2–YFP+/+ mice (means ± SEM of 6 recordings from 3 mice) and heterozygous OMP−/+/ChR2–YFP+/− mice (means ± SEM of 8 recordings from 4 mice). B, during repetitive photo‐stimulation with bright, 25 ms flashes, all responses following the first settle on a frequency‐dependent, virtually time‐invariant level. This level is similar to the one recorded in homozygous mice (∼70% of initial amplitude; means ± SEM of 6 recordings from 3 mice).
Figure 7
Figure 7. Photo‐stimulation of ChR2 in the main olfactory bulb
Local field potentials recorded from the indicated layers of the main olfactory bulb (MOB). A, nerve layer (NL); (B) glomerular layer (GL); C, external plexiform layer (EPL); D, granule cell layer (GCL). The middle column shows examples of responses to 2 Hz photo‐stimulation with 50 ms flashes of 1 V intensity. The diagrams display mean LFP amplitudes at the indicated stimulation frequencies, normalized to the respective first response. Means (± SEM) are averages of 9 recordings from 3 animals.
Figure 8
Figure 8. Light sensitivity of ChR2 stimulation in MOB tissue slices
Local field potential amplitudes were recorded from nerve layer (NL), glomerular layer (GL), external plexiform layer (EPL) and granule cell layer (GCL) during application of 20 ms flashes to the outer layers of the bulb at increasing light intensities. The time between individual flashes was 10 s. Each recording spot was examined with the entire range of intensities shown. Means (± SEM) are averages of 9 recordings from 3 animals, normalized to the respective response recorded at the highest light intensity.
Figure 9
Figure 9. Effects of glutamate‐receptor antagonists on local field potentials in the MOB
A, LFP response of the glomerular layer to 3 light flashes (50 ms, 2 Hz, 1 V) before applying 5 μl ACSF to the recording spot (green trace), 1 min after applying the ACSF (blue trace), and 1 min after applying 5 μl ACSF containing 20 μm CNQX (red trace). B, percentage inhibition of LFP amplitudes following application of 20 μm CNQX (red trace) and 20 μm CNQX + 100 μm AP5 (black trace), compared with amplitudes with ACSF alone. C, partial recovery of LFP amplitudes expressed as the decline of inhibition efficiency after 14 min perfusion with ACSF. D–F, same experiments as in A–C but recorded from the granule cell layer. Means (± SEM) are averages of 9 recordings from 3 animals.
Figure 10
Figure 10. The effects of synaptic depression on light‐induced MOB signals
A, LFP recordings (red traces) elicited by a light flash of 100 ms duration (intensity 1 V; black traces). Recordings from 4 layers of the MOB are displayed. B, recordings with a 500 ms flash show that LFPs are not prolonged, illustrating the effect of synaptic depression in the first synapse of the MOB. Each trace was recorded from a different MOB slice. Similar recordings were obtained from 3 animals.

Similar articles

Cited by

References

    1. Alonso M, Lepousez G, Sebastien W, Bardy C, Gabellec MM, Torquet N & Lledo PM (2012). Activation of adult‐born neurons facilitates learning and memory. Nat Neurosci 15, 897–904. - PubMed
    1. Arenkiel BR, Peca J, Davison IG, Feliciano C, Deisseroth K, Augustine GJ, Ehlers MD & Feng G (2007). In vivo light‐induced activation of neural circuitry in transgenic mice expressing channelrhodopsin‐2. Neuron 54, 205–218. - PMC - PubMed
    1. Arlow RL, Foutz TJ & McIntyre CC (2013). Theoretical principles underlying optical stimulation of myelinated axons expressing channelrhodopsin‐2. Neuroscience 248, 541–551. - PMC - PubMed
    1. Atasoy D, Aponte Y, Su HH & Sternson SM (2008). A FLEX switch targets channelrhodopsin‐2 to multiple cell types for imaging and long‐range circuit mapping. J Neurosci 28, 7025–7030. - PMC - PubMed
    1. Banghart M, Borges K, Isacoff E, Trauner D & Kramer RH (2004). Light‐activated ion channels for remote control of neuronal firing. Nat Neurosci 7, 1381–1386. - PMC - PubMed

Publication types

LinkOut - more resources