

Lack of tRNA-i6A modification causes mitochondrial-like metabolic deficiency in S. pombe by limiting activity of cytosolic tRNATyr, not mito-tRNA
- PMID: 26857223
- PMCID: PMC4793213
- DOI: 10.1261/rna.054064.115
Lack of tRNA-i6A modification causes mitochondrial-like metabolic deficiency in S. pombe by limiting activity of cytosolic tRNATyr, not mito-tRNA
Abstract
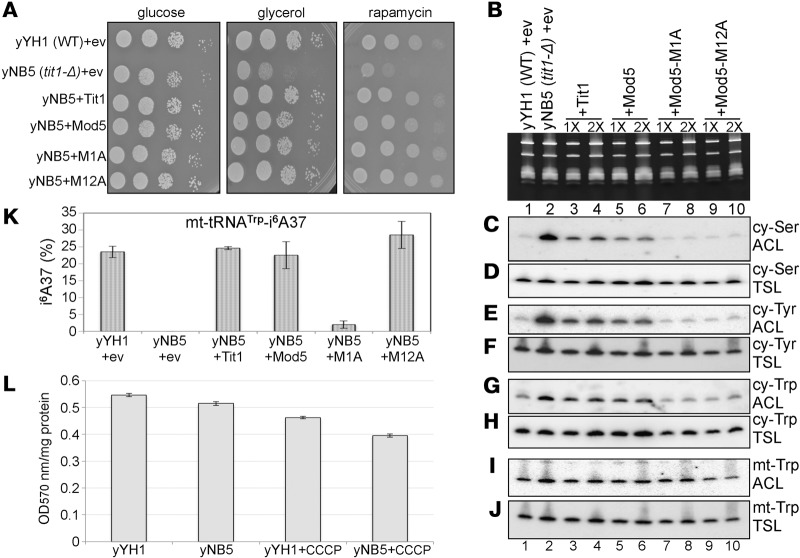
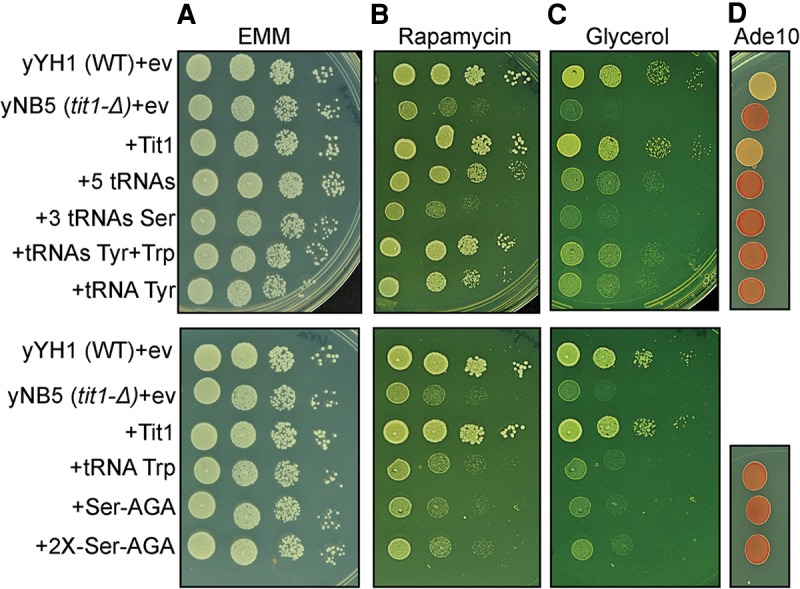
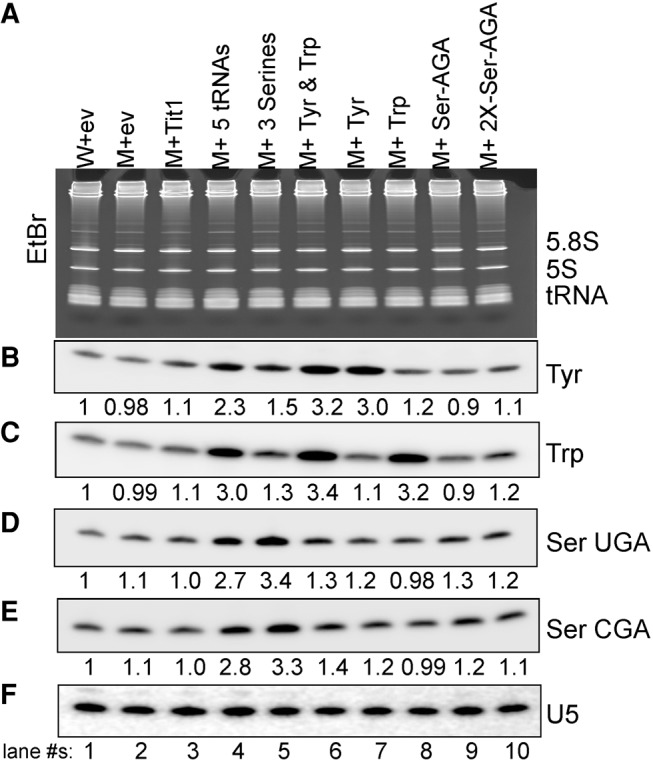
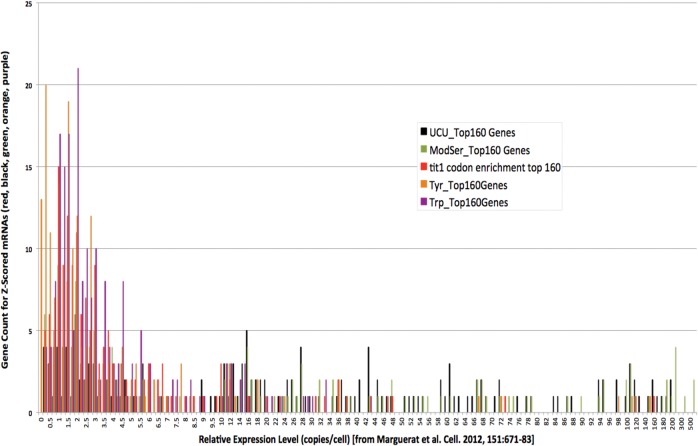
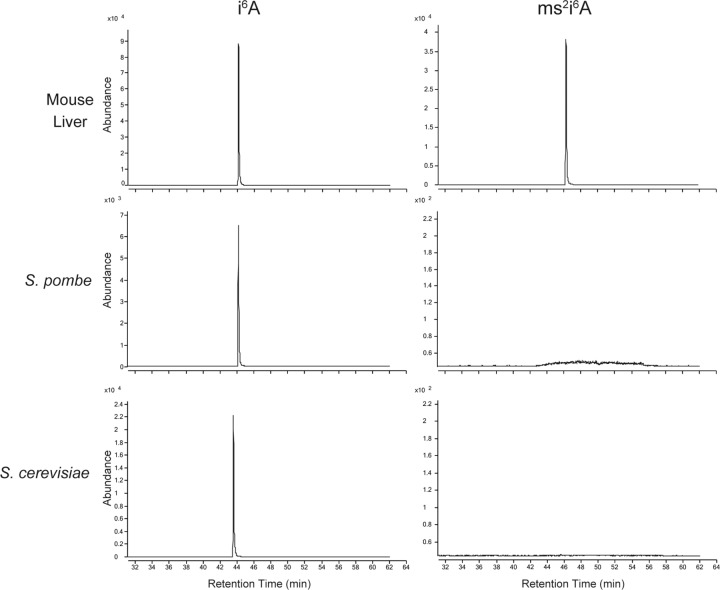
tRNA-isopentenyl transferases (IPTases) are highly conserved enzymes that form isopentenyl-N(6)-A37 (i6A37) on subsets of tRNAs, enhancing their translation activity. Nuclear-encoded IPTases modify select cytosolic (cy-) and mitochondrial (mt-) tRNAs. Mutation in human IPTase, TRIT1, causes disease phenotypes characteristic of mitochondrial translation deficiency due to mt-tRNA dysfunction. Deletion of the Schizosaccharomyces pombe IPTase (tit1-Δ) causes slow growth in glycerol, as well as in rapamycin, an inhibitor of TOR kinase that maintains metabolic homeostasis. Schizosaccharomyces pombe IPTase modifies three different cy-tRNAs(Ser) as well as cy-tRNA(Tyr), cy-tRNA(Trp), and mt-tRNA(Trp). We show that lower ATP levels in tit1-Δ relative to tit1(+) cells are also more decreased by an inhibitor of oxidative phosphorylation, indicative of mitochondrial dysfunction. Here we asked if the tit1-Δ phenotypes are due to hypomodification of cy-tRNA or mt-tRNA. A cytosol-specific IPTase that modifies cy-tRNA, but not mt-tRNA, fully rescues the tit1-Δ phenotypes. Moreover, overexpression of cy-tRNAs also rescues the phenotypes, and cy-tRNA(Tyr) alone substantially does so. Bioinformatics indicate that cy-tRNA(Tyr) is most limiting for codon demand in tit1-Δ cells and that the cytosolic mRNAs most loaded with Tyr codons encode carbon metabolilizing enzymes, many of which are known to localize to mitochondria. Thus, S. pombe i6A37 hypomodification-associated metabolic deficiency results from hypoactivity of cy-tRNA, mostly tRNA(Tyr), and unlike human TRIT1-deficiency does not impair mitochondrial translation due to mt-tRNA hypomodification. We discuss species-specific aspects of i6A37. Specifically relevant to mitochondria, we show that its hypermodified version, ms2i6A37 (2-methylthiolated), which occurs on certain mammalian mt-tRNAs (but not cy-tRNAs), is not found in yeast.
Keywords: mitochondria.
© 2016 Lamichhane et al.; Published by Cold Spring Harbor Laboratory Press for the RNA Society.
Figures
Similar articles
-
Targeting mitochondrial and cytosolic substrates of TRIT1 isopentenyltransferase: Specificity determinants and tRNA-i6A37 profiles.PLoS Genet. 2020 Apr 23;16(4):e1008330. doi: 10.1371/journal.pgen.1008330. eCollection 2020 Apr. PLoS Genet. 2020. PMID: 32324744 Free PMC article.
-
Lack of tRNA modification isopentenyl-A37 alters mRNA decoding and causes metabolic deficiencies in fission yeast.Mol Cell Biol. 2013 Aug;33(15):2918-29. doi: 10.1128/MCB.00278-13. Epub 2013 May 28. Mol Cell Biol. 2013. PMID: 23716598 Free PMC article.
-
Human cells have a limited set of tRNA anticodon loop substrates of the tRNA isopentenyltransferase TRIT1 tumor suppressor.Mol Cell Biol. 2013 Dec;33(24):4900-8. doi: 10.1128/MCB.01041-13. Epub 2013 Oct 14. Mol Cell Biol. 2013. PMID: 24126054 Free PMC article.
-
Sulfur Modifications of the Wobble U34 in tRNAs and their Intracellular Localization in Eukaryotic Cells.Biomolecules. 2017 Feb 18;7(1):17. doi: 10.3390/biom7010017. Biomolecules. 2017. PMID: 28218716 Free PMC article. Review.
-
The modified base isopentenyladenosine and its derivatives in tRNA.RNA Biol. 2017 Sep 2;14(9):1197-1208. doi: 10.1080/15476286.2017.1294309. Epub 2017 Feb 17. RNA Biol. 2017. PMID: 28277934 Free PMC article. Review.
Cited by
-
Coordination of RNA modifications in the brain and beyond.Mol Psychiatry. 2023 Jul;28(7):2737-2749. doi: 10.1038/s41380-023-02083-2. Epub 2023 May 3. Mol Psychiatry. 2023. PMID: 37138184 Free PMC article. Review.
-
Metabolomic Reprogramming Induced by Benzo[a]pyene in Skin Keratinocytes and Protective Effects of Glutathione Amino Acid Precursors.J Cosmet Dermatol. 2025 Apr;24(4):e70168. doi: 10.1111/jocd.70168. J Cosmet Dermatol. 2025. PMID: 40208244 Free PMC article.
-
Targeting mitochondrial and cytosolic substrates of TRIT1 isopentenyltransferase: Specificity determinants and tRNA-i6A37 profiles.PLoS Genet. 2020 Apr 23;16(4):e1008330. doi: 10.1371/journal.pgen.1008330. eCollection 2020 Apr. PLoS Genet. 2020. PMID: 32324744 Free PMC article.
-
Protein folding and tRNA biology.Biophys Rev. 2017 Oct;9(5):573-588. doi: 10.1007/s12551-017-0322-2. Epub 2017 Sep 24. Biophys Rev. 2017. PMID: 28944442 Free PMC article. Review.
-
Hypomodified tRNA in evolutionarily distant yeasts can trigger rapid tRNA decay to activate the general amino acid control response, but with different consequences.PLoS Genet. 2020 Aug 25;16(8):e1008893. doi: 10.1371/journal.pgen.1008893. eCollection 2020 Aug. PLoS Genet. 2020. PMID: 32841241 Free PMC article.
References
Publication types
MeSH terms
Substances
Grants and funding
LinkOut - more resources
Full Text Sources
Other Literature Sources