

Genetic variation among 82 pharmacogenes: The PGRNseq data from the eMERGE network
- PMID: 26857349
- PMCID: PMC5010878
- DOI: 10.1002/cpt.350
Genetic variation among 82 pharmacogenes: The PGRNseq data from the eMERGE network
Abstract
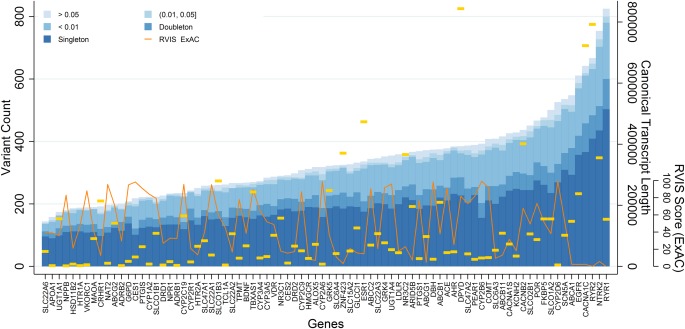
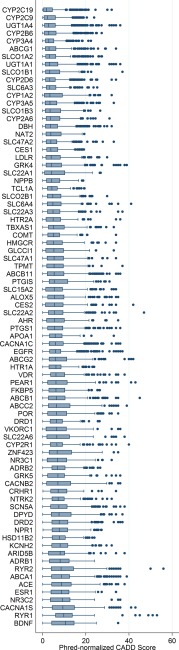
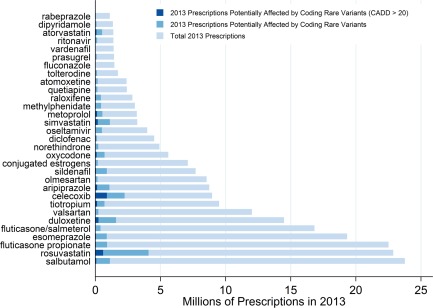
Genetic variation can affect drug response in multiple ways, although it remains unclear how rare genetic variants affect drug response. The electronic Medical Records and Genomics (eMERGE) Network, collaborating with the Pharmacogenomics Research Network, began eMERGE-PGx, a targeted sequencing study to assess genetic variation in 82 pharmacogenes critical for implementation of "precision medicine." The February 2015 eMERGE-PGx data release includes sequence-derived data from ∼5,000 clinical subjects. We present the variant frequency spectrum categorized by variant type, ancestry, and predicted function. We found 95.12% of genes have variants with a scaled Combined Annotation-Dependent Depletion score above 20, and 96.19% of all samples had one or more Clinical Pharmacogenetics Implementation Consortium Level A actionable variants. These data highlight the distribution and scope of genetic variation in relevant pharmacogenes, identifying challenges associated with implementing clinical sequencing for drug treatment at a broader level, underscoring the importance for multifaceted research in the execution of precision medicine.
© 2016 The Authors. Clinical Pharmacology & Therapeutics published by Wiley Periodicals, Inc. on behalf of American Society for Clinical Pharmacology and Therapeutics.
Figures
Similar articles
-
Design and anticipated outcomes of the eMERGE-PGx project: a multicenter pilot for preemptive pharmacogenomics in electronic health record systems.Clin Pharmacol Ther. 2014 Oct;96(4):482-9. doi: 10.1038/clpt.2014.137. Epub 2014 Jun 24. Clin Pharmacol Ther. 2014. PMID: 24960519 Free PMC article.
-
The CLIPMERGE PGx Program: clinical implementation of personalized medicine through electronic health records and genomics-pharmacogenomics.Clin Pharmacol Ther. 2013 Aug;94(2):214-7. doi: 10.1038/clpt.2013.72. Epub 2013 Apr 3. Clin Pharmacol Ther. 2013. PMID: 23588317 Free PMC article. No abstract available.
-
Genetic Variation among Pharmacogenes in the Sardinian Population.Int J Mol Sci. 2022 Sep 2;23(17):10058. doi: 10.3390/ijms231710058. Int J Mol Sci. 2022. PMID: 36077453 Free PMC article.
-
Pharmacogenes (PGx-genes): Current understanding and future directions.Gene. 2019 Nov 15;718:144050. doi: 10.1016/j.gene.2019.144050. Epub 2019 Aug 16. Gene. 2019. PMID: 31425740 Review.
-
Clinical pharmacogenomics testing in the era of next generation sequencing: challenges and opportunities for precision medicine.Expert Rev Mol Diagn. 2018 May;18(5):411-421. doi: 10.1080/14737159.2018.1461561. Epub 2018 Apr 23. Expert Rev Mol Diagn. 2018. PMID: 29634383 Review.
Cited by
-
Knowledge and attitudes on implementing cardiovascular pharmacogenomic testing.Clin Transl Sci. 2024 Mar;17(3):e13737. doi: 10.1111/cts.13737. Clin Transl Sci. 2024. PMID: 38421234 Free PMC article.
-
Structural variation at the CYP2C locus: Characterization of deletion and duplication alleles.Hum Mutat. 2019 Nov;40(11):e37-e51. doi: 10.1002/humu.23855. Hum Mutat. 2019. PMID: 31260137 Free PMC article.
-
Development of the PGx-Passport: A Panel of Actionable Germline Genetic Variants for Pre-Emptive Pharmacogenetic Testing.Clin Pharmacol Ther. 2019 Oct;106(4):866-873. doi: 10.1002/cpt.1489. Epub 2019 Jun 12. Clin Pharmacol Ther. 2019. PMID: 31038729 Free PMC article.
-
Research Directions in the Clinical Implementation of Pharmacogenomics: An Overview of US Programs and Projects.Clin Pharmacol Ther. 2018 May;103(5):778-786. doi: 10.1002/cpt.1048. Epub 2018 Mar 30. Clin Pharmacol Ther. 2018. PMID: 29460415 Free PMC article. Review.
-
Pharmacogenetic Testing: A Tool for Personalized Drug Therapy Optimization.Pharmaceutics. 2020 Dec 19;12(12):1240. doi: 10.3390/pharmaceutics12121240. Pharmaceutics. 2020. PMID: 33352764 Free PMC article. Review.
References
Publication types
MeSH terms
Grants and funding
- U19 GM061388/GM/NIGMS NIH HHS/United States
- U01 HG006385/HG/NHGRI NIH HHS/United States
- U01 HG006375/HG/NHGRI NIH HHS/United States
- U01 HG004438/HG/NHGRI NIH HHS/United States
- UL1 TR000427/TR/NCATS NIH HHS/United States
- R01 AG034676/AG/NIA NIH HHS/United States
- T32 GM007454/GM/NIGMS NIH HHS/United States
- U01 HG008657/HG/NHGRI NIH HHS/United States
- U01 HG006382/HG/NHGRI NIH HHS/United States
- U19 HL065962/HL/NHLBI NIH HHS/United States
- R01 GM028157/GM/NIGMS NIH HHS/United States
- U01 GM061388/GM/NIGMS NIH HHS/United States
- U01 HG006389/HG/NHGRI NIH HHS/United States
- U01 HG008672/HG/NHGRI NIH HHS/United States
- UL1 TR001422/TR/NCATS NIH HHS/United States
- U01 HG008684/HG/NHGRI NIH HHS/United States
- U01 HG006828/HG/NHGRI NIH HHS/United States
- U01 HG006380/HG/NHGRI NIH HHS/United States
- U01 HG008666/HG/NHGRI NIH HHS/United States
- U01 HG005137/HG/NHGRI NIH HHS/United States
- U01 HG006388/HG/NHGRI NIH HHS/United States
- U01 HG006378/HG/NHGRI NIH HHS/United States
- R01 CA138461/CA/NCI NIH HHS/United States
- U01 HG008673/HG/NHGRI NIH HHS/United States
- U01 HG006379/HG/NHGRI NIH HHS/United States
- U01 HG006830/HG/NHGRI NIH HHS/United States
LinkOut - more resources
Full Text Sources
Other Literature Sources
