. 2016 Feb 8;108(5):djv387.
doi: 10.1093/jnci/djv387. Print 2016 May.

Relevance of Sp Binding Site Polymorphism in WWOX for Treatment Outcome in Pancreatic Cancer

Affiliations

Relevance of Sp Binding Site Polymorphism in WWOX for Treatment Outcome in Pancreatic Cancer

Markus A Schirmer et al. J Natl Cancer Inst. .

Abstract

Background: A genome-wide association study (GWAS) suggested inherited genetic single-nucleotide polymorphisms (SNPs) affecting overall survival (OS) in advanced pancreatic cancer. To identify robust clinical biomarkers, we tested the strongest reported candidate loci in an independent patient cohort, assessed cellular drug sensitivity, and evaluated molecular effects.

Methods: This study comprised 381 patients with histologically verified pancreatic ductal adenocarcinoma treated with gemcitabine-based chemotherapy. The primary outcome was the relationship between germline polymorphisms and OS. Functional assays addressed pharmacological dose-response effects in lymphoblastoid cell lines (LCLs) and pancreatic cancer cell lines (including upon RNAi), gene expression analyses, and allele-specific transcription factor binding. All statistical tests were two-sided.

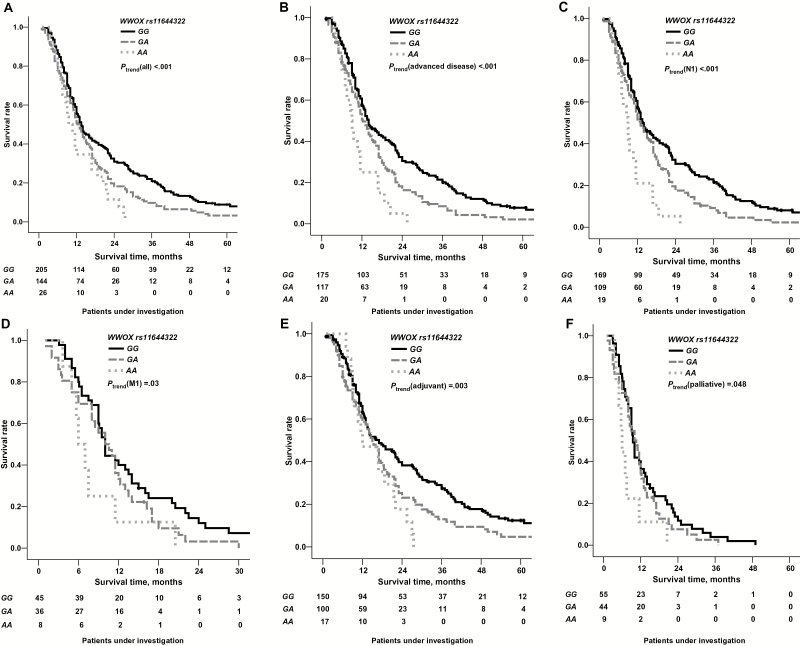
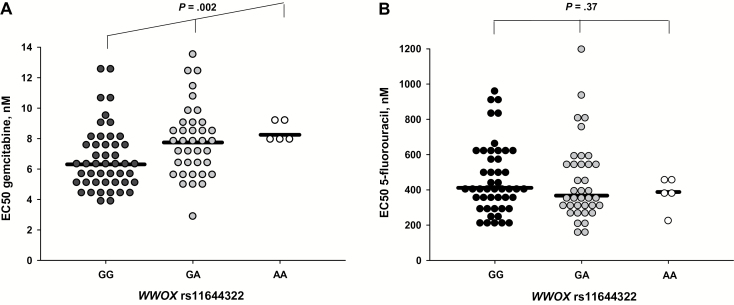
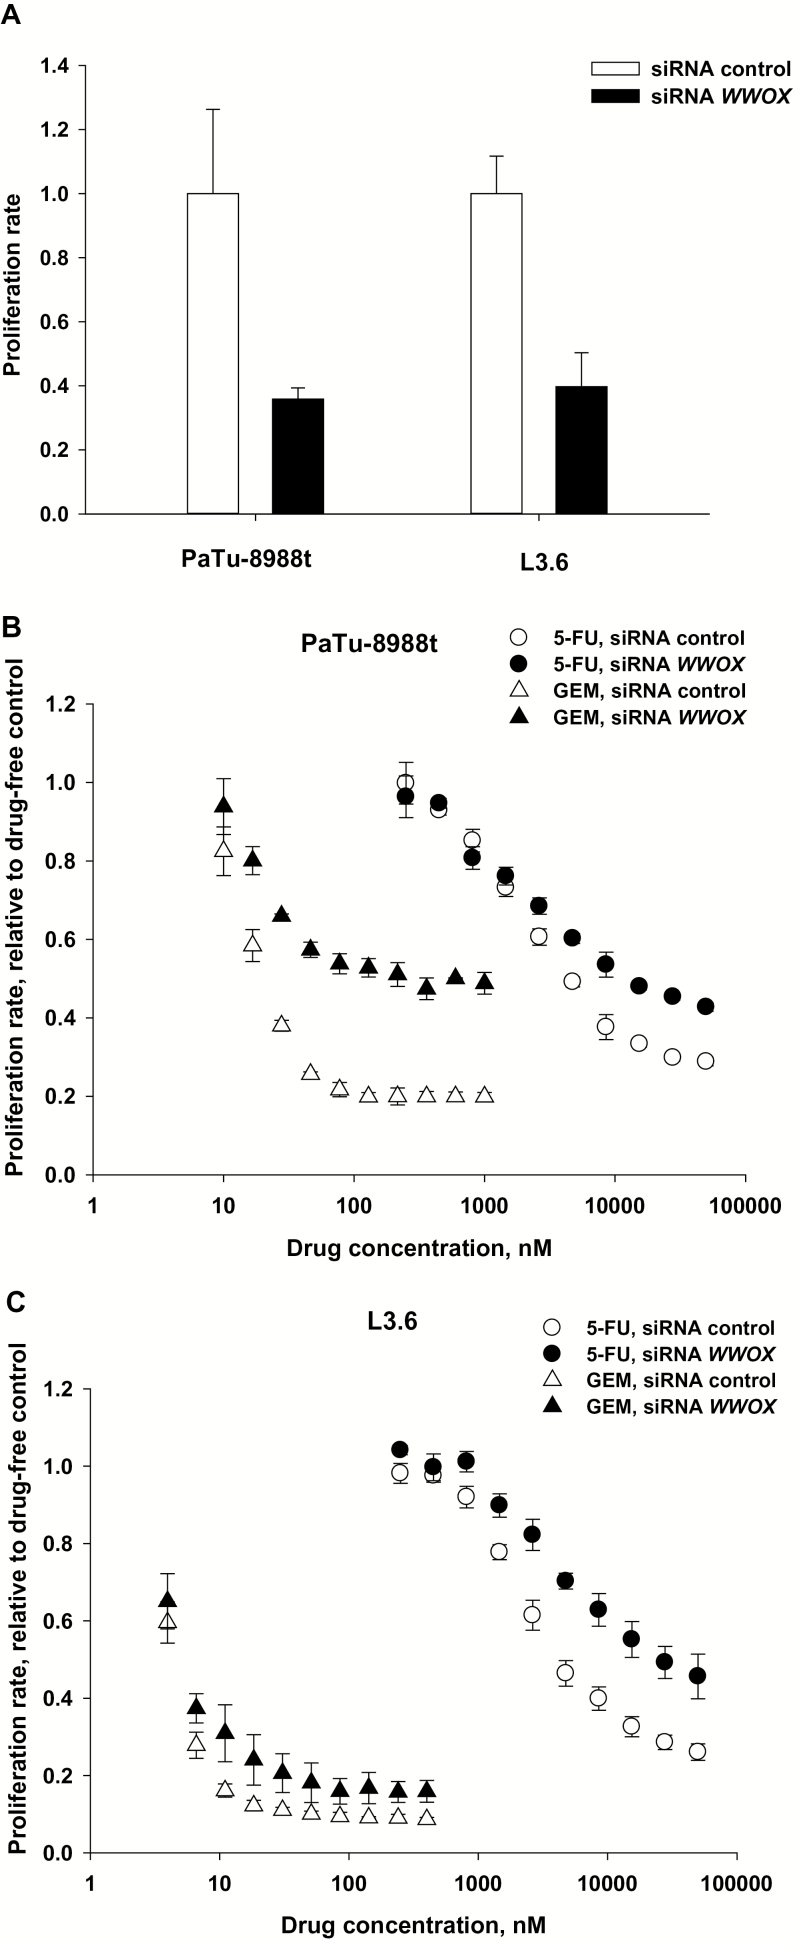
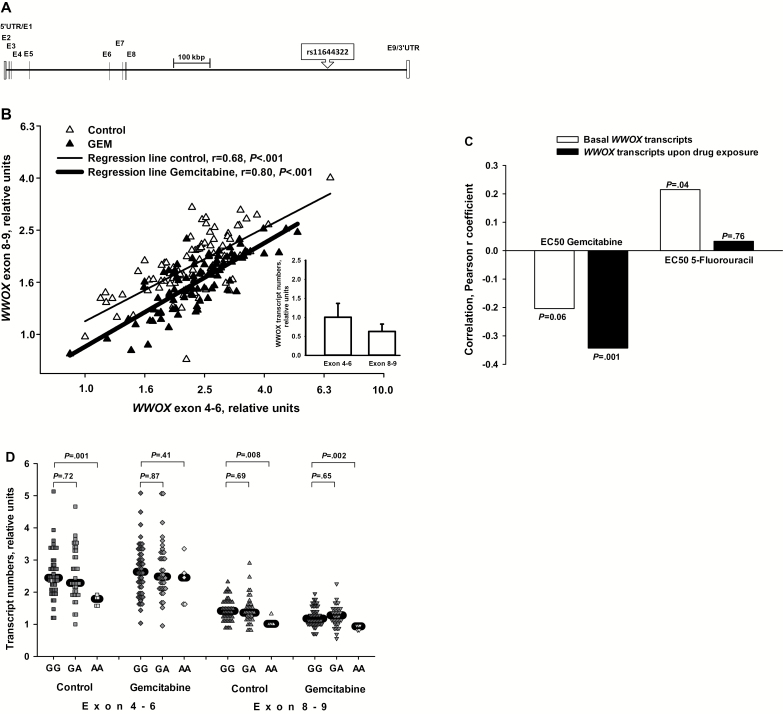
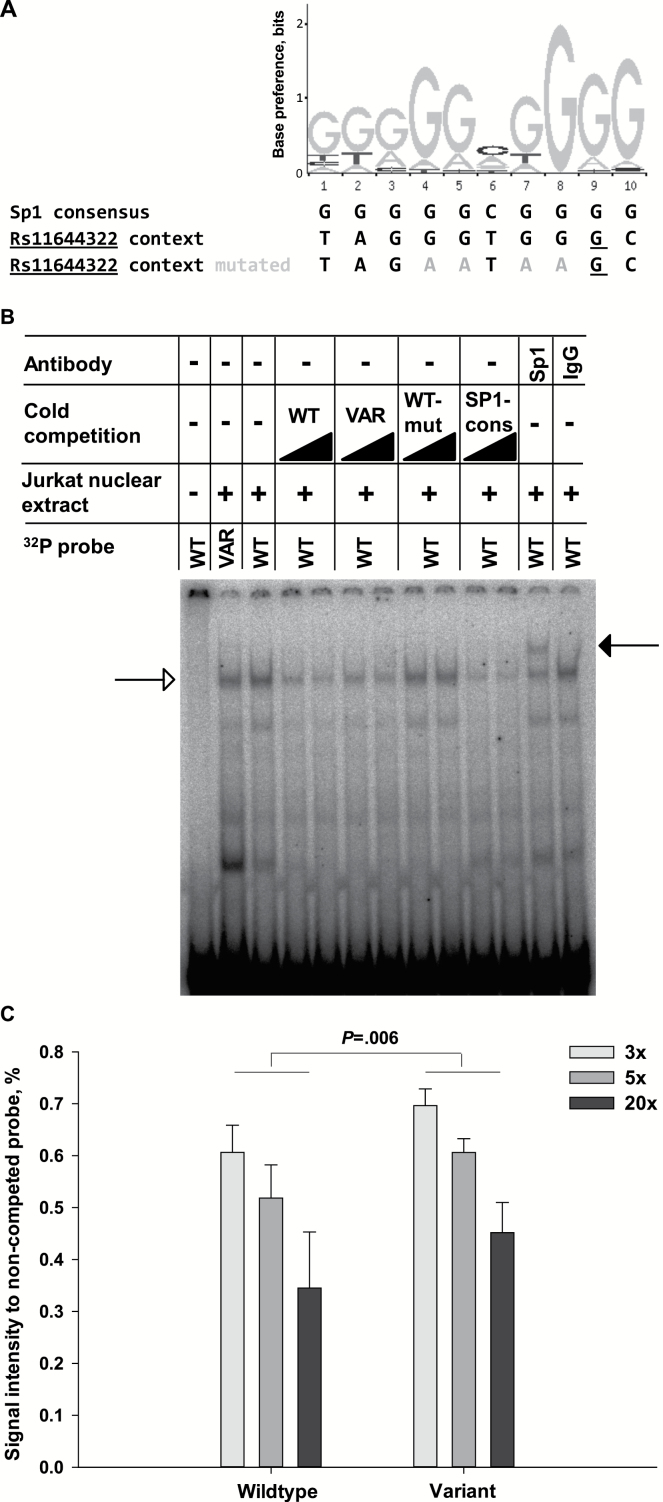
Results: The A allele (26% in Caucasians) at SNP rs11644322 in the putative tumor suppressor gene WWOX conferred worse prognosis. Median OS was 14 months (95% confidence interval [CI] = 12 to 15 months), 13 months (95% CI = 11 to 15 months), and nine months (95% CI = 7 to 12 months) for the GG, GA, and AA genotypes, respectively (P trend < .001 for trend in univariate log-rank assuming a codominant mode of inheritance; advanced disease subgroup P trend < .001). Mean OS was 25 months (95% CI = 21 to 29 months), 19 months (95% CI = 15 to 22 months), and 13 months (95% CI = 10 to 16 months), respectively. This effect held true after adjustment for age, performance status according to Eastern Cooperative Oncology Group classification, TNM, grading, and resection status and was comparable with the strongest established prognostic factors in multivariable analysis. Consistently, reduced responsiveness to gemcitabine, but not 5-fluorouracil, along with lower WWOX expression was demonstrated in LCLs harboring the AA genotype. Likewise, RNAi-mediated WWOX knockdown in pancreatic cancer cells confirmed differential cytostatic drug sensitivity. In electrophoretic mobility shift assays, the A allele exhibited weaker binding of Sp family members Sp1/Sp3.

Conclusions: WWOX rs11644322 represents a major predictive factor in gemcitabine-treated pancreatic cancer. Decreased WWOX expression may interfere with gemcitabine sensitivity, and allele-specific binding at rs11644332 might be a causative molecular mechanism behind the observed clinical associations.


Figures

Figure 1.
Figure 1.
Impact of WWOX rs11644322 on clinical outcome. Overall survival of 381 pancreatic cancer patients treated with a gemcitabine-containing regimen in dependence on the genotype configuration of WWOX rs11644322. A) The entire patient cohort. B) The subgroup of advanced disease stage (T4 and/or N1 and/or M1). C) Lymph node-positive patients. D) Patients with proven distant metastasis. E) Patients with adjuvant treatment intent. F) Patients with palliative treatment intent. The given P values indicate univariate testing by unadjusted log-rank test. Patient numbers under investigation are specified in 12-month intervals, for distant metastasis in six-month intervals. Genotyping for six patients at this position failed, leaving 375 assessable (see Supplementary Table 2, available online). All statistical tests were two-sided.
Figure 2.
Figure 2.
Impact of WWOX rs11644322 on cellular drug sensitivity of lymphoblastoid cell lines. A) EC50 values representing cellular sensitivity towards gemcitabine in relation to the three genotype configurations at rs11466322. Out of 89 LCLs, 47 harbored GG genotype, 37 GA, and five AA. EC50 data for proliferation inhibition were calculated from seven serial gemcitabine dilutions (1.9–76.0nM) with respect to a drug-free control by a three-parameter Gompertz model (details in the Supplementary Methods, available online). Statistical differences were assessed by the nonparametric Jonckheere-Terpstra trend test. B) Respective data for 5-fluorouracil. The samples used were exactly identical to those assessed for gemcitabine drug sensitivity (A). Eight concentrations of 5-fluorouracil, ranging from 75 to 385 000nM, were analyzed with respect to a drug-free control. The median value for each group is highlighted by a horizontal black line. All statistical tests were two-sided.
Figure 3.
Figure 3.
WWOX knockdown. A) Effects of WWOX knockdown by siRNA on basal proliferation rates of the two adenoductal pancreatic cancer cell lines PaTu-8988t and L3.6. Cells were transfected either with a panel of four siRNAs intended to target WWOX or with a scrambled panel of unspecific siRNAs as control. Technical details are described in the Supplementary Methods (available online). Data of this panel refer to drug-free conditions. The bars represent means of three independent experiments, with the errors indicating one standard deviation. B and C) Consequences of WWOX knockdown on cytostatic drug sensitivity. B) Displays data for the PaTu-8988t, and (C) for the L3.6 cell line. Drug concentrations are denoted in a log10-scale. Data for gemcitabine are shown as triangles (open ones for control siRNA, filled ones for siRNA against WWOX), for 5-FU analogously as circles. For each transfection condition and each drug, the proliferation rate for a drug-free control was set to 1.0, to which each drug concentration was referred. Data represent means of three independent experimental series, with one standard deviation indicated as error symbols. Within each series, each single condition was assayed in quadruplicates, of which median values were taken for analysis.
Figure 4.
Figure 4.
Gene expression analyses. A) Genetic architecture at the WWOX locus. The coding region encompasses nine exons, with the first and the last one flanked by a 5′- and 3′-untranslated region (UTR), respectively. The exons are depicted as vertical lines. In the scheme, the relationships of physical sizes and distances are retained. The position of the index SNP rs11644322 is denoted. B) Expression of the last exon in relation to that of the core WWOX coding region. The mRNA expression of the terminal exon 9 (captured by an exon 8/exon 9-spanning primer pair) was compared with the major part of the coding region (represented by a primer pair spanning exons 4–6). The graph summarizes the data obtained in 88 lymphoblastoid cell lines (for one cell line, reverse transcription failed) treated either with cell culture medium only (baseline) or with 30nM gemcitabine at 37°C for 24 hours. The scatter plot illustrates expression correlation between regions 4–6 and 8–9. Both axes are displayed in log10-scale, for which normal distributions of the data could be assumed. The respective regression lines with the Pearson correlation coefficient r are indicated. All expression data were referred to the cell line with the lowest transcript numbers for exon 4–6 under basal conditions (set to “1”). The lower right insert illustrates, under baseline conditions and using cloned full-length WWOX cDNA as reference, the transcript numbers of the last WWOX exon in relation to those of the core coding region, of which the mean of the entire LCL cohort was set to “1” (error symbols denote one standard deviation). C) Correlation of WWOX transcripts with EC50 values of gemcitabine and 5-fluorouracil. Data are based on the same 88 LCLs as in Figure 4B and refer to WWOX transcripts of the exon 4–6 region (very similar for exon 8–9, not shown). Transcript numbers were normalized to the weighted mean of five reference genes (36b4, B2MG, GAPDH, HPRT1, and UBC). P values are according to the Pearson correlation coefficient r, which is displayed on the y-axis. Note that a negative correlation indicates higher WWOX expression along with lower EC50 values, ie, increased sensitivity toward cytotoxic effects. Gemcitabine was administered at 30nM and 5-fluorouracil at 3 µM for 24 hours at 37°C prior to RNA harvesting. These drug concentrations were chosen about five-fold higher than mean EC50 values observed upon 72 hours of drug exposure (Figure 2). D) Impact of rs11644322 SNP on WWOX regional transcription (exon 4–6/8–9). The left side of the image refers to the central coding region (exon 4–6), the right to that of exon 8–9, each for baseline conditions and upon 30nM gemcitabine incubation for 24 hours at 37°C. Shown data refer to the same panel of 89 LCLs as in Figure 2A. The median value for each group is highlighted by a horizontal black line. Statistical differences between two groups were assessed by the nonparametric Mann-Whitney U test. The lower line of P values refers to testing between GG and GA genotype, the upper one between GG and AA configuration. All statistical tests were two-sided.
Figure 5.
Figure 5.
Transcription factor binding motif and identity of binding protein. A) Composition of the SP1_Q6 (systematic name M9525) binding motif. The plot was derived from JASPAR database (29). Out of the two models annotated for Sp1 in JASPAR, SP1_Q6 was identified corresponding to the sequence context of rs11644322 according to a matrix-derived consensus sequence (www.telis.ucla.edu/TFBM). The y-axis highlights the preference of a specific base in bits ranging from 0 (no base preferred) to 2 (only one base preferred). The base positions in the motif are ordered from 1 to 10 on the x-axis. Beneath the plot, the consensus sequence of SP1_Q6 is displayed in the first row. The second row represents the sequence context of WWOX rs11644322 with wild-type G allele configuration (underlined). In the third line, this sequence context was mutated at four bases (shaded in gray), particularly prominent in the SP1_Q6 motif. B) Representative EMSA plot for assessing transcription factor binding of nuclear protein extracts from Jurkat cells at WWOX rs11644322. Lane 1 indicates the negative control without nuclear proteins. Lanes 2 and 3 illustrate 32P-labeled probes containing the variant A and the wild-type G allele, respectively. In lanes 4–7, the interaction between nuclear proteins and the G wild-type allele-containing probe was competed with each three-fold and five-fold excess of nonradioactive wild-type and variant allele-containing probes. Analogously, competition with the wild-type rs11644322 probe mutated at the four most crucial bases of the Sp1 binding motif, last row in (A), is shown in lanes 8–9 and with the consensus sequence for Sp1, first row in (A), in lanes 10–11. Supershift with the Sp1 antibody 1C6 is illustrated in lane 12, with IgG control in lane 13. The arrow with open head at the left indicates the bands of interaction between nuclear proteins and the radio-labeled probes, and that with filled head at the right the supershifted complex. Technical details are provided in the Supplementary Methods (available online). C) Quantification of cold competition using nuclear extracts of the pancreatic cancer cell line MIA-PaCa-2. Signal intensities of the noncompeted 32P-labeled probe with wild-type G allele at the WWOX rs11644322 site were set at 1.0. The nonlabeled probes (containing the wild-type G or variant A allele) were applied with three-, five-, and 20-fold excess with respect to the 32P-labeled probe with the G allele. For each bar, the mean value of three independent binding reactions is depicted, with the errors indicating one standard deviation. Statistical significance was tested by a linear regression model, with the excess of the nonradioactive probes and the allelic configuration at rs11644322 as independent variables. The indicated P value denotes the impact of rs11644322 in this model. All statistical tests were two-sided.

Comment in

Similar articles

Cited by

References

    1. Siegel R, Naishadham D, Jemal A. Cancer statistics, 2013. CA Cancer J Clin. 2013;63 (1):11–30. - PubMed
    1. Vincent A, Herman J, Schulick R, Hruban RH, Goggins M. Pancreatic cancer. Lancet. 2011;378(9791):607–620. - PMC - PubMed
    1. Burris HA, 3rd, Moore MJ, Andersen J, et al. Improvements in survival and clinical benefit with gemcitabine as first-line therapy for patients with advanced pancreas cancer: a randomized trial. J Clin Oncol. 1997;15 (6):2403–2413. - PubMed
    1. Neoptolemos JP, Stocken DD, Bassi C, et al. Adjuvant chemotherapy with fluorouracil plus folinic acid vs gemcitabine following pancreatic cancer resection: a randomized controlled trial. JAMA. 2010;304 (10):1073–1081. - PubMed
    1. Innocenti F, Owzar K, Cox NL, et al. A genome-wide association study of overall survival in pancreatic cancer patients treated with gemcitabine in CALGB 80303. Clin Cancer Res. 2012;18 (2):577–584. - PMC - PubMed

Publication types

MeSH terms