. 2016 Feb 15:291:18-27.
doi: 10.1016/j.jneuroim.2015.12.004. Epub 2015 Dec 12.

Suppression of microglia activation after hypoxia-ischemia results in age-dependent improvements in neurologic injury

Affiliations

Suppression of microglia activation after hypoxia-ischemia results in age-dependent improvements in neurologic injury

Ulas Cikla et al. J Neuroimmunol. .

Abstract

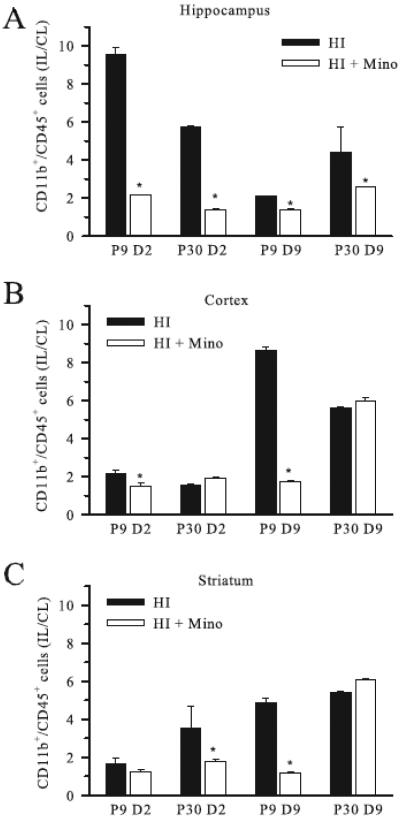
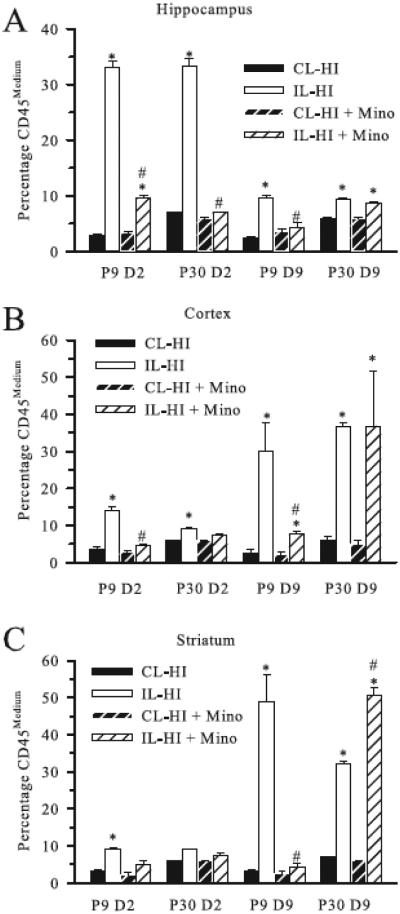
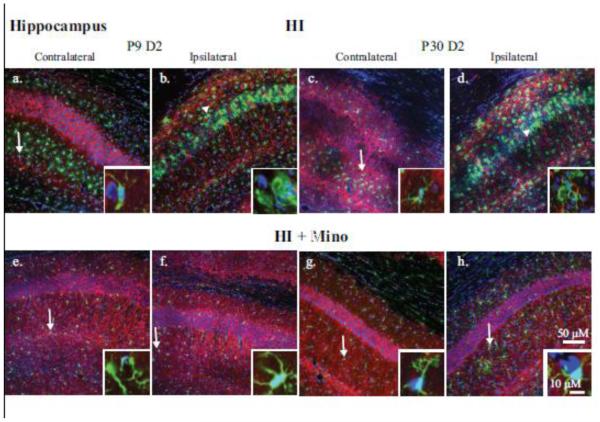
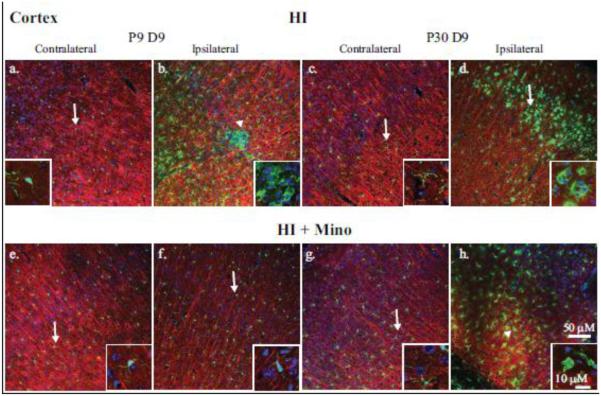
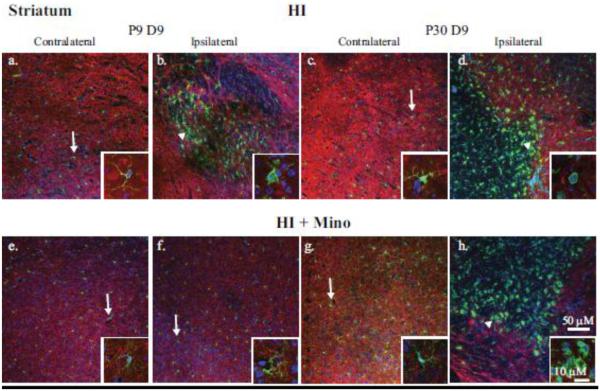
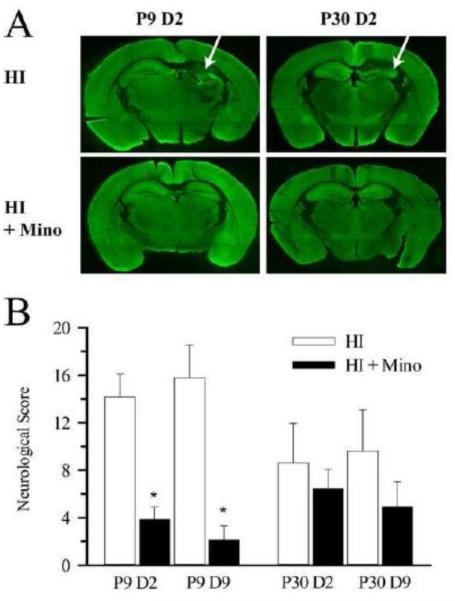
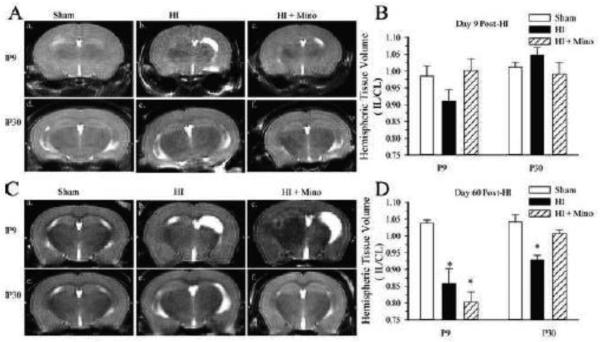
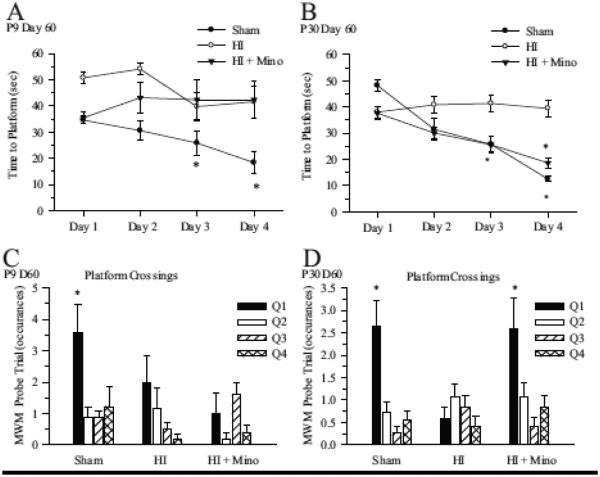
We previously found increased microglial proliferation and pro-inflammatory cytokine release in infant mice compared to juvenile mice after hypoxia-ischemia (HI). The aim of the current study was to assess for differences in the effect of microglial suppression on HI-induced brain injury in infant and juvenile mice. HI was induced in neonatal (P9) and juvenile (P30) mice and minocycline or vehicle was administered at 2h and 24h post-HI. P9 minocycline-treated mice demonstrated early but transient improvements in neurologic injury, while P30 minocycline-treated mice demonstrated sustained improvements in cerebral atrophy and Morris Water Maze performance at 60days post-HI.

Keywords: Cerebral atrophy; Microglia; Neonatal hypoxia–ischemia; Neuroinflammation.


Figures

Figure 1
Figure 1. Effect of minocycline treatment on regional microglial counts post-HI
The number of CD11b+/CD45+ cells in ipsilateral hippocampus (A) cortex (B), and striatum (C) relative to the corresponding contralateral brain region (IL/CL) were determined using flow cytometry at either day 2 (D2) or day 9 (D9) post-HI in neonatal (P9) and juvenile (P30) mice treated with minocycline or vehicle. Data are mean ± sem. * = p < 0.05 vs untreated. n = 3 samples.
Figure 2
Figure 2. Effect of minocycline treatment on microglial activation post-HI
The percentage of CD11b+/CD45+ cell population demonstrating CD45medium expression (activated microglia) in contralateral (CL) and ipsilateral (IL) hippocampus (A) cortex (B), and striatum (C) at day 2 (D2) and day 9 (D9) post-HI are shown for P9 and P30 mice treated with minocycline or vehicle. Data are mean ± sem. * = p < 0.05 vs corresponding CL, # = p < 0.05 vs corresponding untreated IL. n = 3 samples.
Figure 3
Figure 3. Immunohistological analysis of microglial response in the CA1 hippocampus
Double immunohistological staining for Iba1 (green) and MAP2 (red) proteins in the CA1 region of the hippocampus is shown. Nuclei were stained with DAPI (blue). Upper panels: the contralateral (a, c) and ipsilateral (b, d) hippocampi of P9 (a, b) and P30 (c, d) brains at 2 days post-HI are compared. Lower panels: the contralateral (e, g) and ipsilateral (f, h) hippocampi of P9 (e, f) and P30 (g, h) brains 2 days post-HI from minocycline-treated animals. Insets: magnification (240X) of representative microglia demonstrating either ramified (arrow) or amoeboid (arrowhead) morphology.
Figure 4
Figure 4. Immunohistological analysis of microglial response in the cortex
Double immunohistological staining for Iba1 (green) and MAP2 (red) proteins were examined in the cortex. Nuclei were stained with DAPI (blue). Upper panels: the contralateral (a, c) and ipsilateral (b, d) cortex of P9 (a, b) and P30 (c, d) brains at 9 days post-HI are compared. Lower panels: the contralateral (e, g) and ipsilateral (f, h) cortex of P9 (e, f) and P30 (g, h) brains at 9 days post-HI from minocycline-treated mice are compared. Insets: magnification (240X) of representative microglia demonstrating either ramified (arrow) or amoeboid (arrowhead) morphology.
Figure 5
Figure 5. Immunohistological analysis of microglial response in the striatum
Double immunohistological staining for Iba1 (green) and MAP2 (red) proteins were examined in the striatum. Nuclei were stained with DAPI (blue). Upper panels: the contralateral (a, c) and ipsilateral (b, d) sides of P9 (a, b) and P30 (c, d) brains 9 days post-HI are compared. Lower panels: the contralateral (e, g) and ipsilateral (f, h) sides of P9 (e, f) and P30 (g, h) brains 9 days post-HI with minocycline treatment are compared. Insets: magnification (240X) of representative microglia demonstrating either ramified (arrow) or amoeboid (arrowhead) morphology.
Figure 6
Figure 6. Effect of minocycline treatment on neurological damage at day 2 and day 9 post-HI.
A. Representative whole brain slices from P9 and P30 brains at day 2 post-HI with and without minocycline treatment are shown. Arrow: loss of hippocampal volume and MAP2 staining in the non-treated mice. B. Summary of neurological damage scores in P9 and P30 brains at day 2 (D2) and day 9 (D9) post-HI with and without minocycline treatment. * = p < 0.05 vs corresponding untreated. n = 8-14.
Figure 7
Figure 7. Effect of minocycline treatment on hemispheric volume post-HI
T2-weighted images were collected in P9 and P30 mice at day 9 and day 60 post-HI. A. Representative T2-weighted images from P9 Sham (a.), P9 HI (b.), P9 HI + minocycline-treated (c.), and P30 Sham (d.), P30 HI (e.), P30 HI + minocycline-treated (f.) at 9 days post-HI. B. Summary figure of T2-weighted ipsilateral hemispheric volumes normalized to the contralateral hemisphere (IL/CL) from P9 and P30 mice with and without minocycline treatment at day 9 post-HI. C. Representative T2-weighted images from P9 Sham (a.), P9 HI (b.), P9 HI + minocycline-treated (c.) and P30 Sham (d.), P30 HI (e.), P30 HI + minocycline-treated (f.) at 60 days post-HI. D. Summary figure of T2-weighted IL/CL hemispheric volumes from P9 and P30 mice with and without minocycline treatment at day 60 post-HI. Data are mean ± sem. * p<0.05 vs. sham, n = 5-8 treated and controls, 4-9 shams.
Figure 8
Figure 8. Effect of minocycline treatment on memory and learning at day 60 post-HI
Mice were subjected to HI at P9 or P30 with and without minocycline treatment and Morris water maze MWM testing was performed at 60 days post-HI. A. Summary figure of time to platform over the four days of training in sham, HI and HI + minocycline-treated P9 mice. Data are mean ± sem. n = 5-9 * p < 0.05 vs Day 1 value. B. Summary figure of time to platform over the four days of training in sham, HI and HI + minocycline-treated P30 mice. Data are mean ± sem. n = 11-12. * p < 0.05 vs Day 1 value. C. Summary of platform crossings for each quadrant in P9 sham, HI and HI + minocycline-treated mice. Q1 = Training Quadrant; *p<0.05, n=5-9. D. Summary of platform crossings for each quadrant in P30 sham, HI and HI + minocycline-treated mice. Q1 = Training Quadrant; *p<0.05, n=11-12.

References

    1. Biran V, Joly LM, Heron A, Vernet A, Vega C, Mariani J, Renolleau S, Charriaut-Marlangue C. Glial activation in white matter following ischemia in the neonatal P7 rat brain. Exp. Neurol. 2006;199:103–12. - PubMed
    1. Bonestroo HJ, Nijboer CH, van Velthoven CT, Kavelaars A, Hack CE, van Bel F, Heijnen CJ. Cerebral and hepatic inflammatory response after neonatal hypoxia-ischemia in newborn rats. Dev. Neurosci. 2013;35:197–211. - PubMed
    1. Buller KM, Carty ML, Reinebrant HE, Wixey JA. Minocycline: a neuroprotective agent for hypoxic-ischemic brain injury in the neonate? J. Neurosci. Res. 2009;87:599–608. - PubMed
    1. Butovsky O, Jedrychowski MP, Moore CS, Cialic R, Lanser AJ, Gabriely G, Koeglsperger T, Dake B, Wu PM, Doykan CE, Fanek Z, Liu L, Chen Z, Rothstein JD, Ransohoff RM, Gygi SP, Antel JP, Weiner HL. Identification of a unique TGF-beta-dependent molecular and functional signature in microglia. Nat Neurosci. 2014;17:131–43. - PMC - PubMed
    1. Campanella M, Sciorati C, Tarozzo G, Beltramo M. Flow cytometric analysis of inflammatory cells in ischemic rat brain. Stroke. 2002;33:586–92. - PubMed

Publication types

MeSH terms