

Differences in Host Cell Invasion and Salmonella Pathogenicity Island 1 Expression between Salmonella enterica Serovar Paratyphi A and Nontyphoidal S. Typhimurium
- PMID: 26857569
- PMCID: PMC4807488
- DOI: 10.1128/IAI.01461-15
Differences in Host Cell Invasion and Salmonella Pathogenicity Island 1 Expression between Salmonella enterica Serovar Paratyphi A and Nontyphoidal S. Typhimurium
Abstract
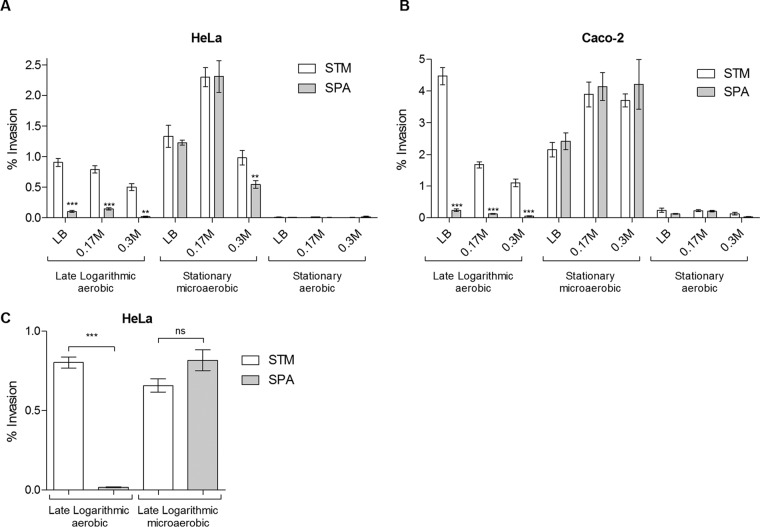
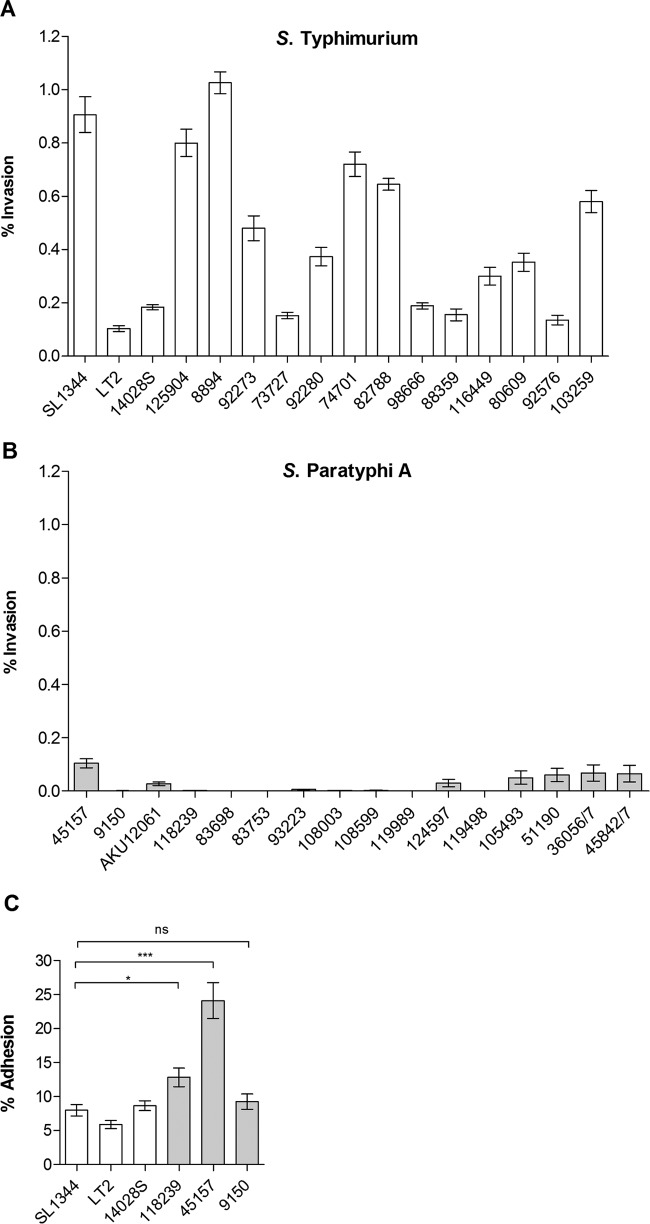
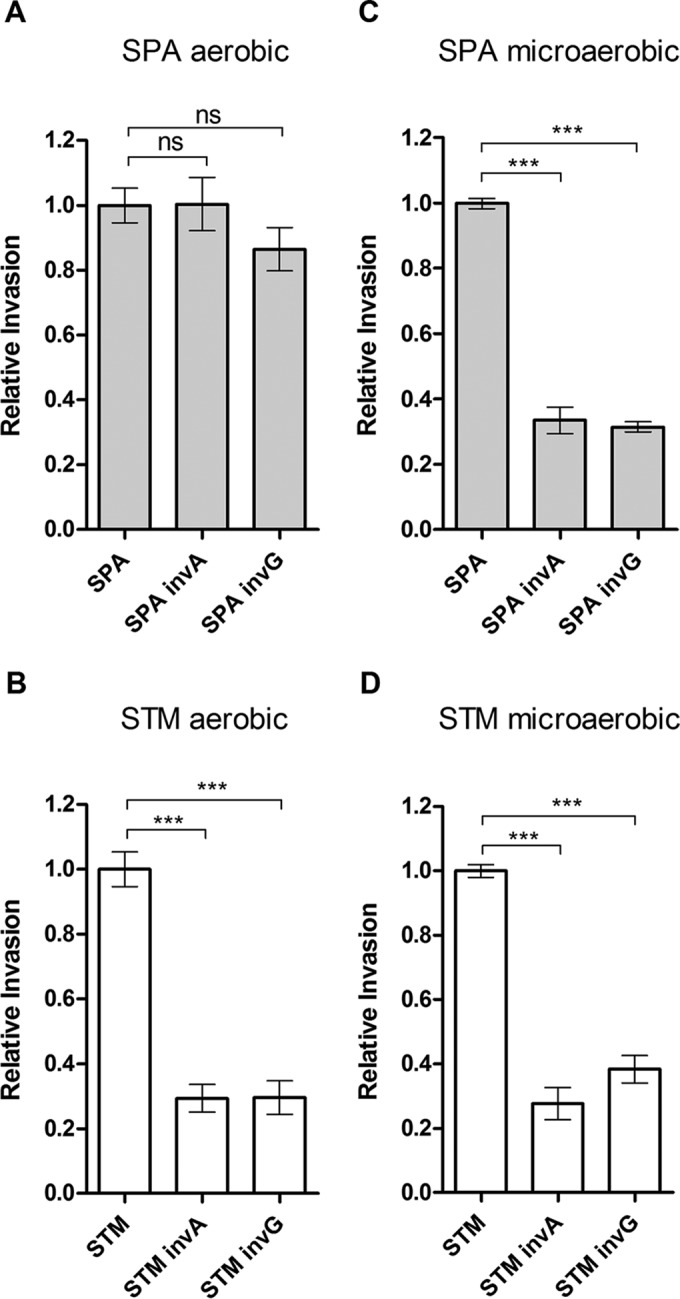
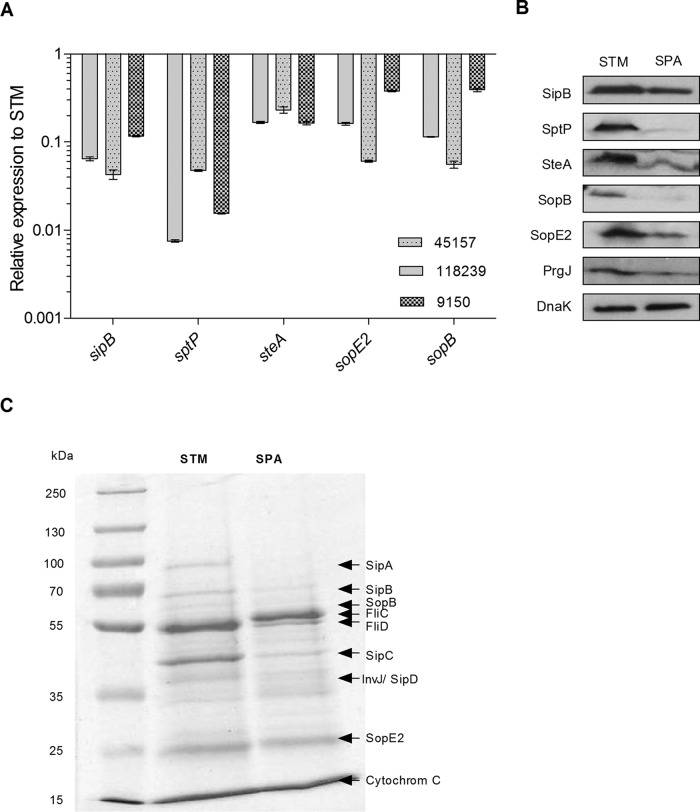
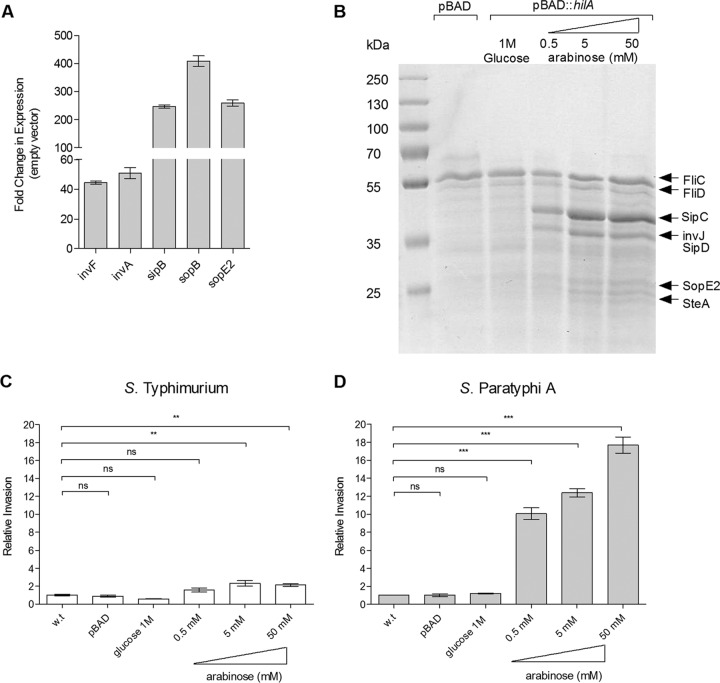
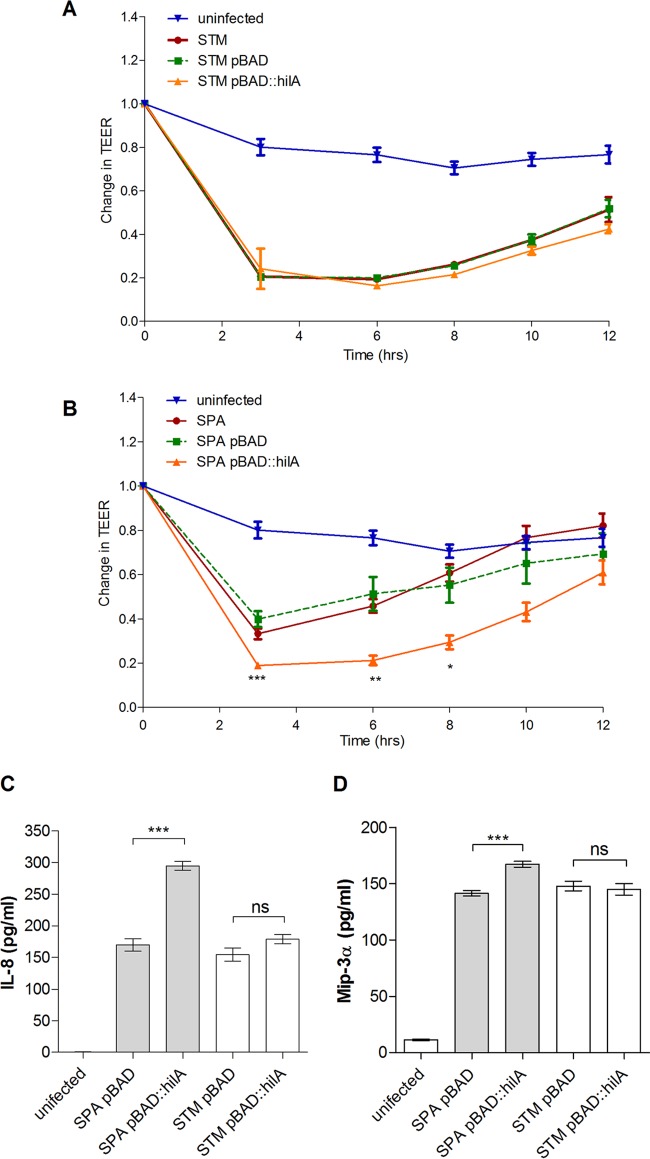
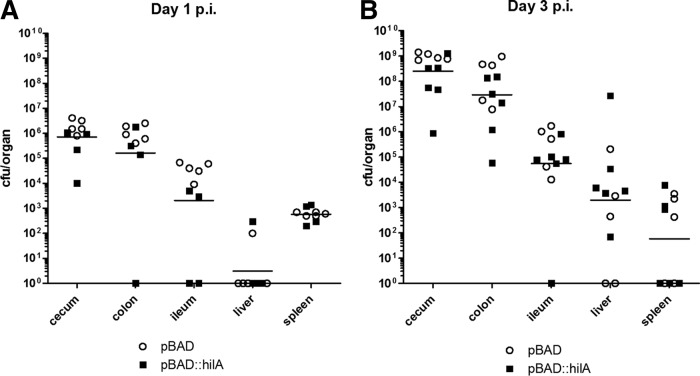
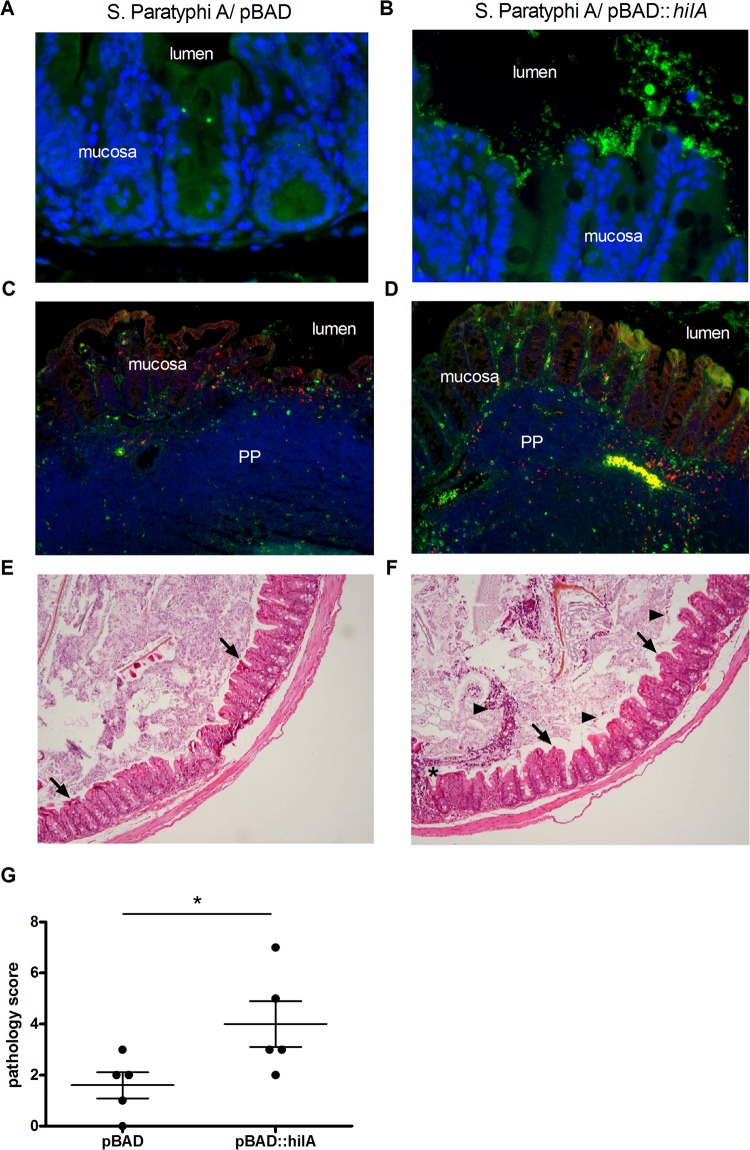
Active invasion into nonphagocytic host cells is central to Salmonella enterica pathogenicity and dependent on multiple genes within Salmonella pathogenicity island 1 (SPI-1). Here, we explored the invasion phenotype and the expression of SPI-1 in the typhoidal serovarS Paratyphi A compared to that of the nontyphoidal serovarS Typhimurium. We demonstrate that while S. Typhimurium is equally invasive under both aerobic and microaerobic conditions, S. Paratyphi A invades only following growth under microaerobic conditions. Transcriptome sequencing (RNA-Seq), reverse transcription-PCR (RT-PCR), Western blot, and secretome analyses established that S. Paratyphi A expresses much lower levels of SPI-1 genes and secretes lesser amounts of SPI-1 effector proteins than S. Typhimurium, especially under aerobic growth. Bypassing the native SPI-1 regulation by inducible expression of the SPI-1 activator, HilA, considerably elevated SPI-1 gene expression, host cell invasion, disruption of epithelial integrity, and induction of proinflammatory cytokine secretion by S. Paratyphi A but not by S. Typhimurium, suggesting that SPI-1 expression is naturally downregulated inS Paratyphi A. Using streptomycin-treated mice, we were able to establish substantial intestinal colonization byS Paratyphi A and showed moderately higher pathology and intestinal inflammation in mice infected with S. Paratyphi A overexpressing hilA Collectively, our results reveal unexpected differences in SPI-1 expression between S. Paratyphi A andS Typhimurium, indicate that S. Paratyphi A host cell invasion is suppressed under aerobic conditions, and suggest that lower invasion in aerobic sites and suppressed expression of immunogenic SPI-1 components contributes to the restrained inflammatory infection elicited by S. Paratyphi A.
Copyright © 2016, American Society for Microbiology. All Rights Reserved.
Figures
Similar articles
-
Flagellin Is Required for Host Cell Invasion and Normal Salmonella Pathogenicity Island 1 Expression by Salmonella enterica Serovar Paratyphi A.Infect Immun. 2015 Sep;83(9):3355-68. doi: 10.1128/IAI.00468-15. Epub 2015 Jun 8. Infect Immun. 2015. PMID: 26056383 Free PMC article.
-
Differences in the expression of SPI-1 genes pathogenicity and epidemiology between the emerging Salmonella enterica serovar Infantis and the model Salmonella enterica serovar Typhimurium.J Infect Dis. 2019 Aug 9;220(6):1071-1081. doi: 10.1093/infdis/jiz235. J Infect Dis. 2019. PMID: 31062854
-
Delineation of the Salmonella enterica serovar Typhimurium HilA regulon through genome-wide location and transcript analysis.J Bacteriol. 2007 Jul;189(13):4587-96. doi: 10.1128/JB.00178-07. Epub 2007 May 4. J Bacteriol. 2007. PMID: 17483226 Free PMC article.
-
Typhoidal Salmonella: Distinctive virulence factors and pathogenesis.Cell Microbiol. 2018 Sep;20(9):e12939. doi: 10.1111/cmi.12939. Epub 2018 Aug 9. Cell Microbiol. 2018. PMID: 30030897 Review.
-
Salmonella effector proteins and host-cell responses.Cell Mol Life Sci. 2011 Nov;68(22):3687-97. doi: 10.1007/s00018-011-0841-0. Epub 2011 Oct 9. Cell Mol Life Sci. 2011. PMID: 21984608 Free PMC article. Review.
Cited by
-
Persistent Infection and Long-Term Carriage of Typhoidal and Nontyphoidal Salmonellae.Clin Microbiol Rev. 2018 Nov 28;32(1):e00088-18. doi: 10.1128/CMR.00088-18. Print 2019 Jan. Clin Microbiol Rev. 2018. PMID: 30487167 Free PMC article. Review.
-
Chitinase A, a tightly regulated virulence factor of Salmonella enterica serovar Typhimurium, is actively secreted by a Type 10 Secretion System.PLoS Pathog. 2023 Apr 5;19(4):e1011306. doi: 10.1371/journal.ppat.1011306. eCollection 2023 Apr. PLoS Pathog. 2023. PMID: 37018381 Free PMC article.
-
Intracellular Salmonella Paratyphi A is motile and differs in the expression of flagella-chemotaxis, SPI-1 and carbon utilization pathways in comparison to intracellular S. Typhimurium.PLoS Pathog. 2022 Apr 5;18(4):e1010425. doi: 10.1371/journal.ppat.1010425. eCollection 2022 Apr. PLoS Pathog. 2022. PMID: 35381053 Free PMC article.
-
The Not so Good, the Bad and the Ugly: Differential Bacterial Adhesion and Invasion Mediated by Salmonella PagN Allelic Variants.Microorganisms. 2020 Mar 30;8(4):489. doi: 10.3390/microorganisms8040489. Microorganisms. 2020. PMID: 32235448 Free PMC article.
-
Campylobacter in an Urban Estuary: Public Health Insights from Occurrence, HeLa Cytotoxicity, and Caco-2 Attachment Cum Invasion.Microbes Environ. 2019 Dec 27;34(4):436-445. doi: 10.1264/jsme2.ME19088. Epub 2019 Nov 16. Microbes Environ. 2019. PMID: 31735766 Free PMC article.
References
-
- Kraus MD, Amatya B, Kimula Y. 1999. Histopathology of typhoid enteritis: morphologic and immunophenotypic findings. Mod Pathol 12:949–955. - PubMed
-
- Nguyen QC, Everest P, Tran TK, House D, Murch S, Parry C, Connerton P, Phan VB, To SD, Mastroeni P, White NJ, Tran TH, Vo VH, Dougan G, Farrar JJ, Wain J. 2004. A clinical, microbiological, and pathological study of intestinal perforation associated with typhoid fever. Clin Infect Dis 39:61–67. doi:10.1086/421555. - DOI - PubMed
-
- Sprinz H, Gangarosa EJ, Williams M, Hornick RB, Woodward TE. 1966. Histopathology of the upper small intestines in typhoid fever. Biopsy study of experimental disease in man. Am J Dig Dis 11:615–624. - PubMed
Publication types
MeSH terms
Substances
Grants and funding
- R01 AI073971/AI/NIAID NIH HHS/United States
- HHSN272200900040C/AI/NIAID NIH HHS/United States
- HHSN272200900040C/PHS HHS/United States
- R01 AI039557/AI/NIAID NIH HHS/United States
- AI039557/AI/NIAID NIH HHS/United States
- AI073971/AI/NIAID NIH HHS/United States
- R01 AI083646/AI/NIAID NIH HHS/United States
- AI083646/AI/NIAID NIH HHS/United States
- R56 AI077645/AI/NIAID NIH HHS/United States
- R01 AI052237/AI/NIAID NIH HHS/United States
- R01 AI075093/AI/NIAID NIH HHS/United States
- AI052237/AI/NIAID NIH HHS/United States
- AI075093/AI/NIAID NIH HHS/United States
- AI077645/AI/NIAID NIH HHS/United States
LinkOut - more resources
Full Text Sources
Other Literature Sources
