. 2016 Mar 24;84(4):1123-1136.
doi: 10.1128/IAI.01497-15. Print 2016 Apr.

Trypanosoma cruzi Causes Paralyzing Systemic Necrotizing Vasculitis Driven by Pathogen-Specific Type I Immunity in Mice

Affiliations

Trypanosoma cruzi Causes Paralyzing Systemic Necrotizing Vasculitis Driven by Pathogen-Specific Type I Immunity in Mice

Ester Roffê et al. Infect Immun. .

Abstract

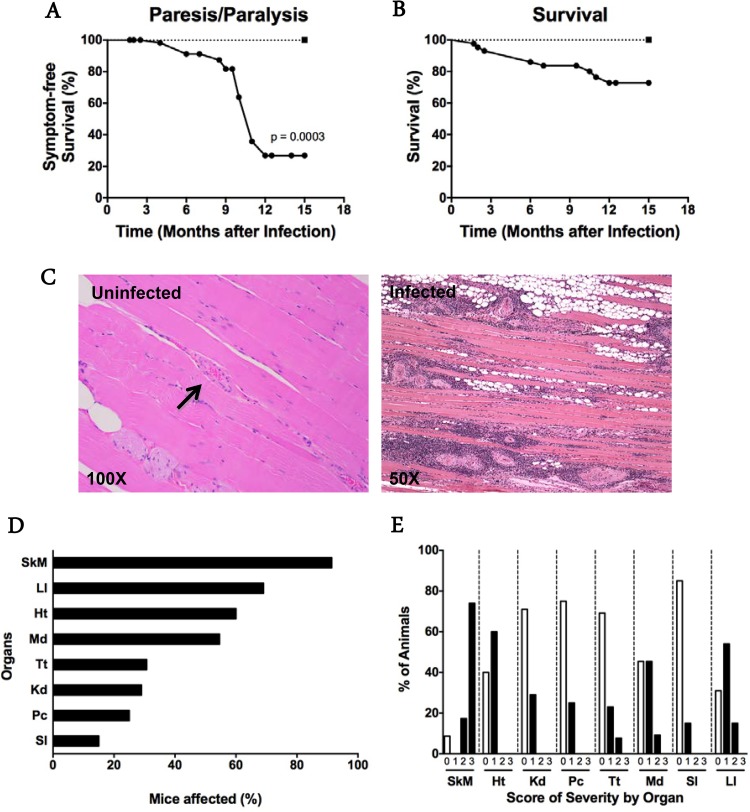
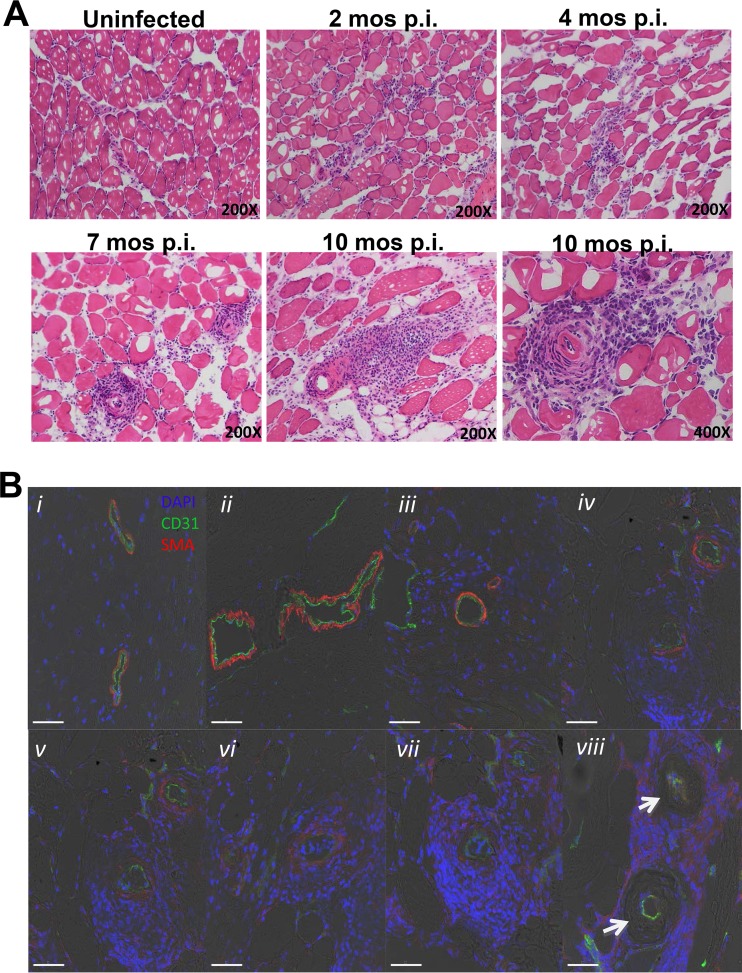
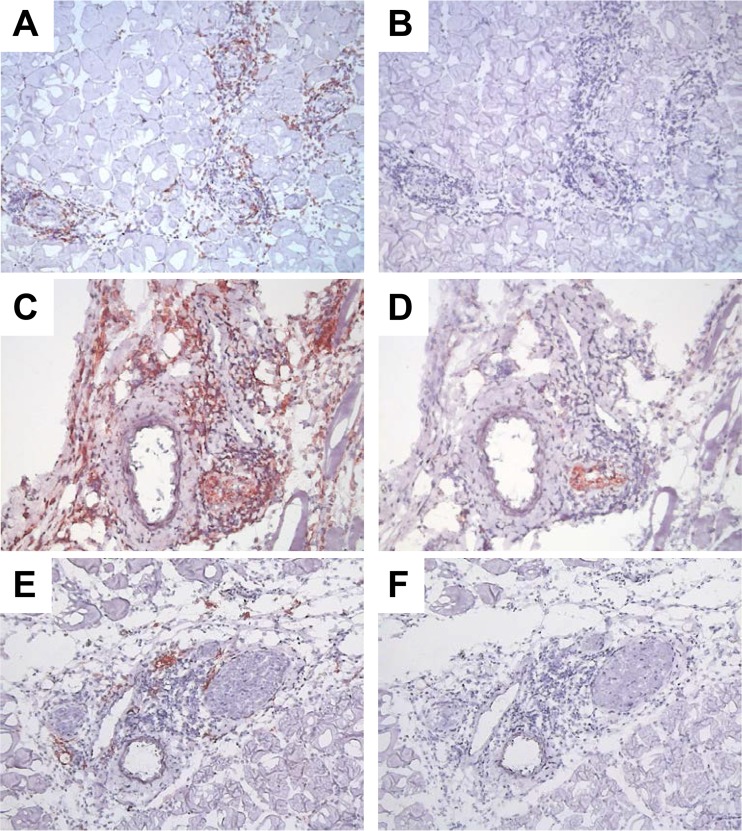
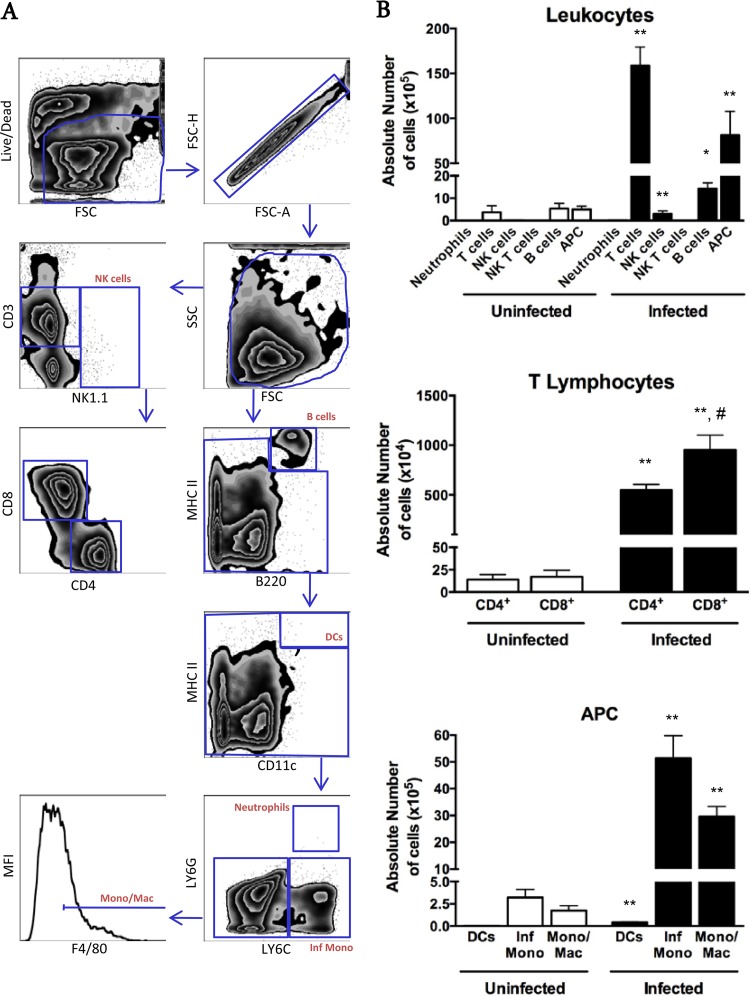
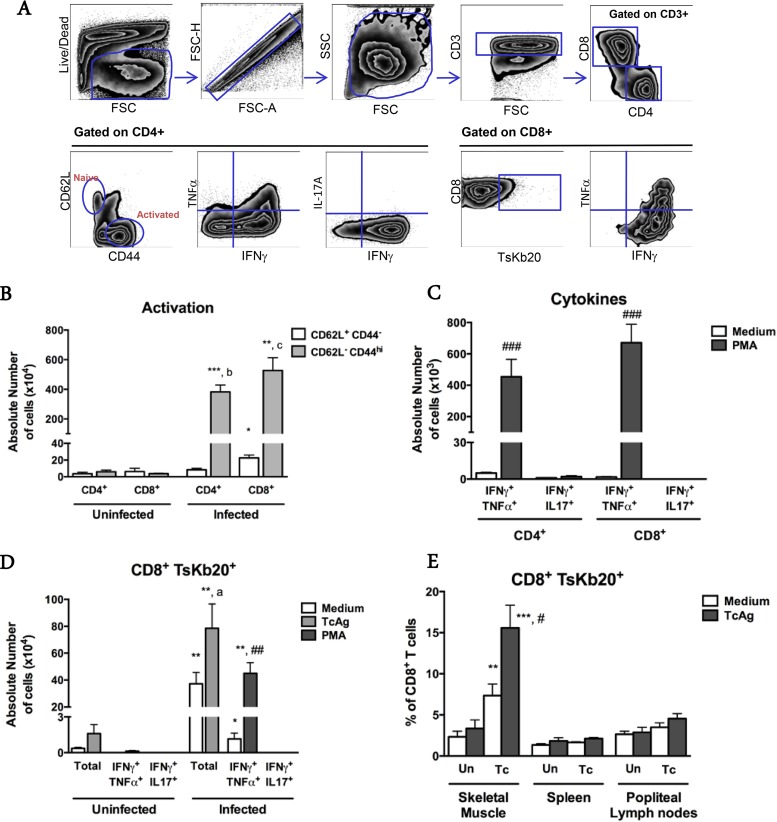
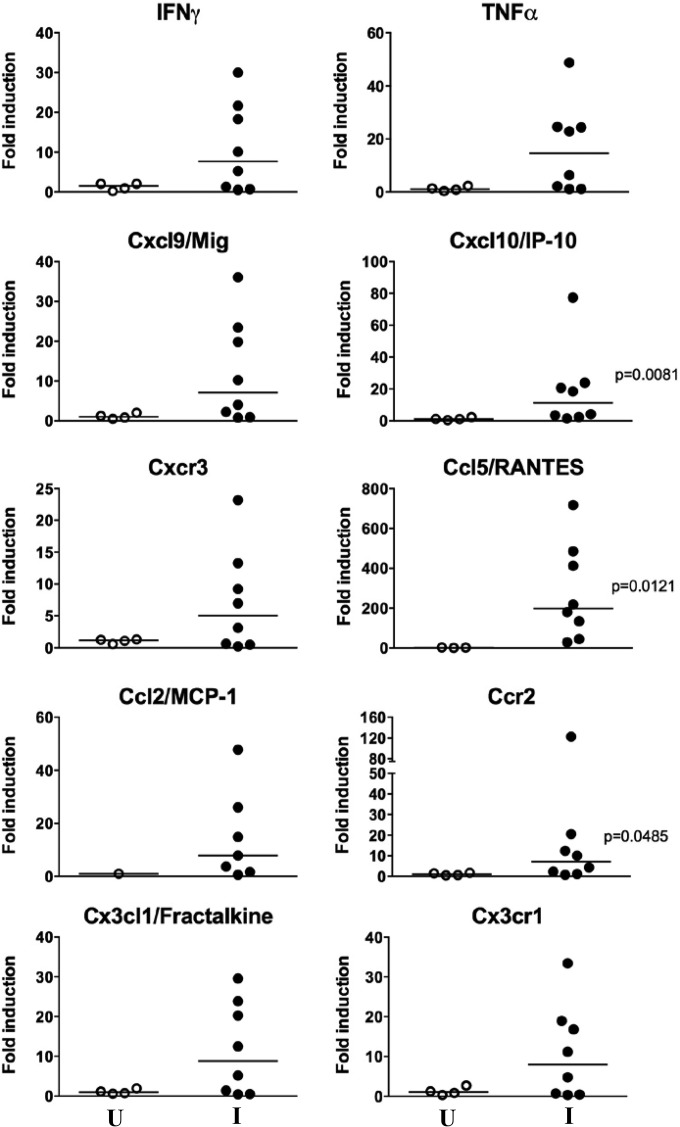
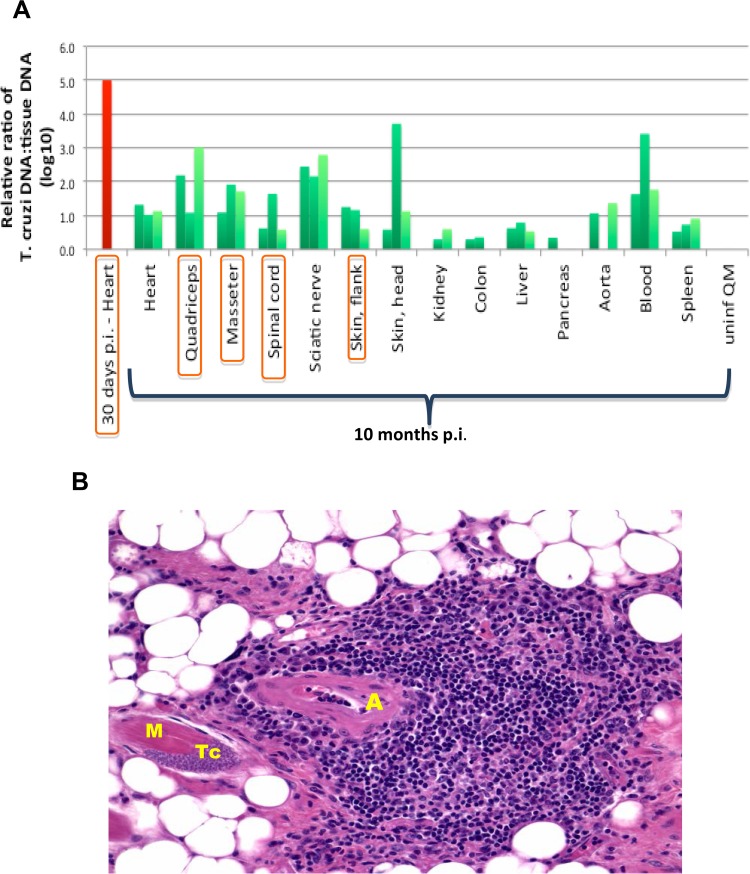
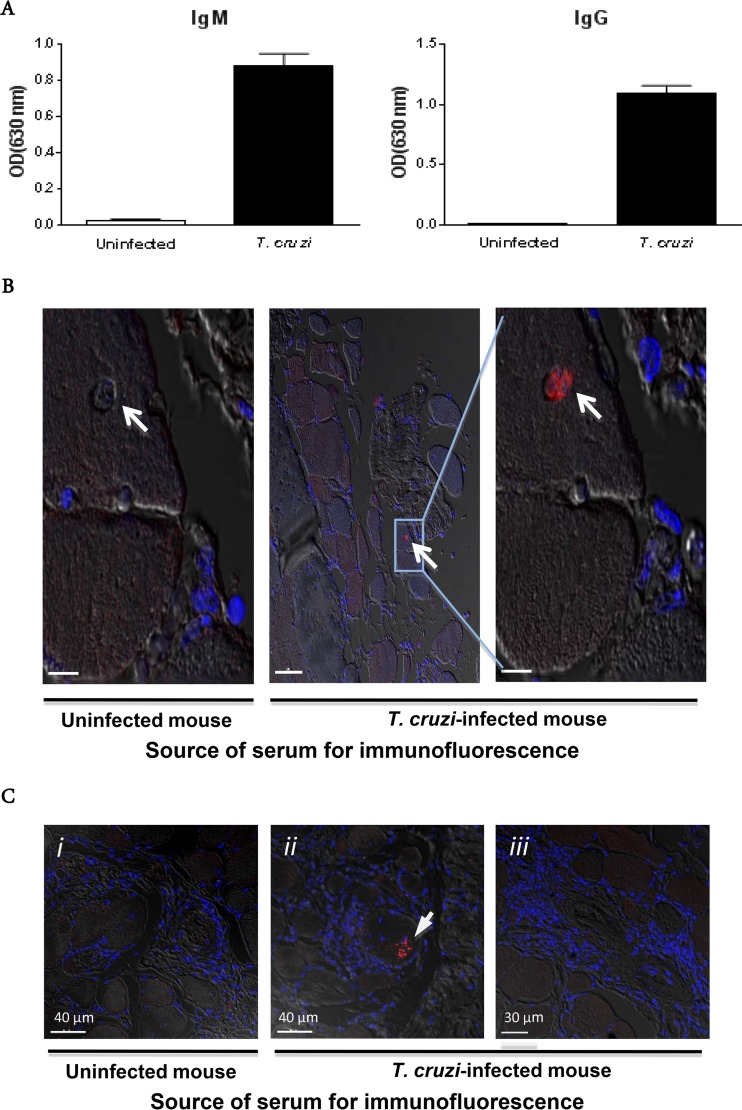
Infectious agents are often considered potential triggers of chronic inflammatory disease, including autoimmunity; however, direct evidence is usually lacking. Here we show that following control of acute infection of mice with the myotropic Colombiana strain of Trypanosoma cruzi, parasites persisted in tissue at low levels associated with development of systemic necrotizing vasculitis. Lesions occurred in many but not all organs and tissues, with skeletal muscle arteries being the most severely affected, and were associated with myositis, atrophy, paresis/paralysis, and death. Histopathology showed fibrinoid vascular necrosis, rare amastigote nests within skeletal muscle myocytes, and massive leukocyte infiltrates composed mainly of inflammatory monocytes, F4/80(+)macrophages, and T. cruzi tetramer-specific CD8(+) T lymphocytes capable of producing gamma interferon (IFN-γ) and tumor necrosis factor alpha (TNF-α) but not interleukin-17 (IL-17). T. cruzi-specific IgG was detected in sera from infected mice, but antibody deposits and neutrophilic inflammation were not features of the lesions. Thus,T. cruzi infection of mice may be a specific infectious trigger of paralyzing systemic necrotizing vasculitis most severely affecting skeletal muscle, driven by pathogen-specific type I immune responses.


Figures

FIG 1
FIG 1
T. cruzi causes systemic arteritis late after infection in C57BL/6J mice. (A and B) Paresis/paralysis and survival were monitored over time. Paresis/paralysis refers to the posterior limbs. For panels A and B, 60 and 43 infected mice, respectively (closed circles), and 10 uninfected age-matched control mice (closed squares) were monitored. For panel A, P = 0.0003; for panel B, the curves are not statistically significantly different (log rank test). (C) Representative H&E-stained sections of quadriceps muscles from a chronically infected mouse and an age-matched uninfected control. Arrow, normal arteriole. Images are representative of groups of 12 infected and 8 uninfected mice tested at 7 to 12 months p.i. The prevalence (D) and severity (E) of vasculopathy in mouse organs are indicated by graphs. The severity scoring system was based on the percentage of vessels with lesions, as follows: 0, no lesions; 1, 1 to 30%; 2, 31 to 60%; and 3, 61 to 100%. Abbreviations: Pc, pancreas; Ht, heart; Kd, kidney; LI, large intestine; Md, mediastinum; SI, small intestine; SkM, skeletal muscle; Tt, testis. Data were pooled from two independent experiments, with a total of 11 to 25 animals, at 7 to 15 months p.i.
FIG 2
FIG 2
Histopathology of systemic necrotizing vasculitis lesions in skeletal muscle late after T. cruzi infection of C57BL/6J mice. Sections of quadriceps muscles were analyzed. (A) Time course of infection. Samples were obtained from mice at the indicated time points after infection and stained with H&E. Images are representative of a total of 3 mice analyzed per time point. (B) Development of fibrinoid necrosis. Samples of vascular lesions with different degrees of severity (i to viii) were stained for immunofluorescence with DAPI (blue) and with antibodies directed against CD31 (green) and smooth muscle cell actin (SMA) (red). Images are representative of 3 mice analyzed 10 months after infection. Confocal immunofluorescence images are superimposed on bright-field images. Arrows, absence of smooth muscle actin.
FIG 3
FIG 3
Distribution of T lymphocytes and macrophages in systemic necrotizing vasculitis lesions in skeletal muscles from T. cruzi-infected mice. Serial sections of skeletal muscle from posterior limbs of 7-month-infected mice were stained with specific antibodies for CD8 (A), F4/80 (B), and iNOS (C) or the respective isotype control antibodies (B, D, and F, respectively) and counterstained with Mayer's hematoxylin. Images are representative of 3 infected mice that were analyzed. Magnification, ×150 (A, B, E, and F) or ×200 (C and D).
FIG 4
FIG 4
Flow cytometric analysis of leukocyte subsets extracted from skeletal muscles of paretic chronically T. cruzi-infected mice. (A) Gating strategy. (B) Quantitative data for the indicated leukocyte subsets. Black bars, infected mice; white bars, respective age-matched uninfected controls. Mono/Mac, monocytes/macrophages; Inf Mono, inflammatory monocytes; APC, antigen-presenting cells; DCs, dendritic cells. Data are from a representative experiment of a total of 2 independent experiments (n = 7 infected and 4 uninfected mice). *, P < 0.05 compared to uninfected controls; **, P < 0.01 compared to uninfected controls; #, P < 0.05 for infected CD8+ versus infected CD4+ T cells, according to the Mann-Whitney test.
FIG 5
FIG 5
Local T. cruzi-specific type I-skewed immune responses in skeletal muscles from chronically T. cruzi-infected mice. (A) Gating strategy. (B to E) Quantitative data for the indicated T cell functional states, analyzed after extraction of leukocytes from the indicated tissue or organ. (B) Lymphocytes were analyzed ex vivo. (C) T cells were restimulated in vitro with PMA-ionomycin or medium for 6 h. (D and E) T cells were restimulated in vitro with PMA-ionomycin for 6 h or with T. cruzi antigen (TcAg) or medium for 18 h. In panel E, “Un” denotes uninfected mice, and “Tc” denotes T. cruzi-infected mice. Data are from a representative experiment of a total of 2 independent experiments (n = 7 infected and 4 uninfected mice). *, **, and ***, P < 0.05, P < 0.01, and P < 0.005, respectively, for comparing corresponding uninfected and infected subpopulations; a, P < 0.05 for comparing medium and TcAg-stimulated conditions; b, P < 0.01 for comparing CD4+ subpopulations in infected mice; c, P < 0.005 for comparing CD8+ subpopulations in infected mice; #, ##, and ###, P < 0.05, P < 0.01, and P < 0.005, respectively, for comparing medium- and PMA-stimulated subpopulations. Statistical analysis was performed by the Mann-Whitney test.
FIG 6
FIG 6
Development of a type I-skewed immune environment in skeletal muscles from chronically T. cruzi-infected mice. Mice were euthanized after developing atrophy and/or partial or total paralysis of the posterior limbs (10 to 12 months p.i.). Expression of mRNAs for the indicated factors was determined by real-time RT-PCR. Filled circles, infected mice (I); open circles, age-matched uninfected controls (U). Data are from one experiment and are presented as individual values and medians. Statistical analysis was performed by the Mann-Whitney test.
FIG 7
FIG 7
T. cruzi is detectable at very low levels in the chronic phase of infection, mainly in organs where systemic necrotizing vasculitis lesions are found. Mice were euthanized at 7 to 12 months p.i. after developing atrophy and/or partial or total paralysis of the posterior limbs. (A) Quantification by real-time PCR of T. cruzi DNA in the indicated organs 10 months after infection (green bars). The negative control was a quadriceps muscle taken from an uninfected mouse 10 months after infection of age-matched infected mice, shown at the right (uninf QM), and the positive control was a heart analyzed 30 days after infection (red). Data are shown for 3 mice for each tissue and condition, except for the acutely infected heart (n = 1). Rare parasite nests were visualized in all tissues whose names are circumscribed in orange. (B) Amastigote nest in a skeletal muscle myocyte adjacent to vasculitis. By H&E staining, a single parasite nest was found in skeletal muscles from a total of 12 mice analyzed. A, arteriole; M, skeletal muscle myocyte; Tc, T. cruzi amastigote nest. Magnification, ×200.
FIG 8
FIG 8
Immune sera identify T. cruzi in myocytes in situ. (A) Parasite-specific antibody responses in paretic T. cruzi-infected mice (10 months p.i.). (B) Immunofluorescence localization of an amastigote nest (white arrow), using serum from a chronically infected mouse. Two serial sections of quadriceps muscle from a paretic T. cruzi-infected mouse were stained with either serum from the same mouse or serum from an age-matched uninfected mouse. The results were confirmed on the same tissue with sera from two other chronically T. cruzi-infected mice. Bars, 7 μm (left), 50 μm (middle), and 7 μm (right). (C) Absence of antibody deposits in systemic necrotizing vasculitis lesions in skeletal muscle. Sections of quadriceps muscle from a paretic T. cruzi-infected mouse were stained with serum from a paretic T. cruzi-infected mouse or an age-matched uninfected mouse. Slides were then stained with an anti-mouse IgG secondary antibody (red) and counterstained with DAPI (blue). Confocal immunofluorescence images are superimposed on bright-field images. i and iii, fields with systemic necrotizing vasculitis lesions; ii, T. cruzi within a skeletal muscle fiber (the arrow denotes an arteriole).
FIG 9
FIG 9
Cardiac fibrosis and dysfunction in chronically T. cruzi-infected mice. Mice were analyzed 7 months after infection with T. cruzi. (A and B) Gomori's trichrome stain for collagen. Images in panel A are representative of a total of 12 animals whose fibrosis varied in severity, as scored in panel B. Magnification, ×400. (C) Ejection fraction measured by ultrasound of infected or age-matched uninfected control mice. The dotted line represents the lower limit of the 99% confidence interval of ejection fractions for uninfected mice (P < 0.05; Fisher's exact test); odds ratios were not statistically significantly different. The solid horizontal lines indicate the medians for the groups analyzed. Data were pooled from 2 independent experiments.

Similar articles

Cited by

References

    1. Guillevin L. 2013. Infections in vasculitis. Best Pract Res Clin Rheumatol 27:19–31. doi:10.1016/j.berh.2013.01.004. - DOI - PubMed
    1. van Timmeren MM, Heeringa P, Kallenberg CG. 2014. Infectious triggers for vasculitis. Curr Opin Rheumatol 26:416–423. doi:10.1097/BOR.0000000000000068. - DOI - PubMed
    1. Said G, Joskowicz M, Barreira AA, Eisen H. 1985. Neuropathy associated with experimental Chagas' disease. Ann Neurol 18:676–683. doi:10.1002/ana.410180609. - DOI - PubMed
    1. Gonzalez Cappa SM, Sanz OP, Muller LA, Molina HA, Fernandez J, Rimoldi MT, Sica RE. 1987. Peripheral nervous system damage in experimental chronic Chagas' disease. Am J Trop Med Hyg 36:41–45. - PubMed
    1. Molina HA, Kierszenbaum F. 1988. Kinetics of development of inflammatory lesions in myocardial and skeletal muscle in experimental Trypanosoma cruzi infection. J Parasitol 74:370–374. doi:10.2307/3282040. - DOI - PubMed

Publication types

MeSH terms