. 2016 Feb 9:6:20611.
doi: 10.1038/srep20611.

CRISPR/Cas9-mediated gene knockout in the mouse brain using in utero electroporation

Affiliations

CRISPR/Cas9-mediated gene knockout in the mouse brain using in utero electroporation

Yohei Shinmyo et al. Sci Rep. .

Abstract

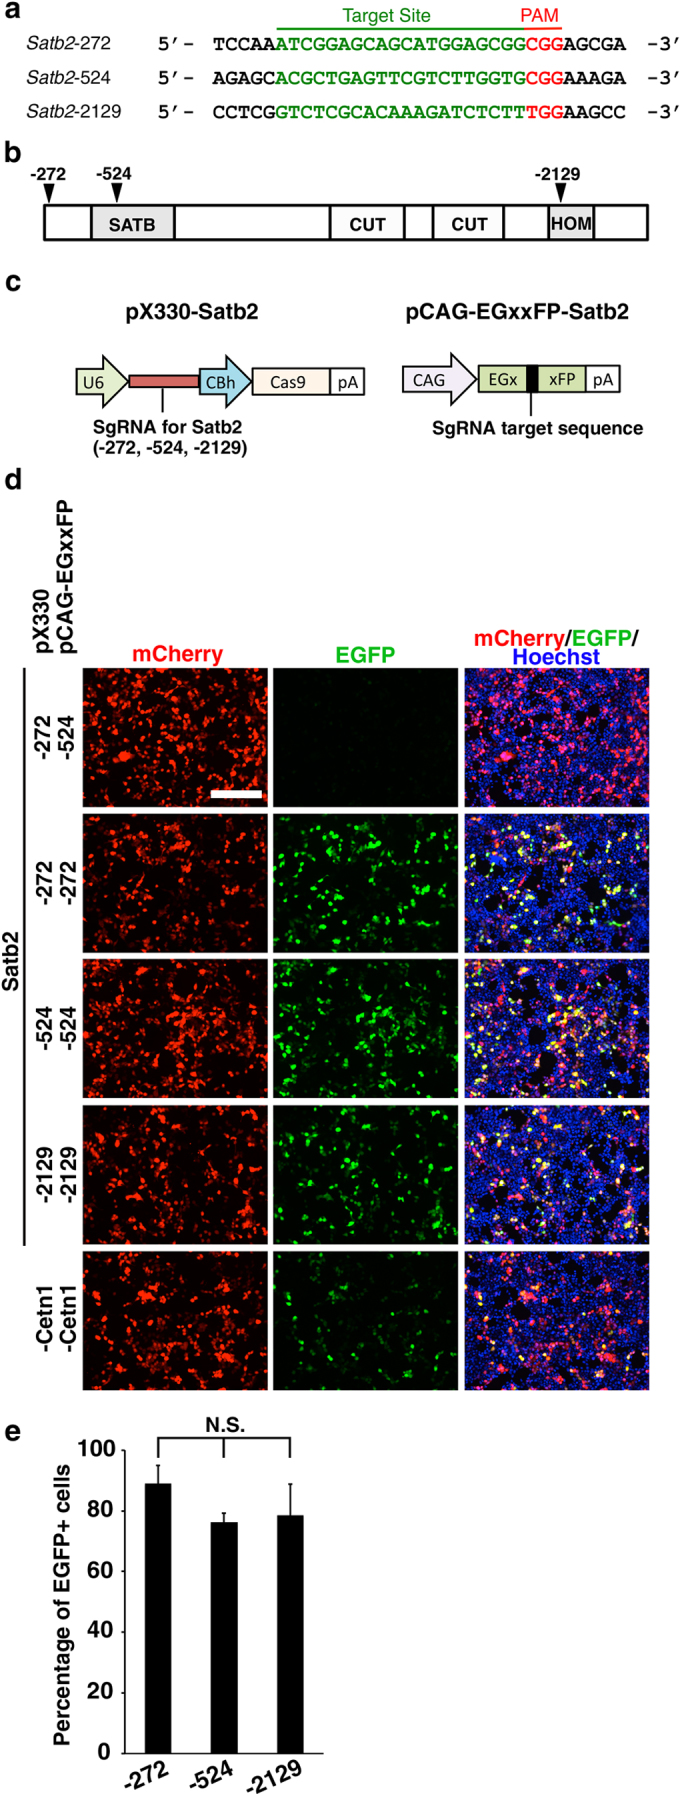
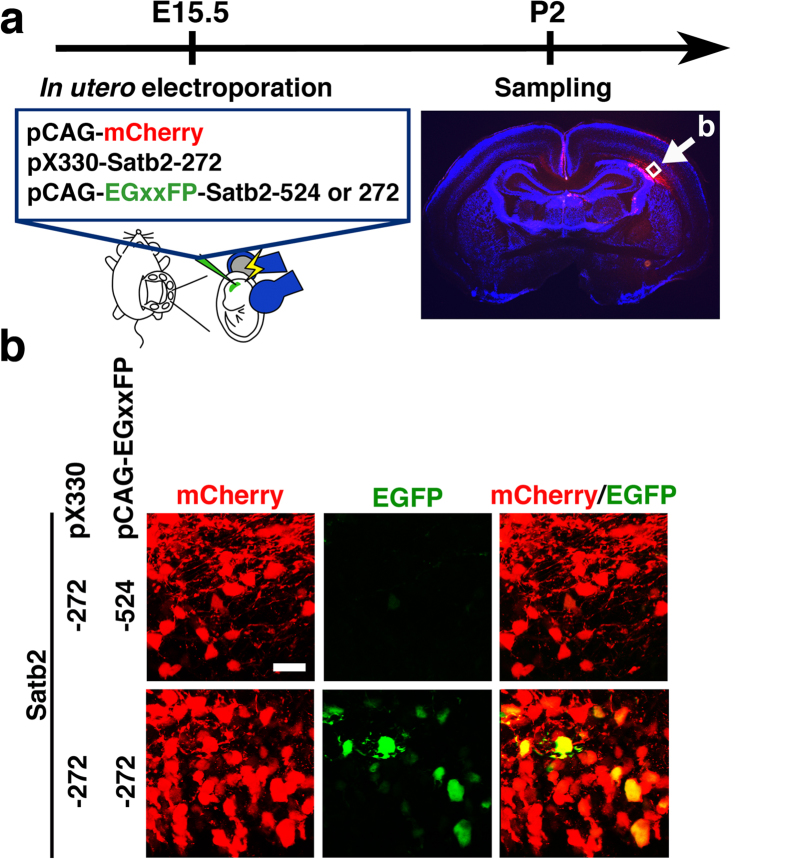
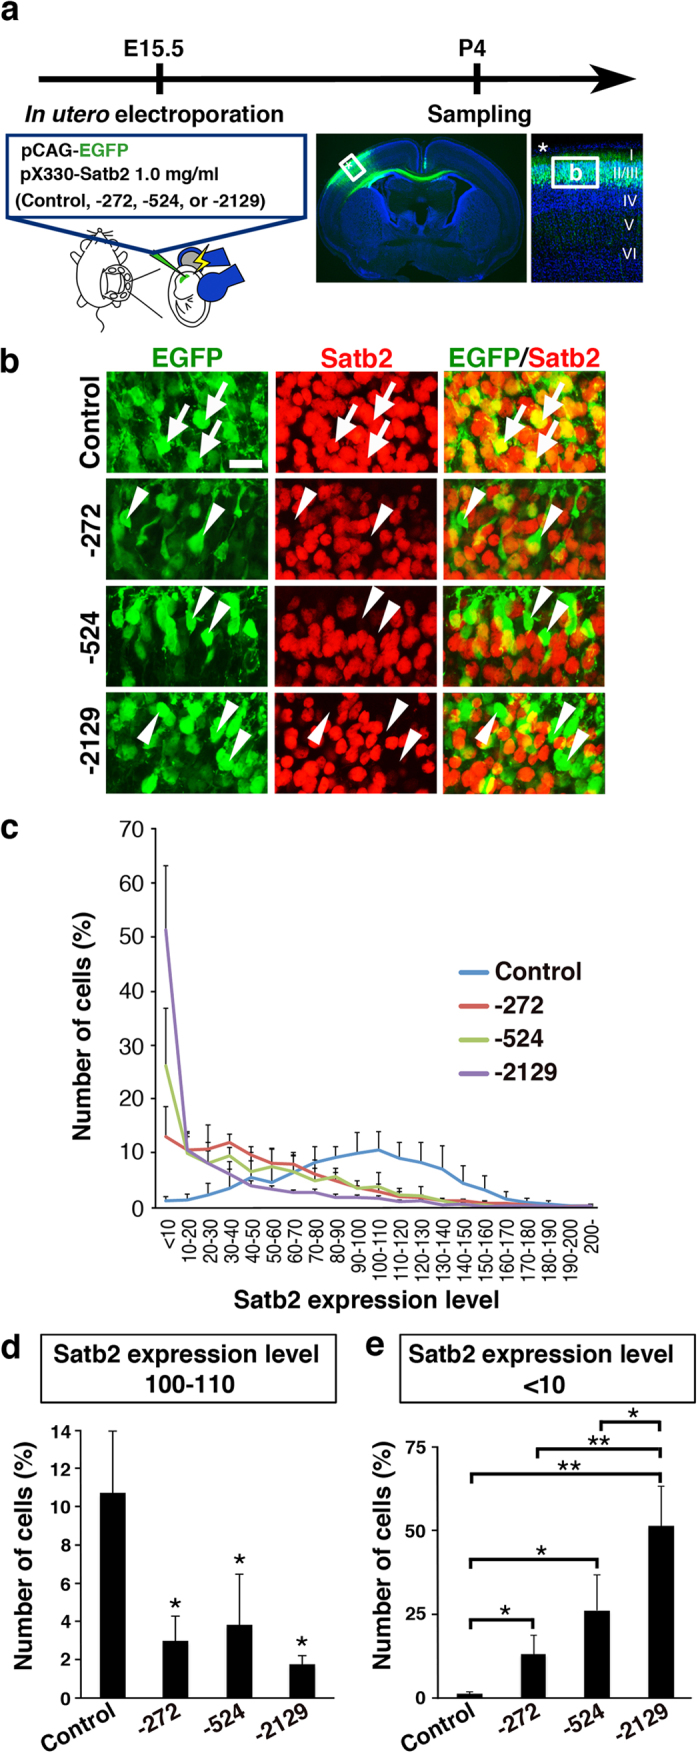
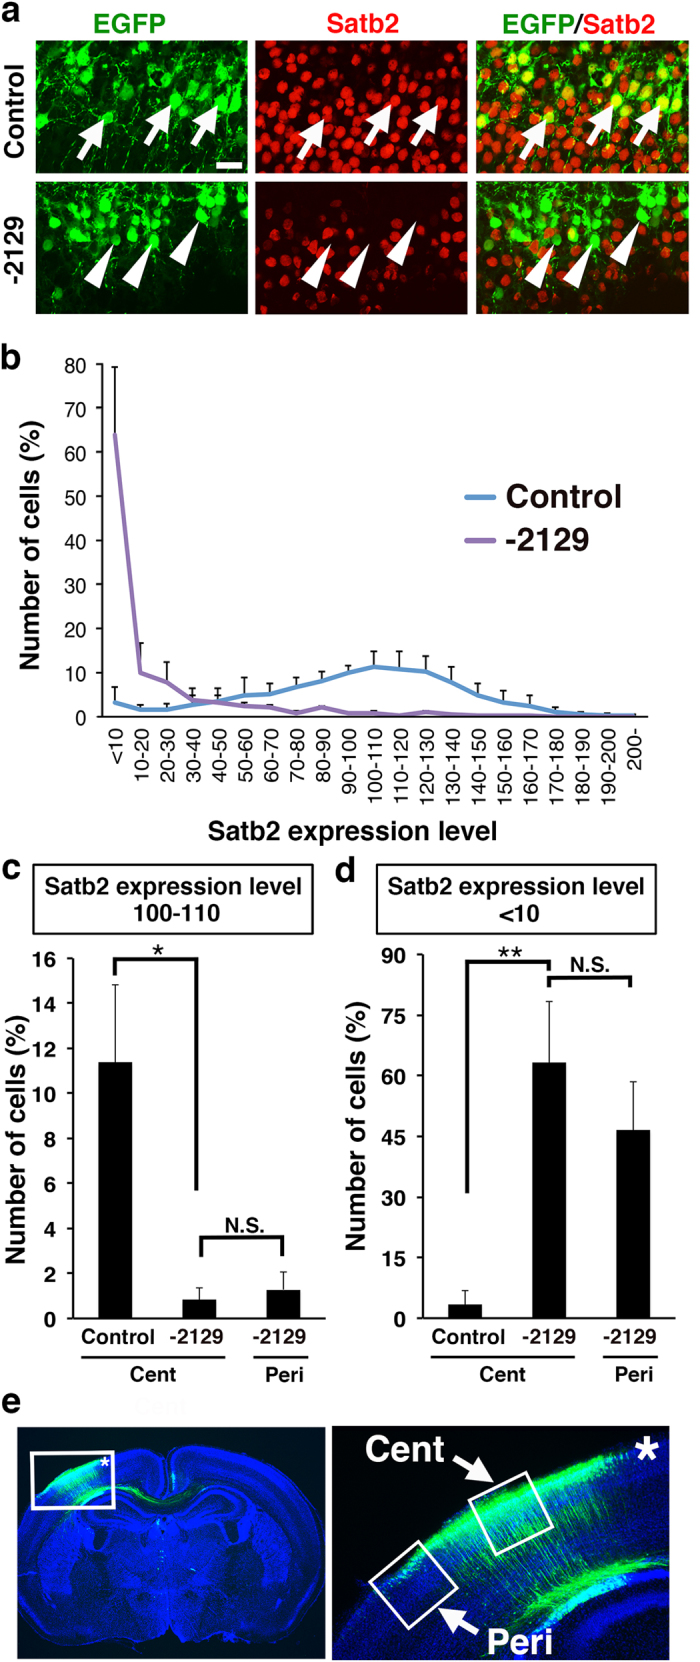
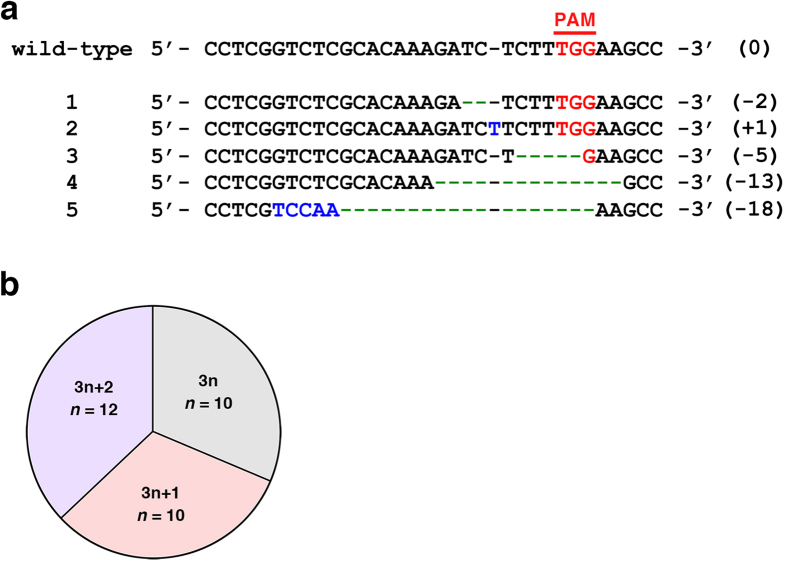
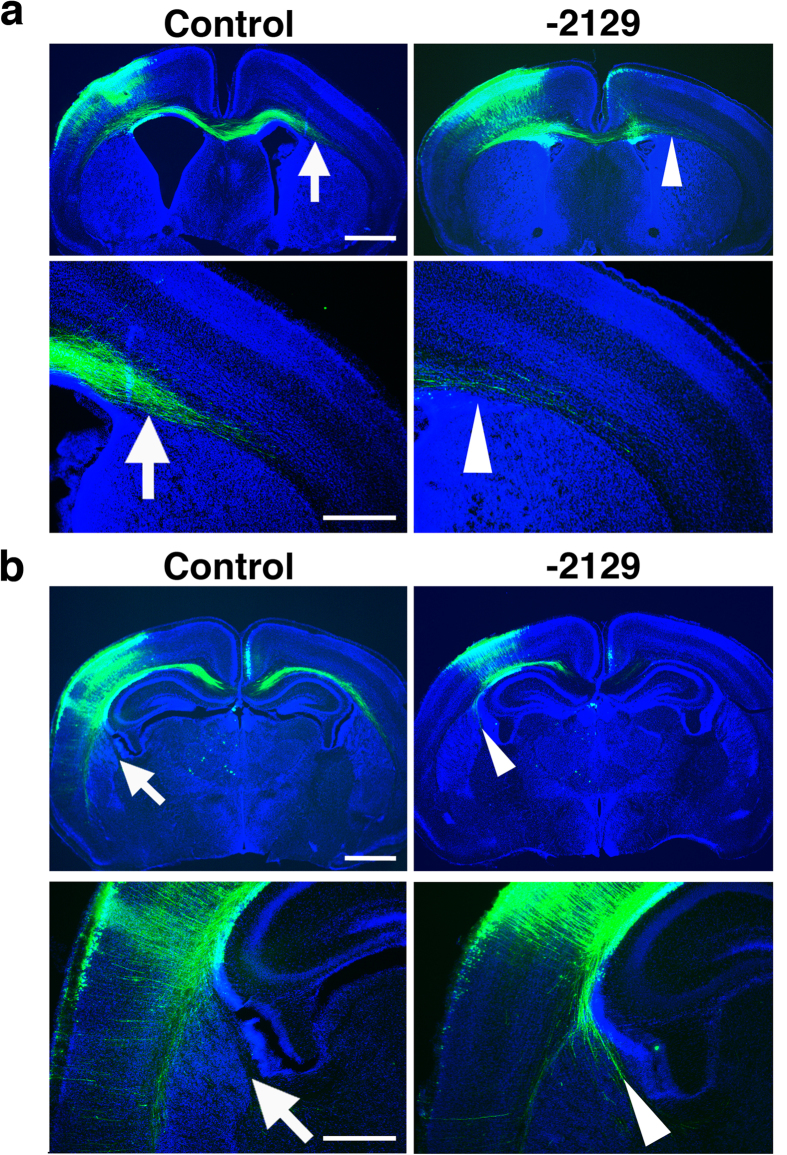
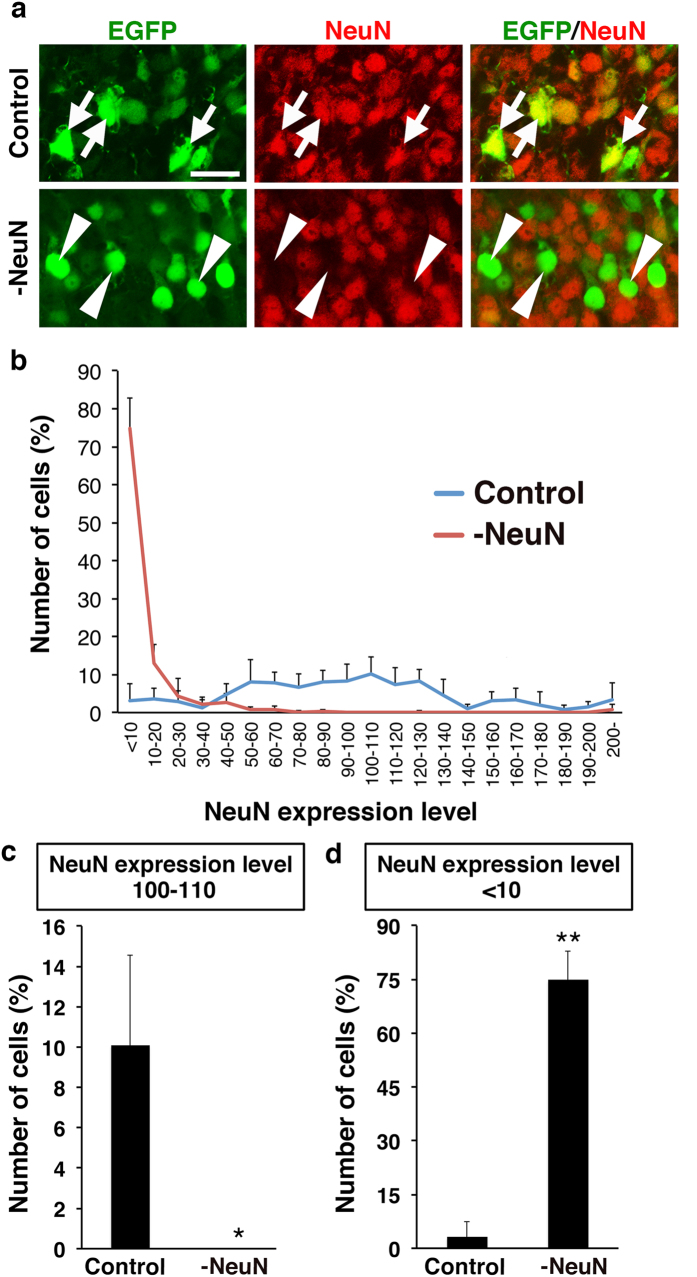
The CRISPR/Cas9 system has recently been adapted for generating knockout mice to investigate physiological functions and pathological mechanisms. Here, we report a highly efficient procedure for brain-specific disruption of genes of interest in vivo. We constructed pX330 plasmids expressing humanized Cas9 and single-guide RNAs (sgRNAs) against the Satb2 gene, which encodes an AT-rich DNA-binding transcription factor and is responsible for callosal axon projections in the developing mouse brain. We first confirmed that these constructs efficiently induced double-strand breaks (DSBs) in target sites of exogenous plasmids both in vitro and in vivo. We then found that the introduction of pX330-Satb2 into the developing mouse brain using in utero electroporation led to a dramatic reduction of Satb2 expression in the transfected cerebral cortex, suggesting DSBs had occurred in the Satb2 gene with high efficiency. Furthermore, we found that Cas9-mediated targeting of the Satb2 gene induced abnormalities in axonal projection patterns, which is consistent with the phenotypes previously observed in Satb2 mutant mice. Introduction of pX330-NeuN using our procedure also resulted in the efficient disruption of the NeuN gene. Thus, our procedure combining the CRISPR/Cas9 system and in utero electroporation is an effective and rapid approach to achieve brain-specific gene knockout in vivo.


Figures

Figure 1
Figure 1. Construction and validation of CRISPR/Cas9 plasmids for Satb2 in HEK293T cells.
(a) Three different target sites (green) followed by the PAM sequence (red) in the Satb2 gene. (b) Schematic representation of the domain structure of Satb2. Arrowheads indicate the three sgRNA target sites used here. The anti-Satb2 antibody used in Figs 3 and 4 recognizes the C-terminal region of the Satb2 protein. (c) pX330-Satb2 plasmid and pCAG-EGxxFP-Satb2 target plasmid. pX330-Satb2 contains expression cassettes of humanized Cas9 and sgRNA for Satb2. pCAG-EGxxFP-Satb2 contains a genomic fragment including the sgRNA target sequence (black) between 5′ and 3′ EGFP fragments (green). (d) The effects of three kinds of pX330-Satb2 on EGFP expression derived from pCAG-EGxxFP-Satb2 target plasmids. pX330-Satb2, pCAG-EGxxFP-Satb2 and pCAG-mCherry were co-transfected into HEK293T cells. When pCAG-EGxxFP-Satb2 contained appropriate target sequences, HEK293T cells transfected with pX330-Satb2-272, -524 or -2129 exhibited EGFP signal in the majority of mCherry-positive transfected cells. pX330-Cetn1 and pCAG-EGxxFP-Cetn1 were used as positive controls. Scale bar = 200 μm. (e) The percentages of mCherry-positive transfected cells which became EGFP-positive. HEK293  cells were transfected with pX330-Satb2, pCAG-EGxxFP-Satb2 and pCAG-mCherry. N.S., not significant; one-way analysis of variance (n = 4 independent experiments). Error bars indicate SD.
Figure 2
Figure 2. Validation of the effects of pX330-Satb2 plasmids on pCAG-EGxxFP-Satb2 target plasmid in the mouse brain.
(a) Experimental procedure. Cortical neurons were co-transfected with pCAG-mCherry, pX330-Satb2-272 plus either pCAG-EGxxFP-Satb2-272 or pCAG-EGxxFP-Satb2–524 using in utero electroporation at E15.5, and coronal sections were prepared at P2. The white square indicates the region which was magnified and shown in (b). (b) High magnification confocal microscopic images. Note that EGFP signal was observed in mCherry-positive neurons transfected with pX330-Satb2-272 and pCAG-EGxxFP-Satb2-272, which contained appropriate target sequences (lower panels). In contrast, when pCAG-EGxxFP-Satb2-524, which contained different target sequences, was used as a reporter plasmid, EGFP signals were not observed (upper panels). Scale bar = 20 μm.
Figure 3
Figure 3. pX330-Satb2 effectively eliminates endogenous Satb2 expression in the mouse cortex.
(a) Experimental procedure. Layer 2/3 neurons were co-transfected with pCAG-EGFP and pX330-Satb2 (1.0 mg/ml) using in utero electroporation at E15.5. Coronal sections were prepared at P4 and stained with anti-Satb2 antibody (red), anti-EGFP antibody (green) and Hoechst 33342 (blue). The area in the box (asterisk) of the middle panel was magnified and shown in the right panel. The box in the right panel is used to indicate the region of each sample which was magnified and shown in (b). Numbers indicate the corresponding layers in the cerebral cortex. (b) High magnification confocal images of layer 2/3 neurons. Arrows indicate normal Satb2 expression in EGFP-positive neurons transfected with pX330 control plasmid. Arrowheads indicate a dramatic reduction of Satb2 expression in EGFP-positive neurons transfected with pX330-Satb2-272, -524 or -2129. Scale bar = 20 μm. (c) Histogram of the expression levels of Satb2 in transfected neurons. The average Satb2 signal intensity in EGFP-positive neurons transfected with a pX330 control vector was set as Satb2 expression level 100. The number of neurons with Satb2 expression level 100-110 and the number of neurons with Satb2 expression level <10 were also shown in (d) and (e), respectively. (d) The number of neurons expressing normal levels of Satb2 protein was greatly reduced by pX330-Satb2-272, -524 and -2129. (e) The number of neurons with no Satb2 expression was markedly increased by pX330-Satb2-272, -524 and -2129. Note that the number of neurons with no Satb2 expression was significantly larger among neurons transfected with pX330-Satb2-2129 compared with those with pX330-Satb2-272 or -524. *p < 0.05; **p < 0.01; Welch’s t-test (n = 4 pups for each condition). Error bars indicate SD.
Figure 4
Figure 4. Higher concentration of pX330-Satb2-2129 efficiently disrupts the Satb2 gene.
(a) Layer 2/3 neurons were co-transfected with pCAG-EGFP and pX330-Satb2 (2.5 mg/ml) using in utero electroporation at E15.5. Coronal sections were prepared at P4 and immunostained with anti-Satb2 antibody (red), anti-EGFP antibody (green) and Hoechst 33342 (blue). Arrows indicate normal Satb2 expression in EGFP-positive neurons transfected with a pX330 control plasmid. Arrowheads indicate a dramatic reduction of Satb2 expression in EGFP-positive neurons transfected with pX330-Satb2-2129. Scale bar = 20 μm. (b) Histogram of the expression levels of Satb2 in transfected neurons. The average Satb2 signal intensity in EGFP-positive neurons transfected with a pX330 control vector was set as Satb2 expression level 100. The number of neurons with Satb2 expression level 100-110 and that of neurons with Satb2 expression level <10 were also shown in (c) and (d), respectively. (c) The number of neurons with normal levels of Satb2 expression was markedly reduced by pX330-Satb2-2129 in the central (Cent) and peripheral (Peri) regions of the EGFP-positive cortical area. (d) The number of neurons with no Satb2 expression was greatly increased by pX330-Satb2-2129 in the central and peripheral regions of the EGFP-positive cortical area. *p < 0.05; **p < 0.01; N.S., not significant; Welch’s t-test (n = 4 pups for each condition). Error bars indicate SD. (e) A coronal section showing central (Cent) and peripheral (Peri) regions of the EGFP-positive cortical area used in (c,d). The area inside the box (asterisk) in the left panel was magnified and shown in the right panel.
Figure 5
Figure 5. CRISPR/Cas9-mediated mutations in the Satb2 locus.
(a) Representative mutations found in the Satb2 locus. The wild-type sequence of the Satb2 gene and five representative mutations are shown. The PAM sequence is marked in red. Green dashes and blue bases indicate deletions and insertions, respectively. The numbers in parentheses indicate the number of bases that had been changed. (b) A pie chart showing frequencies of out-of-frame and of in-frame mutations found in the Satb2 gene.
Figure 6
Figure 6. The effects of pX330-Satb2-2129 on axonal projection patterns of layer 2/3 neurons.
Layer 2/3 neurons were co-transfected with pCAG-EGFP and pX330-Satb2 (2.5 mg/ml) using in utero electroporation at E15.5. Coronal sections were prepared at P4 and stained with anti-EGFP antibody (green) and Hoechst 33342 (blue). (a) Upper panels are low magnification images of coronal sections. Areas indicated by an arrow and an arrowhead in the upper panels are enlarged and shown in the lower panels. Note that EGFP-positive axons extended to the contralateral cortex in control animals (arrows), whereas they were markedly decreased by pX330-Satb2-2129 (arrowheads). Scale bars = 1 mm (upper) and 500 μm (lower). (b) Upper panels are low magnification images of coronal sections located more posterior to the sections in (a). Areas indicated by an arrow and an arrowhead in the upper panels are enlarged and shown in the lower panels. Note that no EGFP-positive axons were found in the internal capsule in control animals (arrows), whereas EGFP-positive axons were found in the internal capsule of animals transfected with pX330-Satb2-2129 (arrowheads). Scale bars = 1 mm (upper) and 500 μm (lower).
Figure 7
Figure 7. pX330-NeuN efficiently disrupts NeuN expression in vivo.
(a) Layer 2/3 neurons were co-transfected with 0.5 mg/ml pCAG-EGFP and 2.5 mg/ml pX330-NeuN using in utero electroporation at E15.5. Coronal sections were prepared at P4 and immunostained with anti-NeuN antibody (red). Arrows indicate normal NeuN expression in EGFP-positive neurons transfected with a pX330 control plasmid. Arrowheads indicate a dramatic reduction of NeuN expression in EGFP-positive neurons transfected with pX330-NeuN. Scale bar = 20 μm. (b) Histogram of the expression levels of NeuN in transfected neurons. The average NeuN signal intensity in EGFP-positive neurons transfected with a pX330 control vector was set as NeuN expression level 100. The number of neurons with NeuN expression level 100-110 and that of neurons with NeuN expression level <10 are also shown in (c,d), respectively. (c) Neurons with normal levels of NeuN expression were eliminated by pX330-NeuN. *p < 0.05; Mann-Whitney U-test (n = 4 pups for each condition). Error bars indicate SD. (d) The number of neurons with no NeuN expression was greatly increased by pX330-NeuN. **p < 0.01; Welch’s t-test (n = 4 pups for each condition). Error bars indicate SD.

Similar articles

Cited by

References

    1. Capecchi M. R. Gene targeting in mice: functional analysis of the mammalian genome for the twenty-first century. Nat. Rev. Genet. 6, 507–512 (2005). - PubMed
    1. Tsien J. Z. et al.. Subregion- and cell type-restricted gene knockout in mouse brain. Cell 87, 1317–1326 (1996). - PubMed
    1. Jinek M. et al.. A programmable dual-RNA-guided DNA endonuclease in adaptive bacterial immunity. Science 337, 816–821 (2012). - PMC - PubMed
    1. Cong L. et al.. Multiplex genome engineering using CRISPR/Cas systems. Science 339, 819–823 (2013). - PMC - PubMed
    1. Mali P. et al.. RNA-guided human genome engineering via Cas9. Science 339, 823–826 (2013). - PMC - PubMed

Publication types

MeSH terms

Substances